. 2020 Oct;32(10):3240-3255.
doi: 10.1105/tpc.20.00016. Epub 2020 Aug 13.

FATTY ACID DESATURASE5 Is Required to Induce Autoimmune Responses in Gigantic Chloroplast Mutants of Arabidopsis

Affiliations

FATTY ACID DESATURASE5 Is Required to Induce Autoimmune Responses in Gigantic Chloroplast Mutants of Arabidopsis

Bingqi Li et al. Plant Cell. 2020 Oct.

Abstract

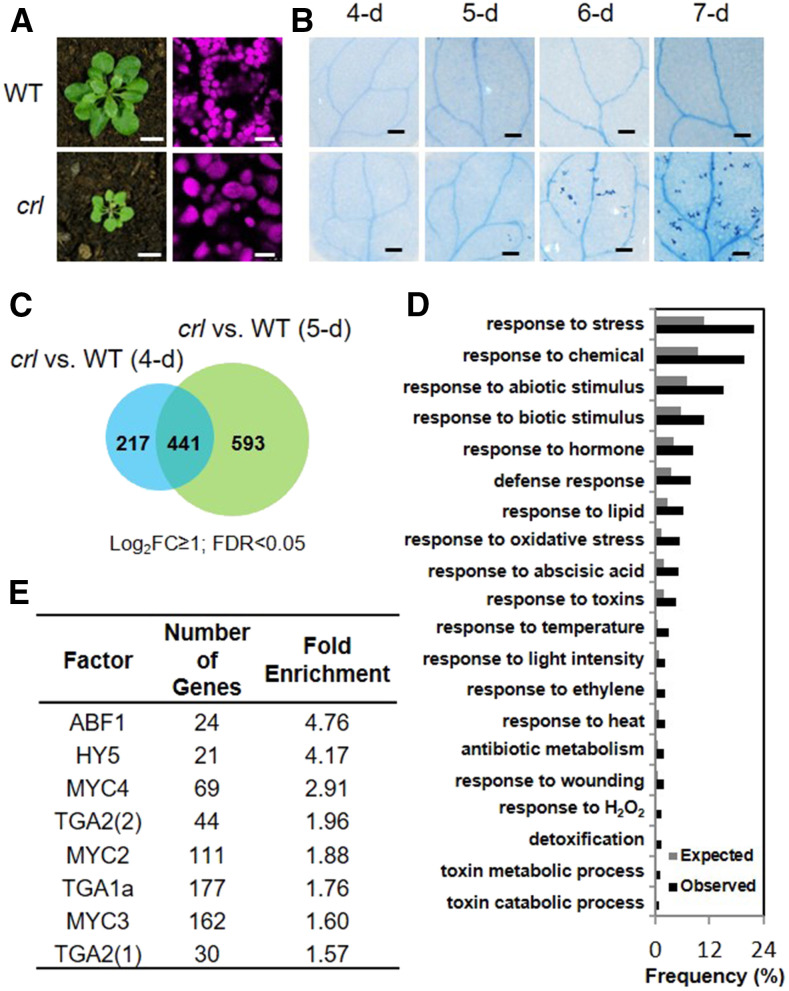
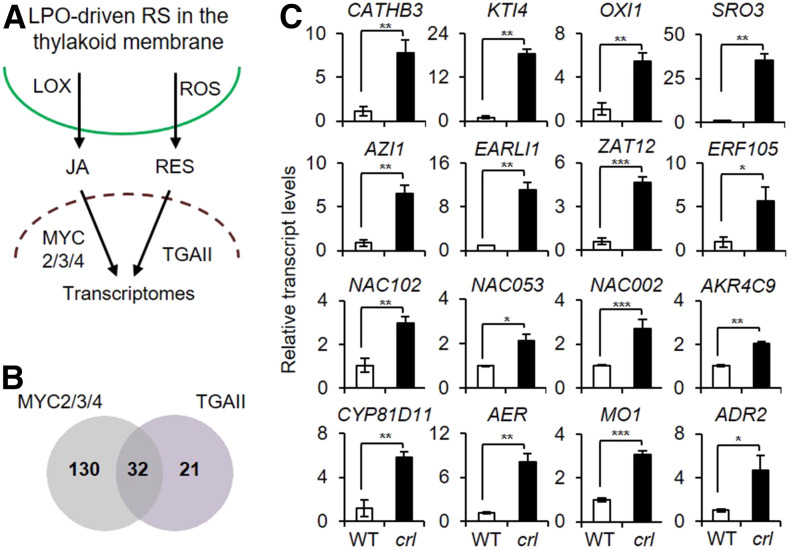
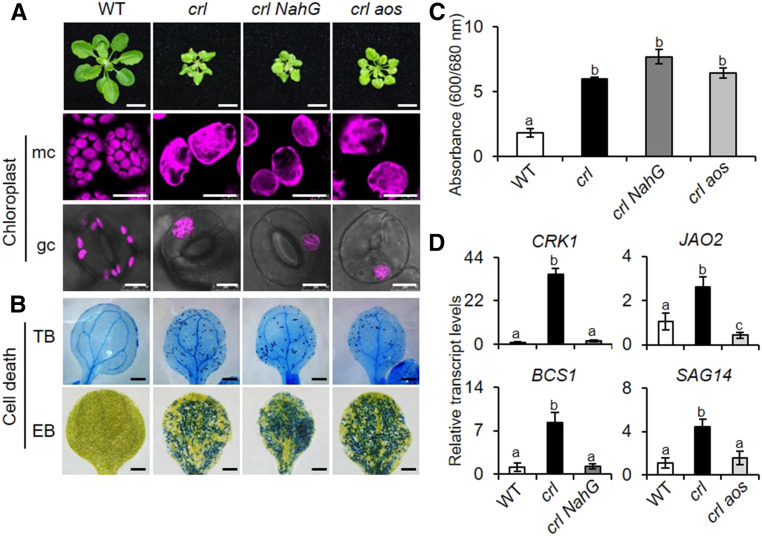
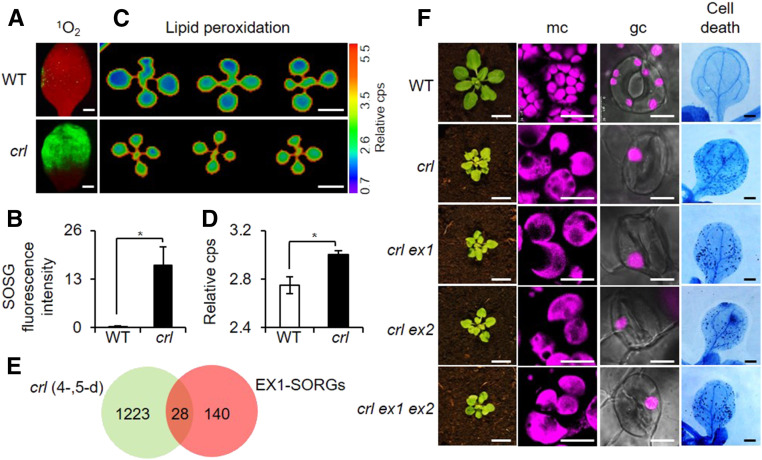
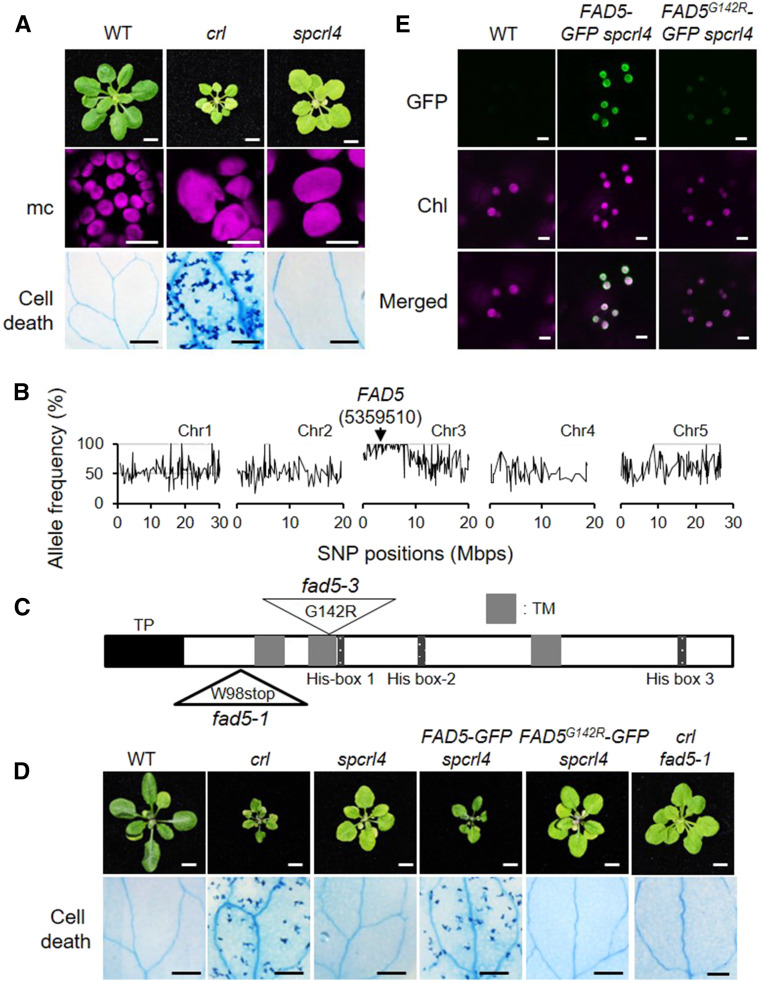
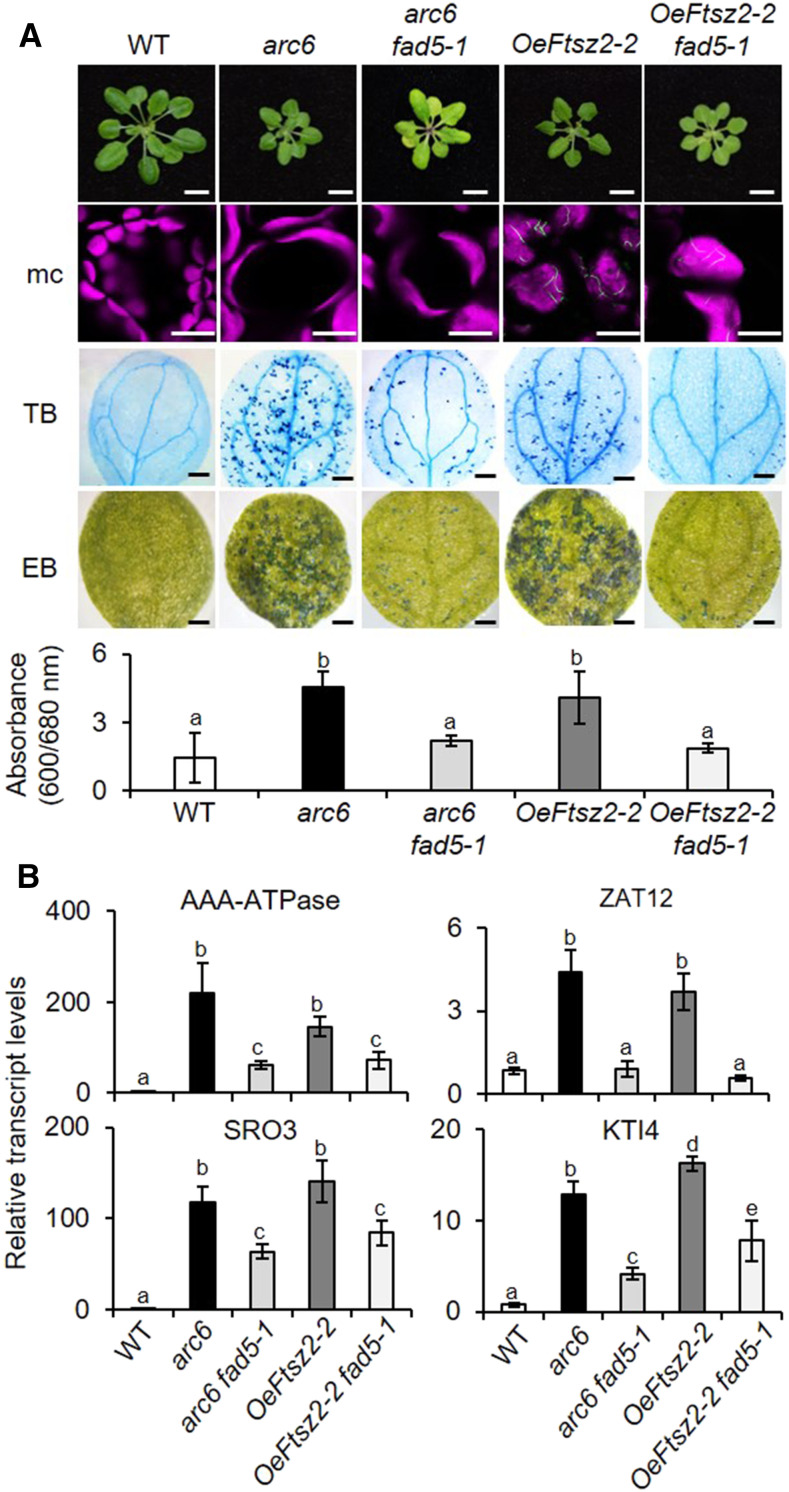
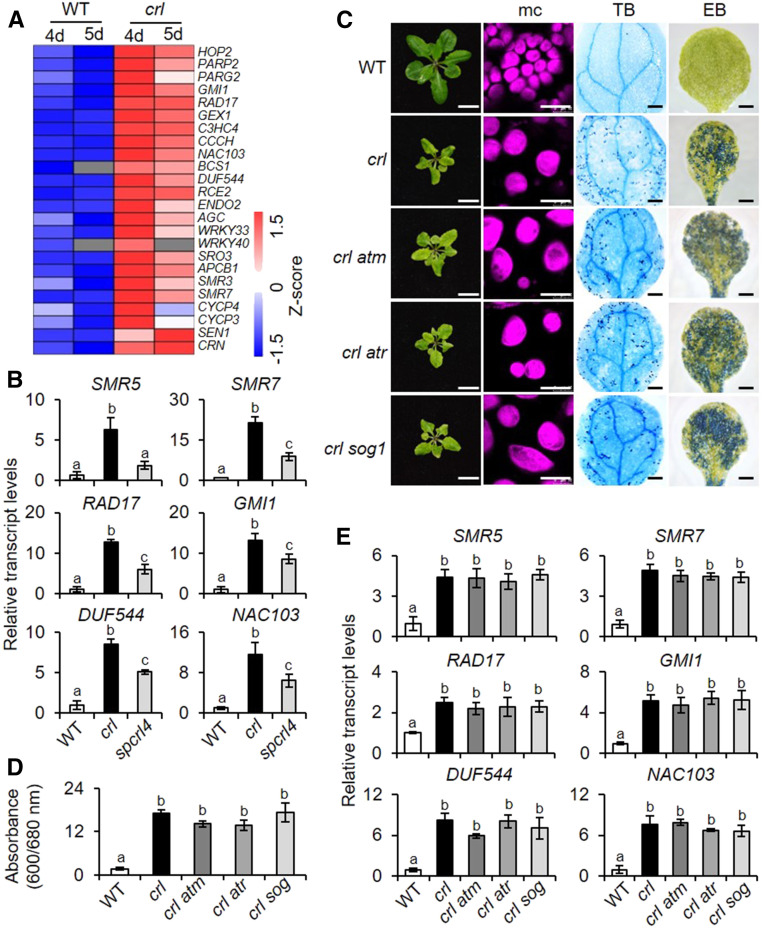
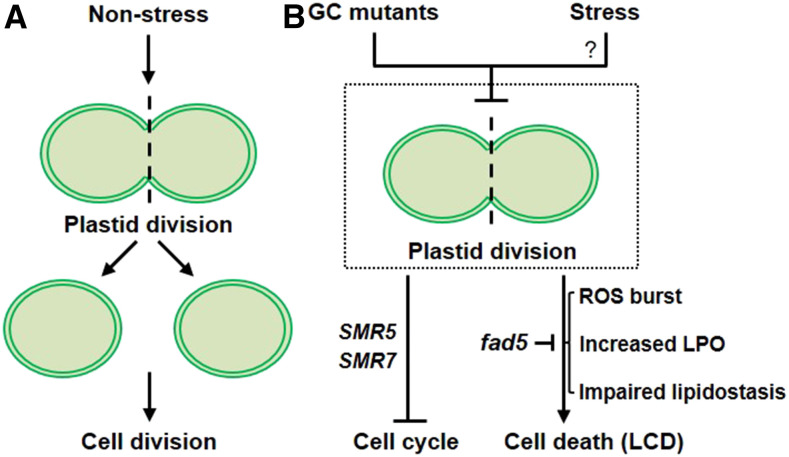
Chloroplasts mediate genetically controlled cell death via chloroplast-to-nucleus retrograde signaling. To decipher the mechanism, we examined chloroplast-linked lesion-mimic mutants of Arabidopsis (Arabidopsis thaliana) deficient in plastid division, thereby developing gigantic chloroplasts (GCs). These GC mutants, including crumpled leaf (crl), constitutively express immune-related genes and show light-dependent localized cell death (LCD), mirroring typical autoimmune responses. Our reverse genetic approach excludes any potential role of immune/stress hormones in triggering LCD. Instead, transcriptome and in silico analyses suggest that reactive electrophile species (RES) generated via oxidation of polyunsaturated fatty acids (PUFAs) or lipid peroxidation-driven signaling may induce LCD. Consistent with these results, the one of the suppressors of crl, dubbed spcrl4, contains a causative mutation in the nuclear gene encoding chloroplast-localized FATTY ACID DESATURASE5 (FAD5) that catalyzes the conversion of palmitic acid (16:0) to palmitoleic acid (16:1). The loss of FAD5 in the crl mutant might attenuate the levels of RES and/or lipid peroxidation due to the reduced levels of palmitic acid-driven PUFAs, which are prime targets of reactive oxygen species. The fact that fad5 also compromises the expression of immune-related genes and the development of LCD in other GC mutants substantiates the presence of an intrinsic retrograde signaling pathway, priming the autoimmune responses in a FAD5-dependent manner.


Figures

Figure 1.
Figure 1.
Upregulation of Stress-Related Genes in crl before the Onset of Cell Death. (A) Representative images of 21-d-old plants grown on soil under CL (left column). Chloroplasts in mesophyll cells were observed in the cotyledons of 5-d-old seedlings under a confocal laser scanning microscope (right column). Bars in left column = 0.8 cm; bars in right column = 15 μm. (B) Representative images of cotyledons showing cell death detected by trypan blue staining in the 4- to 7-d-old wild-type (WT) and crl seedlings grown under CL. Bars = 0.2 mm. (C) Venn diagram showing genes upregulated at least twofold in the 4- and 5-d-old crl versus wild-type (WT) seedlings. FDR, false discovery rate. (D) GO enrichment analysis via Generic GO Term Finder. Observed, data from query; Expected, data from whole Arabidopsis genome. (E) Transcription factors predicted to bind to the indicated cis-element in the regulatory regions of the stress-related genes.
Figure 2.
Figure 2.
JA and RES Signaling Pathways in crl. (A) Simplified scheme showing that lipid peroxidation-driven JA (LOX-dependent) and RES (ROS-dependent) signaling pathways alter the expression of nuclear genes via MYCs and TGAII TFs, respectively. (B) Venn diagram showing the number of TGAII and MYC2/3/4 target genes upregulated in crl compared to wild-type seedlings. (C) Relative expression levels of MYCs- and TGAII-driven selected defense- and detoxification-related genes were analyzed using RT-qPCR. ACT2 was used as an internal standard. Values represent means ± sd of three independent biological replicates. Asterisks indicate significant differences between mean values by Student’s t test (*P < 0.05; **P < 0.01; ***P < 0.001; Supplemental File). WT, wild type.
Figure 3.
Figure 3.
SA- and JA-Independent Cell Death in crl. (A) Macro- and microscopic phenotypes of the wild type (WT), crl, crl NahG, and crl aos. Images are representative of 21-d-old plants grown on soil under CL (bars in top row = 1 cm). Representative confocal images of chlorophyll autofluorescence in mesophyll cells (mc) and guard cells (gc) in 5-d-old seedlings grown on MS medium under CL (bars in middle and bottom rows = 20 μm for mc and 8 μm for gc). (B) Cell death was visualized by TB and EB staining in the cotyledons of 10-d-old seedlings. Bars = 0.1 cm. WT, wild type. (C) Dead cells visualized by EB in (B) were quantified by measuring relative EB absorbance as A600/A680. For EB staining, quantification was done using five cotyledons per genotype. Experiments were repeated at least three times, and the data represent means ± sd (Supplemental File). WT, wild type. (D) Relative transcript levels of SA-responsive genes (CRK1, BSC1) and JA-responsive genes (JAO2, SAG14). Gene expression was determined in 5-d-old seedlings using RT-qPCR. ACT2 was used as an internal standard. Value represents means ± sd of three independent biological replicates. In (B) and (D), lowercase letters indicate statistically significant differences between mean values at each genotype (P < 0.05, one-way ANOVA with Tukey’s post hoc honestly significant difference (HSD) test; Supplemental File). WT, wild type.
Figure 4.
Figure 4.
EXECUTER1-Independent LCD in crl Despite the Increased Level of 1O2. (A) and (B) Cotyledons of 5-d-old seedlings grown under CL were treated with SOSG to detect 1O2-activated SOSG fluorescence. (A) Green SOSG fluorescence was recorded under the fluorescent microscope (using a GFP filter). The red fluorescence is the autofluorescence of chlorophyll in the chloroplasts. Bars = 0.7 mm. (B) Fluorescence intensity as shown in the confocal image was calculated with ImageJ software and normalized to per unit area of the cotyledons. WT, wild type. (C) and (D) Peroxidation-derived autoluminescence represents the relative lipid peroxidation levels in the cotyledons of 10-d-old seedlings grown under CL. Bars = 0.4 cm. (C) Lipid peroxidation was quantified using the relative counts per second (cps) of the autoluminescence. (D) For both SOSG and lipid peroxidation experiments, quantification was done using five cotyledons per genotype. Experiments were repeated at least three times, and the representative data are shown. In (B) and (D), error bars indicate sd and the asterisks indicate significant differences between mean values by Student’s t test (*P < 0.05; Supplemental File). WT, wild type. (E) Venn diagram showing the number of EX1-dependent SORGs (EX1-SORGs) in the crl-induced transcriptome of 4- and 5-d-old seedlings. (F) Foliar phenotypes of 21-d-old wild-type (WT), crl, crl ex1, crl ex2, and crl ex1 ex2 seedlings. Bars in left column = 1 cm. Confocal images showing chlorophyll autofluorescence, which shows the chloroplast morphology in mesophyll cells (mc) and guard cells (gc) in 5-d-old seedlings. Bars in middle columns = 18 µm for mc and 10 µm for gc. Cell death was visualized by TB staining in the cotyledons of 10-d-old seedlings. Bars in right column = 0.1 cm.
Figure 5.
Figure 5.
Inactivation of FAD5 Abrogates Cell Death in crl. (A) Representative images of 21-d-old plants grown on soil under CL are shown in the top row. Bars = 0.5 cm. Confocal images of chlorophyll fluorescence in mesophyll cells (mc) in 5-d-old seedlings are shown in the middle row. Bars = 15 µm. Cell death in cotyledons (10-d-old seedlings) was visualized by TB staining, and representative results are shown in the bottom row. Bars = 1 mm. WT, wild type. (B) Whole-genome sequencing of spcrl4 in comparison with crl identified a mutation in FAD5 at position 5359510 in chromosome (Chr) 3. Mbps, million base pairs. (C) Schematic illustration of FAD5 shows a transit peptide (TP, black), three transmembrane domains (TM, gray), and three His-box domains (dark gray). The mutation positions for fad5-1 and fad5-3 are indicated with triangles. G, Gly; R, Arg; stop, stop codon; W, Trp. (D) Complementation assay. Images are representative of 21-d-old plants grown on soil under CL and shown at the same scale. Bars in top row = 0.5 cm. Cell death was visualized by TB staining in the cotyledons of 10-d-old seedlings grown under CL, and a representative image from each genotype is shown. Bars in bottom row = 1 mm. WT, wild type. (E) Subcellular localization of FAD5-GFP and FAD5G142R in 5-d-old seedlings of stable spcrl4 transgenic lines grown on soil under CL. Bars = 5 μm. Chl, chlorophyll autofluorescence; WT, wild type.
Figure 6.
Figure 6.
Loss of FAD5 Attenuates Cell Death in Plants Deficient in Chloroplast Division. (A) Macro- and microscopic phenotypes of the wild type (WT), arc6, arc6 fad5-1, oeFTSZ2-2, and oeFTSZ2-2 fad5-1 are shown as described in Figures 3A to 3C. Bars = 0.5 cm in top row; 15 µm for mesophyll cells (mc) in second row; 0.7 mm for TB and EB in third and fourth row. For EB staining, quantification was done using five cotyledons per genotype. Experiments were repeated at least three times, and the data represent means ± sd (Supplemental File). (B) Relative expression levels of selected stress-related genes were determined in 5-d-old seedlings using RT-qPCR. ACT2 was used as an internal standard. Values represent means ± sd of three independent biological replicates. Lowercase letters indicate statistically significant differences between mean values at each genotype (P < 0.05, one-way ANOVA with Tukey’s post hoc HSD test; Supplemental File).
Figure 7.
Figure 7.
GCs Induce DDRGs in crl. (A) Heatmap showing the relative expression of DDRGs and cell cycle inhibitors upregulated in crl compared to wild-type (WT) seedlings. (B) Transcript abundance of selected cell cycle inhibitors (SMR5 and SMR7) and DDRGs were determined using RT-qPCR. Five-day-old seedlings grown under CL were used to extract total RNA. ACT2 was used as an internal standard. WT, wild type. (C) to (E) The impact of the loss of ATM, ATR, or SOG1 in the crl-induced lesions. (C) and (D) Phenotypes are shown, as described in Figures 3A, 3C, and 3D. Bars in (C) = 1 cm in first column; 15 µm for mesophyll cells (mc) in second column, 0.1 cm for TB and EB in third and fourth columns. For EB staining and quantification was done using five cotyledons per genotype. Experiments were repeated at least three times, and the data represent means ± sd (Supplemental File). (E) Relative expression levels of selected cell cycle inhibitors/DDRGs were examined in 5-d-old seedlings of the wild type (WT), crl, crl atm, crl atr, and crl sog1 using RT-qPCR. (B) and (E) ACT2 was used as an internal standard. Values represents means ± sd of three independent biological replicates. Lowercase letters indicate statistically significant differences between mean values at each genotype (P < 0.05, one-way ANOVA with Tukey’s post hoc HSD test; Supplemental File).
Figure 8.
Figure 8.
Impaired Plastid Division Triggers Cell Cycle Inhibition and Cell Death. (A) Under nonstress conditions, plastid division precedes cell division, enabling equal partitioning of plastids into the daughter cells. (B) In GC mutants, impaired plastid division seems to repress the cell cycle via cell cycle inhibitors such as SMR5 and SMR7 (Hudik et al., 2014). Whereas the role of SMR5 in crl mutant was previously demonstrated and shown to be partly responsible for the cell cycle inhibition, the impact of SMR7 induction remains unclear. Besides, GCs are largely defective in ROS and lipid homeostasis, leading to an increase in lipid peroxidation (LPO) and perhaps also RES. The abrogated and attenuated cell death caused by the loss of FAD5 in crl and other GC mutants, respectively, indicates the pivotal roles of LPO and RES in developing the multiple lesions. At present, it remains unknown whether any natural stress results in an arrest in plastid division, which leads to cell cycle arrest and controlled cell death.

Comment in

References

    1. Alméras, E, Stolz, S, Vollenweider, S, Reymond, P, Mène-Saffrané, L., Farmer, E.E(2003). Reactive electrophile species activate defense gene expression in Arabidopsis. Plant J. 34: 205–216. - PubMed
    1. Apel, K, Hirt, H .(2004). Reactive oxygen species: Metabolism, oxidative stress, and signal transduction. Annu. Rev. Plant Biol. 55: 373–399. - PubMed
    1. Asada, K.(2006). Production and scavenging of reactive oxygen species in chloroplasts and their functions. Plant Physiol. 141: 391–396. - PMC - PubMed
    1. Asano, T, Yoshioka, Y, Kurei, S, Sakamoto, W, Machida, Y; Sodmergen. (2004). A mutation of the CRUMPLED LEAF gene that encodes a protein localized in the outer envelope membrane of plastids affects the pattern of cell division, cell differentiation, and plastid division in Arabidopsis. Plant J. 38: 448–459. - PubMed
    1. Baruah, A., Simková, K., Apel, K., Laloi, C.(2009). Arabidopsis mutants reveal multiple singlet oxygen signaling pathways involved in stress response and development. Plant Mol. Biol. 70: 547–563. - PubMed

Publication types

MeSH terms

LinkOut - more resources