. 2020 Aug 14;11(1):4102.
doi: 10.1038/s41467-020-17886-y.

Distinct fibroblast subsets regulate lacteal integrity through YAP/TAZ-induced VEGF-C in intestinal villi

Affiliations

Distinct fibroblast subsets regulate lacteal integrity through YAP/TAZ-induced VEGF-C in intestinal villi

Seon Pyo Hong et al. Nat Commun. .

Abstract

Emerging evidence suggests that intestinal stromal cells (IntSCs) play essential roles in maintaining intestinal homeostasis. However, the extent of heterogeneity within the villi stromal compartment and how IntSCs regulate the structure and function of specialized intestinal lymphatic capillary called lacteal remain elusive. Here we show that selective hyperactivation or depletion of YAP/TAZ in PDGFRβ+ IntSCs leads to lacteal sprouting or regression with junctional disintegration and impaired dietary fat uptake. Indeed, mechanical or osmotic stress regulates IntSC secretion of VEGF-C mediated by YAP/TAZ. Single-cell RNA sequencing delineated novel subtypes of villi fibroblasts that upregulate Vegfc upon YAP/TAZ activation. These populations of fibroblasts were distributed in proximity to lacteal, suggesting that they constitute a peri-lacteal microenvironment. Our findings demonstrate the heterogeneity of IntSCs and reveal that distinct subsets of villi fibroblasts regulate lacteal integrity through YAP/TAZ-induced VEGF-C secretion, providing new insights into the dynamic regulatory mechanisms behind lymphangiogenesis and lymphatic remodeling.


Conflict of interest statement

The authors declare no competing interests.

Figures

Fig. 1
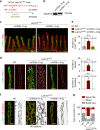
Fig. 1. YAP/TAZ hyperactivation in PDGFRβ+ IntSCs induces lacteal sprouting and branching.
a Diagram depicting the generation of Lats1/2iΔPβC mouse and PDGFRβ+ cell-specific depletion of Lats1/2 in 8-week-old mice and analyses at 2 weeks later. b, c Representative images of LYVE-1+ lacteals and CD31+ capillary plexus under the E-cadherin+ epithelial cells in intestinal villi of the indicated part of small intestine and comparisons of the lacteal surface area per villi, lacteal length, villi length, and villi width in the duodenum (DD), jejunum (JJ), and ileum (IL) in WT and Lats1/2iΔPβC mice. Dots indicate values of 101–217 villi/group in n = 5 mice/group pooled from three independent experiments. Horizontal bars indicate mean ± SD and *** P < 0.0001 versus WT by two-tailed Mann–Whitney U test. n.s., not significant. Scale bars, 100 μm. d, e Representative images and comparisons of the number of lacteal sprouts and branches per 100 μm of lacteal length in WT and Lats1/2iΔPβC mice. Each dot indicates a mean value of 10–20 villi/mouse and n = 5 mice/group pooled from three independent experiments. Horizontal bars indicate mean ± SD and P value versus WT by two-tailed Mann–Whitney U test. Scale bars, 50 μm. f, g Representative images and comparisons of the number of Prox1+ lymphatic endothelial cells (LECs) and Prox1+EdU+ proliferative LECs (white arrowheads) per 100 μm of lacteal length in WT and Lats1/2iΔPβC mice. Each dot indicates a mean value of 10–20 villi/mouse and n = 5 mice/group pooled from three independent experiments. Horizontal bars indicate mean ± SD and P value versus WT by two-tailed Mann–Whitney U test. Scale bars, 50 μm.
Fig. 2
Fig. 2. Button-to-zipper junctional transition and impaired lipid absorption in Lats1/2iΔPβC mice.
a, b Representative images and comparison of VE-cadherin+ lymphatic endothelial cell (LEC) junctions of LYVE-1+ lacteals in WT and Lats1/2iΔPβC mice. Black dotted box is magnified in the right panel and arrowheads indicate the lacteal junctional pattern that is dominant in each group with the same color described in b. Horizontal bars of each colored segment represent mean ± SD of 5–10 villi/mouse and n = 5 mice/group pooled from three independent experiments. *** P < 0.0001 versus WT by two-way ANOVA with Holm–Sidak’s multiple comparisons test. Scale bars, 20 μm. c Representative transmission electron micrographs (EM) of a lacteal in WT and Lats1/2iΔPβC mice. Black dotted box is magnified in the right panel. LL, lacteal lumen; CM, chylomicron; IS, interstitium of lamina propria. Similar findings were observed in n = 5 mice/group from two independent experiments. Scale bars, 1 μm. d Diagram depicting the schedule of intravital imaging of lipid clearance from lamina propria via lacteals after supplying the BODIPY-fatty acid (FA) into the WT or Lats1/2iΔPβC mice and their analyses until after 46 min. e, f Representative intravital images and comparisons of the drainage of BODIPY-FA from the lamina propria (white asterisks) through the LYVE-1+ lacteal in WT and Lats1/2iΔPβC mice. Each dot indicates a value of 4–8 villi/mouse and n = 7 (WT) or n = 8 (Lats1/2iΔPβC) mice pooled from four independent experiments. Horizontal bars indicate mean ± SD and P value versus WT by two-tailed Mann–Whitney U test. FI, fluorescence intensity; AU, arbitrary unit. Scale bars, 20 μm. g Diagram depicting the schedule of olive oil gavage at 12 h prior to the intestinal sampling in WT or Lats1/2iΔPβC mice. h, i Representative images and comparison of Oil red O staining in intestinal villi of WT and Lats1/2iΔPβC mice. Each dot indicates a mean value of 5–7 villi/mouse and n = 4 mice/group pooled from two independent experiments. Horizontal bars indicate mean ± SD and P value versus WT by two-tailed Mann–Whitney U test. Scale bars, 100 μm.
Fig. 3
Fig. 3. VEGFR3 blockade abrogates lacteal sprouting and branching in Lats1/2iΔPβC mice.
a Diagram for analyses of adult WT and Lats1/2iΔPβC mice two weeks after single intraperitoneal (i.p.) injection of AAV–mVEGFR3(4-7)-Ig (mVR3(4-7)-Ig, control) or AAV-mVEGFR3(1-4)-Ig (mVR3(1-4)-Ig, VEGFR3 blockade). b Representative immunoblot analysis showing mVEGFR3-Ig proteins in serum two weeks after single i.p. injection of AAV–mVEGFR3(4-7)-Ig or AAV-mVEGFR3(1-4)-Ig (1 × 1012 viral particles in 150–200 μl PBS). kDa, kilodalton. Similar findings were observed in n = 4 mice/group from two independent experiments. ce Representative images of CD31+ capillary plexus and LYVE-1+ lacteals in the villi of Lats1/2iΔPβC mice treated with mVR3(4-7)-Ig or mVR3(1-4)-Ig and comparisons of the number of Prox1+ lymphatic endothelial cells (LECs), lacteal sprouts, and lacteal branches of LYVE-1+ lacteals per 100 μm of lacteal length in the villi of WT and Lats1/2iΔPβC mice treated with mVR3(4-7)-Ig or mVR3(1-4)-Ig. White dotted-line outlines the lacteal. Each dot indicates a mean value of 10–20 villi/mouse and n = 5 mice/group pooled from two independent experiments. Horizontal bars indicate mean ± SD and P value versus WT or mVR3(4-7)-Ig by two-tailed Mann–Whitney U test. n.s., not significant. Scale bars, c 100 μm; d 50 μm. f, g Representative images and comparison of VE-cadherin+ LEC junctions of LYVE-1+ lacteals in the villi of WT and Lats1/2iΔPβC mice treated with mVR3(4-7)-Ig or mVR3(1-4)-Ig. Horizontal bars of each colored segment represent mean ± SD of 5–10 villi/mouse and n = 5 mice/group pooled from two independent experiments. ***P < 0.0001 versus WT or mVR3(4-7)-Ig treated Lats1/2iΔPβC mice by two-way ANOVA with Holm–Sidak’s multiple comparisons test. Scale bars, 25 μm.
Fig. 4
Fig. 4. Regression of lacteal and attenuated Vegfc in intestinal villi of Yap/TaziΔPβC mice.
a Diagram depicting the generation of Yap/TaziΔPβC mouse and PDGFRβ+ cell-specific depletion of Yap/Taz in small intestinal villi starting at 6 weeks and their analyses at 3 months after tamoxifen treatment. b, c Representative images of LYVE-1+ lacteals and CD31+ capillary plexus under the E-cadherin+ intestinal epithelial cells and comparisons of the lacteal length, lacteal width, villi length, and villi width in duodenum (DD), jejunum (JJ), and ileum (IL) of the indicated part of small intestine in WT and Yap/TaziΔPβC mice. Dots indicate values from 134~159 villi/group from three independent experiments using n = 5 mice/group. Horizontal bars indicate mean ± SD and *** P < 0.0001 versus WT by two-tailed Mann–Whitney U test. n.s., not significant. Scale bars, 100 μm. d, e Representative images and comparison of VE-cadherin+ lymphatic endothelial cell (LEC) junctions of LYVE-1+ lacteals in the villi of WT and Yap/TaziΔPβC mice. Arrowheads indicate the button-type (WT) or zipper-type dominant junctional pattern (Yap/TaziΔPβC). Horizontal bars of each colored segment represent mean ± SD of 5~10 villi/mouse and n = 5 mice/group pooled from three independent experiments. *** P < 0.0001 versus WT by two-way ANOVA with Holm–Sidak’s multiple comparisons test. Scale bars, 20 μm. f Plasma triglyceride concentration (mg/dl) at the indicated time points after gavage of 200 μl of olive oil following fasting for 12 h in WT and Yap/TaziΔPβC mice. Each dot indicates a value from n = 6 (WT) or n = 5 (Yap/TaziΔPβC) mice pooled from three independent experiments. Horizontal bars indicate mean ± SD and P value versus WT by two-way ANOVA with Bonferroni’s multiple comparisons test. g Comparison of Vegfc mRNA expression in the intestinal villi lysates of WT and Yap/TaziΔPβC mice. Fold changes in mRNA expressions relative to the levels of WT mice are presented. Each dot indicates a value obtained from one mouse and n = 4 mice/group pooled from three independent experiments. Horizontal bars indicate mean ± SD and P value versus WT by two-tailed Mann–Whitney U test.
Fig. 5
Fig. 5. Mechanical and osmotic stress regulate YAP/TAZ and Vegfc in IntSCs.
a Diagram depicting the location of mouse Vegfc promoter element upstream of the transcription start site (ATG) relative to the Vegfc gene with presence and arrangement of consensus TEAD-binding sequences (GGAAT, red lines). ChIP-qPCR primers of Vegfc gene promoter around the TEAD-binding sequences are depicted as R1, R2 or R3. b ChIP-qPCR in MEFs indicating the endogenous interaction between TEAD and the Vegfc promoter located −2.2 kb upstream of the transcription start site of Vegfc gene. Dots indicate values from four independent experiments, and horizontal bars indicate mean ± SD. P value versus negative control (NC) by two-tailed Mann–Whitney U test. n.s., not significant. c, d Representative images of YAP and TAZ and comparison of mRNA expressions of Vegfc, Ctgf, and Ankrd1 in isolated IntSCs after treatment with control (DMSO), latrunculin A (1 μM), or blebbistatin (50 μM) for 6 h. Similar results were observed in four independent experiments. Scale bars, 50 μm. Dots indicate data from four independent experiments and horizontal bars indicate mean ± SD. P value versus control by two-tailed Mann–Whitney U test. e, f Representative images of YAP and TAZ and comparison of mRNA expressions of Vegfc, Ctgf and Ankrd1 in isolated IntSCs plated on 1.5 kPa and 28 kPa matrix. Similar results were observed in four independent experiments. Scale bars, 20 μm. Dots indicate data from four independent experiments and horizontal bars indicate mean ± SD. P value versus 1.5 kPa matrix by two-tailed Mann–Whitney U test. g, h Representative images of YAP and TAZ and comparison of mRNA expressions of Vegfc, Ctgf and Ankrd1 in isolated IntSCs with or without 0.4 M sorbitol-induced osmotic stress for 3 h. Similar results were observed in four independent experiments. Scale bars, 50 μm. Dots indicate data from eight independent experiments and horizontal bars indicate mean ± SD. P value versus Control by two-tailed Mann–Whitney U test.
Fig. 6
Fig. 6. Mechanical stretching induces YAP/TAZ activation and VEGF-C secretion in IntSCs.
a Diagram for primary culture of IntSCs derived from WT or Yap/TaziΔPβC mice for 2 days and their analyses at 2 days after 100% EtOH or 5 µM of hydroxy-tamoxifen (4-OHT) treatment. b Phase-contrast image of freshly isolated primary mouse IntSCs from WT mice without passage (P1). Similar results were observed in four independent experiments. Scale bar, 200 μm. c Representative images of YAP and TAZ with phalloidin+ actin filaments in unstretched and stretched IntSCs. Similar findings were observed in four independent experiments. Scale bars, 50 μm. d Comparison of VEGF-C protein concentration in the culture medium of unstretched and stretched IntSCs derived from WT or Yap/TaziΔPβC mice. Dots indicate value from four independent experiments and horizontal bars indicate mean ± SD. P value versus unstretched by two-tailed Mann–Whitney U test. e Schematic images depicting upregulation and secretion of VEGF-C and other factors upon nuclear translocation and activation of YAP/TAZ and subsequent binding to TEAD after mechanical stimuli in PDGFRβ+ IntSCs.
Fig. 7
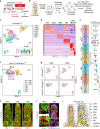
Fig. 7. Single-cell RNA sequencing reveals heterogeneity and distinct subsets of fibroblasts.
a Diagram depicting the generation of tdTomatorPβC mouse and PDGFRβ+ cell-specific expression of tdTomato from 8-week old and their analyses at 10-week old. b Illustration of droplet-based single-cell RNA sequencing (scRNA-seq) of PDGFRβ+tdTomato+ IntSCs sorted from the small intestine of tdTomatorPβC mice. c Visualization of unsupervised clustering of 7 distinct PDGFRβ+ IntSC clusters by Uniform manifold approximation and projection (UMAP) in the small intestine of tdTomatorPβC mice. vFB, intestinal villi fibroblast; FB, fibroblast; SMC, smooth muscle cell; MC, mural cell. d Heatmap displaying the scaled expression patterns of top ten differentially expressed genes for random sampled cells (maximum thousand cells) for each indicated clusters. e List of representative marker genes of each of the seven PDGFRβ+ IntSC clusters (left) and violin plots (right) showing the expression of top-ranking marker genes for each cluster. Log normalized read counts as y-axis (normalized expression). f UMAP visualization of unsupervised clustering of seven distinct PDGFRβ+ IntSC clusters in the small intestine of Lats1/2-tdTomatorPβC mice. g Gene expression levels of Vegfc and Vegfa in tdTomatorPβC and Lats1/2-tdTomatorPβC mice projected on UMAP plot. Note that specific subsets of PDGFRβ+ IntSCs (vFB1-3) in the small intestine of Lats1/2-tdTomatorPβC mice show higher expression of Vegfc compared with those of tdTomatorPβC mice. h, i Representative images of PDGFRβ+ IntSCs in WT mouse reveal expressions of each fibroblast-specific markers: PAI-1+ vFB1, Serpina3n+ vFB2, P2X1+ vFB3, Ackr4+ or Grem1+ FB4, and PDGFRα+ Sox6+ FB5. Each white box in the lower left corner is a magnified view. White asterisks indicate lacteals and white arrowheads indicate each fibroblast cluster-specific cell type stained with the indicated marker. Similar findings were observed in n = 4 mice from two independent experiments. Scale bars, 20 μm. j Schematic images depicting the anatomic distribution of indicated markers for vFB1-3, FB4, FB5, SMC, MC, capillary plexus, and lacteal in intestinal villi of adult WT mouse. vFB1-3 are uniformly distributed around the lacteal, whereas FB4 is mainly located in the submucosal area and FB5 is mostly placed under the intestinal epithelium. Black dashed boxes are magnified in the right panels.
Fig. 8
Fig. 8. vFB1-3 are distinct cell types secreting VEGF-C.
a Representative images of vFB3 (P2X1+Serpina3n+PDGFRβ+) and vFB1-2 (P2X1-Serpina3n+PDGFRβ+) in WT mouse. Similar findings were observed in n = 4 mice from two independent experiments. White and yellow dotted boxes are magnified in the upper right and lower right panels, respectively. Red and yellow arrowheads indicate vFB3 and vFB1-2, respectively. Scale bar, 20 μm. b Representative images of vFB1 (Serpina3n+Fosb+Shisa3+PDGFRβ+) and vFB2 (Serpina3n+Fosb-Shisa3+PDGFRβ+) in WT mouse. Similar findings were observed in n = 4 mice from two independent experiments. White and yellow dotted boxes are magnified in the upper right and lower right panels, respectively, for each image. White and yellow arrowheads indicate vFB1 and vFB2, respectively. Scale bars, 20 μm. c Representative images of Vegfc single-molecule fluorescence in situ hybridization (smFISH) in intestinal villi of tdTomatorPβC and Lats1/2- tdTomatorPβC mice. Similar findings were observed in n = 4 mice/group from two independent experiments. White dotted boxes are magnified in the right panel. Scale bars, 20 μm. d Representative images of Vegfc smFISH in vFB1-3 of WT and Lats1/2- tdTomatorPβC mice. Similar findings were observed in n = 4 mice/group from two independent experiments. White and yellow dotted boxes are magnified in the upper right and lower right panels, respectively, for each image. Scale bars, 20 μm.

References

    1. Bernier-Latmani J, Petrova TV. Intestinal lymphatic vasculature: structure, mechanisms and functions. Nature reviews. Gastroenterol. Hepatol. 2017;14:510–526. - PubMed
    1. Aspelund A, Robciuc MR, Karaman S, Makinen T, Alitalo K. Lymphatic system in cardiovascular medicine. Circ. Res. 2016;118:515–530. - PubMed
    1. Petrova TV, Koh GY. Organ-specific lymphatic vasculature: from development to pathophysiology. J. Exp. Med. 2018;215:35–49. - PMC - PubMed
    1. Bernier-Latmani J, et al. DLL4 promotes continuous adult intestinal lacteal regeneration and dietary fat transport. J. Clin. Investig. 2015;125:4572–4586. - PMC - PubMed
    1. Nurmi H, et al. VEGF-C is required for intestinal lymphatic vessel maintenance and lipid absorption. EMBO Mol. Med. 2015;7:1418–1425. - PMC - PubMed

Publication types

MeSH terms