. 2020 Aug 14;11(1):4084.
doi: 10.1038/s41467-020-17915-w.

Scavenging of reactive dicarbonyls with 2-hydroxybenzylamine reduces atherosclerosis in hypercholesterolemic Ldlr-/- mice

Affiliations

Scavenging of reactive dicarbonyls with 2-hydroxybenzylamine reduces atherosclerosis in hypercholesterolemic Ldlr-/- mice

Huan Tao et al. Nat Commun. .

Abstract

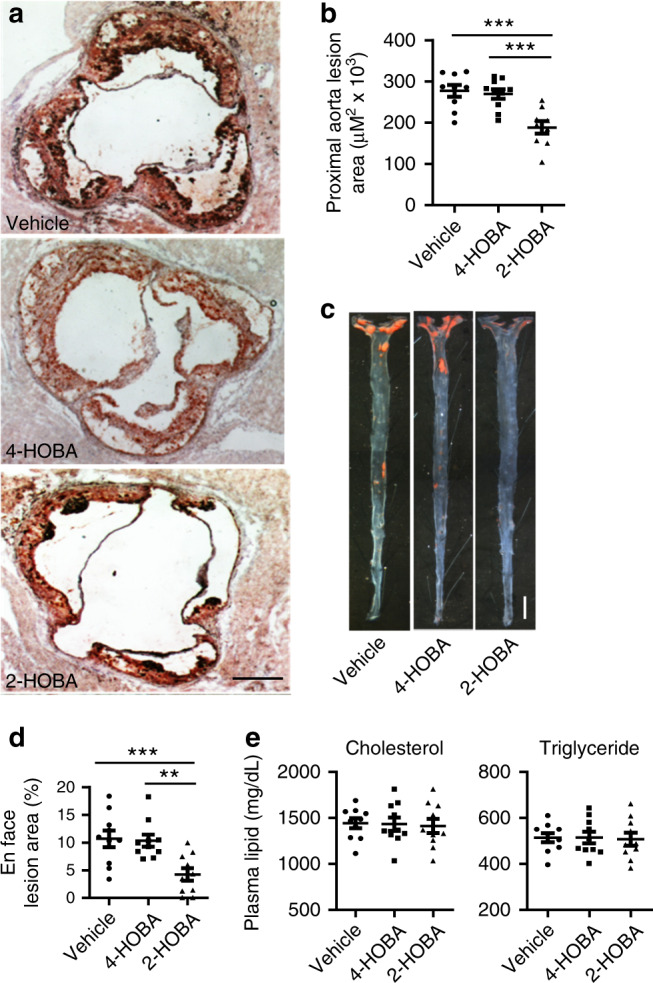
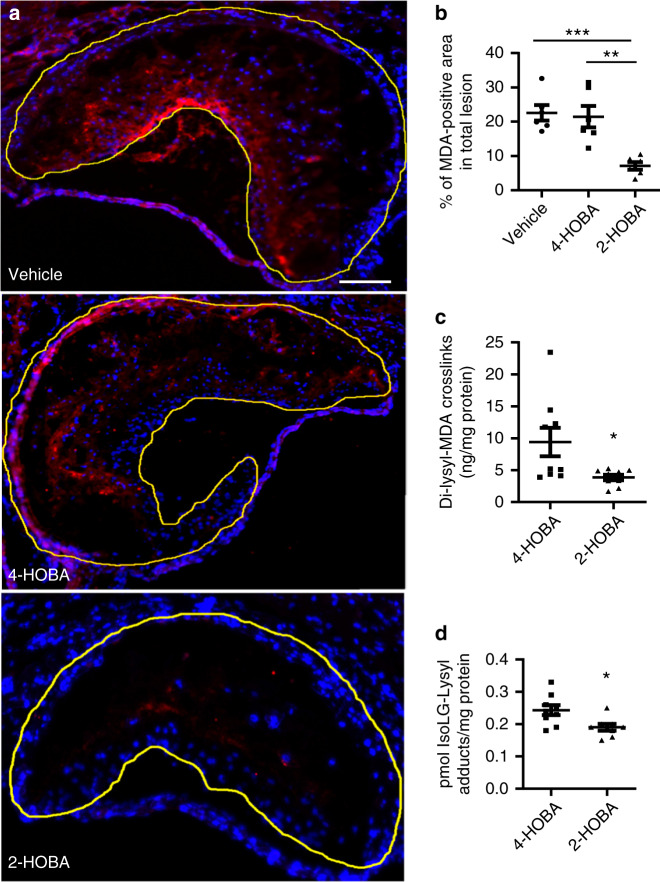
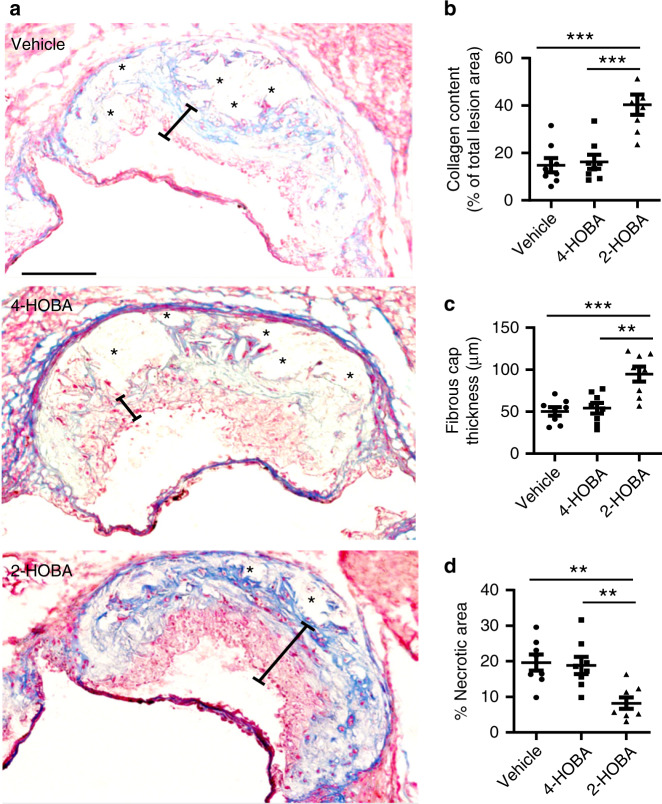
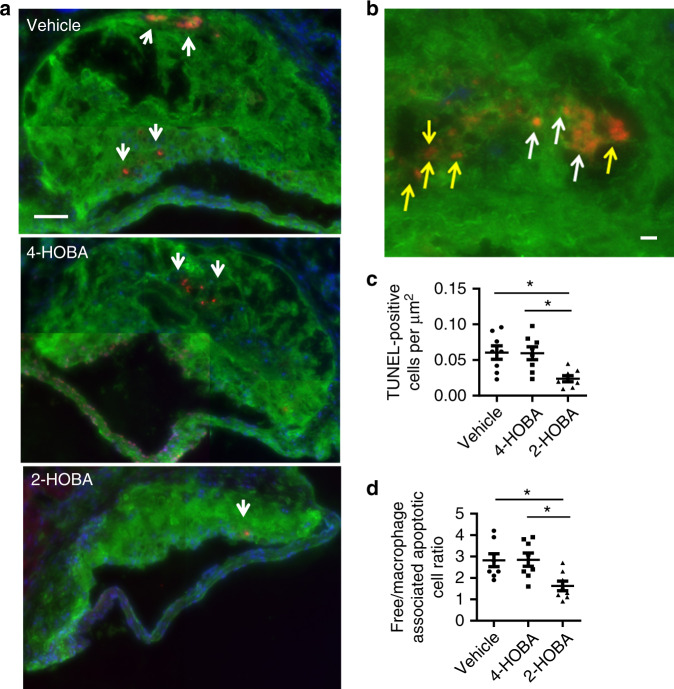
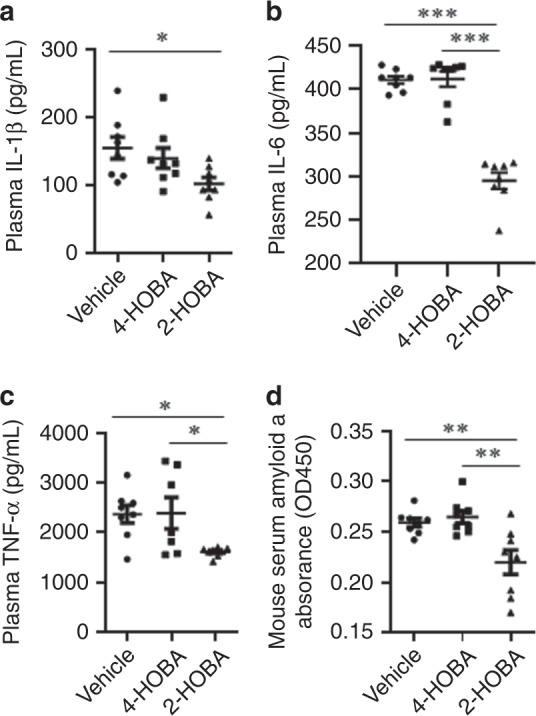
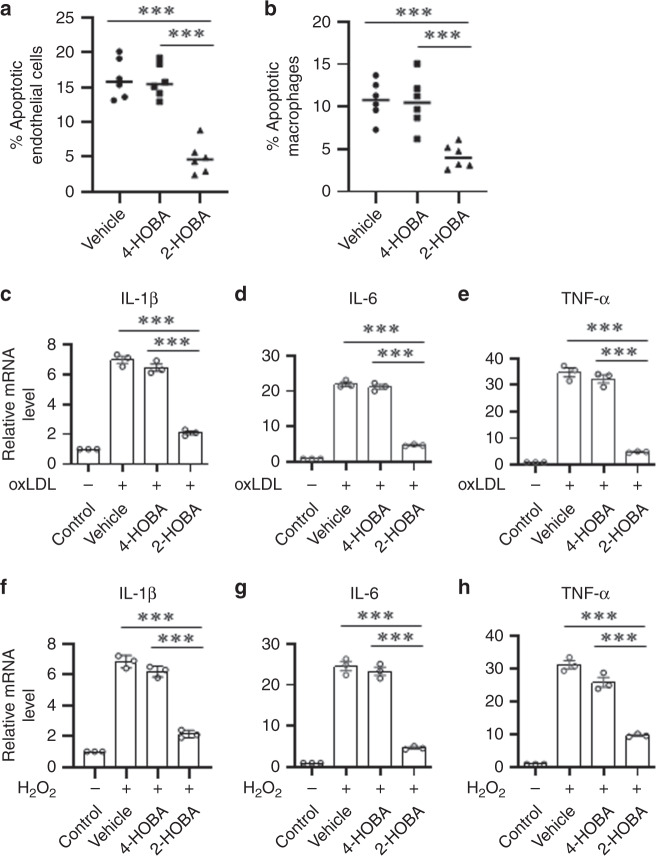
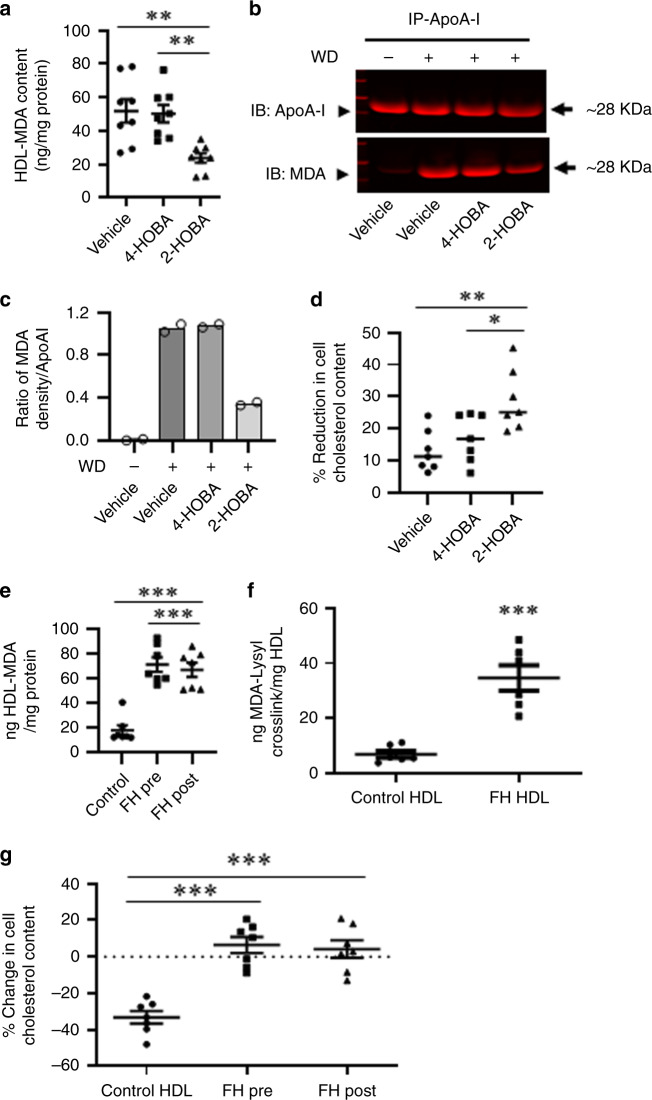
Lipid peroxidation generates reactive dicarbonyls including isolevuglandins (IsoLGs) and malondialdehyde (MDA) that covalently modify proteins. Humans with familial hypercholesterolemia (FH) have increased lipoprotein dicarbonyl adducts and dysfunctional HDL. We investigate the impact of the dicarbonyl scavenger, 2-hydroxybenzylamine (2-HOBA) on HDL function and atherosclerosis in Ldlr-/- mice, a model of FH. Compared to hypercholesterolemic Ldlr-/- mice treated with vehicle or 4-HOBA, a nonreactive analogue, 2-HOBA decreases atherosclerosis by 60% in en face aortas, without changing plasma cholesterol. Ldlr-/- mice treated with 2-HOBA have reduced MDA-LDL and MDA-HDL levels, and their HDL display increased capacity to reduce macrophage cholesterol. Importantly, 2-HOBA reduces the MDA- and IsoLG-lysyl content in atherosclerotic aortas versus 4-HOBA. Furthermore, 2-HOBA reduces inflammation and plaque apoptotic cells and promotes efferocytosis and features of stable plaques. Dicarbonyl scavenging with 2-HOBA has multiple atheroprotective effects in a murine FH model, supporting its potential as a therapeutic approach for atherosclerotic cardiovascular disease.


Conflict of interest statement

M.F.L., S.S.D., V.A., O.B., J.A.O., and L.J.R.II are inventors on a patent application for the use of 2-HOBA and related dicarbonyl scavengers for the treatment of cardiovascular disease. M.F.L. has received reseach funding from Amgen, Regeneron, Ionis, Merck, REGENXBIO, Sanofi and Novartis and has served as a consultant for Esperion, Alexion Pharmaceuticals and REGENXBIO. All the other authors (H.T., J.H., P.G.Y., J.L.B., F.Y., V.Y., V.Z., L.D., and I.Z.I.) declare no competing interests.

Figures

Fig. 1
Fig. 1. 2-HOBA attenuates atherosclerosis in hypercholesterolemic female Ldlr−/− mice.
8-week-old Ldlr−/− female mice were pretreated with 1 g/L 2-HOBA or 1 g/L 4-HOBA (nonreactive analog) or vehicle (water) for 2 weeks and then the treatment was continued for 16 weeks during which the mice were fed a Western diet. Representative images (a) and quantitation (b) of Oil-Red-O stained proximal aorta root sections. Scale bar = 500 µm. n = 9 (vehicle), 10 (4-HOBA), or 9 (2-HOBA) biologically independent mice. Data are presented as mean ± SEM, One-way ANOVA with Bonferroni’s post hoc test, p values of 2-HOBA vs 4-HOBA and 2-HOBA vs vehicle are ***0.0009 and ***0.0004. Representative images (c) and quantitation (d) of Oil-Red-O stained open-pinned aortas. n = 10 biologically independent mice per group. Data are presented as mean ± SEM. One-way ANOVA with Bonferroni’s post hoc test, p values of 2-HOBA vs 4-HOBA and 2-HOBA vs vehicle are **0.0055 and **0.0033. e The plasma total cholesterol and triglyceride levels. n = 10 biologically independent mice per group. Data are presented as mean ± SEM. One-way ANOVA with Bonferroni’s post hoc test, p values of 2-HOBA vs 4-HOBA and 2-HOBA vs vehicle are >0.9999 for both cholesterol and triglyceride levels. Source data are provided as a source data file.
Fig. 2
Fig. 2. 2-HOBA decreases the MDA adduct content of proximal aortic atherosclerotic lesions in Ldlr−/− mice.
a, b MDA was detected by immunofluorescence using anti-MDA primary antibody and fluorescent-labeled secondary antibody (red). Nuclei were counterstained with Hoechst (blue). Representative images (a) and quantitation (b) of MDA staining in proximal aortic root sections. Scale Bar = 50 µm. n = 6 biologically independent mice per group. Data are expressed as mean ± SEM. One-way ANOVA with Bonferroni’s post hoc test, p values of 2-HOBA vs 4-HOBA and 2-HOBA vs vehicle are **0.0017 and ***0.0008, respectively. c Aortic tissues were isolated from the Ldlr−/− mice and Dilysyl-MDA crosslinks were measured by LC/MS/MS. n = 9 biologically independent mice per group. Data are presented as mean ± SEM. Two-sided unpaired t test, p value of 2-HOBA vs 4-HOBA is *0.0262. d Aortic tissues were isolated from the Ldlr−/− mice and IsoLG-Lysyl was measured by LC/MS/MS. n = 9 (4-HOBA) or 8 (2-HOBA) biologically independent mice. Data are presented as mean ± SEM. Two-sided unpaired t test, p value of 2-HOBA vs 4-HOBA is *0.0151. Source data are provided as a source data file.
Fig. 3
Fig. 3. 2-HOBA promotes features of stable atherosclerotic plaques in Ldlr−/− mice.
ad Masson’s Trichrome stain was done to analyze characteristics associated with atherosclerotic lesion stability in proximal aorta sections of Ldlr−/− mice. Representative images (a) of Masson’s Trichrome stain in aorta root sections and quantitation of aortic root collagen content (b), fibrous cap thickness (c), and necrotic area (d). Blue shows collagen, red, cytoplasm, black, nuclei. Scale bar = 50 μm. Quantitations were done using ImageJ software. ad n = 8 biologically independent mice per group. Data are presented as mean ± SEM. One-way ANOVA with Bonferroni’s post hoc test. b p values of 2-HOBA vs 4-HOBA and 2-HOBA vs vehicle are ***0.0002 and ***0.0001. c p values of 2-HOBA vs 4-HOBA and 2-HOBA vs vehicle are **0.0015 and ***0.0006. d p values of 2-HOBA vs 4-HOBA and 2-HOBA vs vehicle are **0.0058 and **0.0031. Source data are provided as a source data file.
Fig. 4
Fig. 4. 2-HOBA prevents cell death and increases efferocytosis in atherosclerotic lesions of Ldlr−/− mice.
a, c Representative images a and quantitation c of TUNEL-positive nuclei (red) of proximal aorta sections. Macrophages were detected by anti-macrophage primary antibody (green), and nuclei were counterstained with Hoechst (blue). Scale bar = 50 μm. n = 8 biologically independent mice per group. Data are presented as mean ± SEM. One-way ANOVA with Bonferroni’s post hoc test, p values of 2-HOBA vs 4-HOBA and 2-HOBA vs vehicle are *0.0134 and *0.0108. Higher magnification images of the TUNEL staining (b) were used to quantitate (d) efferocytosis of dead cells in aortic root sections. A representative image taken at a higher magnification shows macrophage-associated TUNEL stain (white arrows) and free dead cells (yellow arrows) that were not associated with macrophages (b). Scale bar = 50 μm. Efferocytosis was quantitated as the free vs macrophage-associated TUNEL-positive cells in the proximal aortic sections (d). n = 8 biologically independent mice per group. Data are presented as mean ± SEM. One-way ANOVA with Bonferroni’s post hoc test, p values of 2-HOBA vs 4-HOBA and 2-HOBA vs vehicle are *0.0162 and *0.0187. Source data are provided as a source data file.
Fig. 5
Fig. 5. 2-HOBA reduces plasma inflammatory cytokines in hypercholesterolemic Ldlr−/− mice.
ad Inflammatory cytokines were measured in plasma from mice consuming a western diet for 16 weeks and treated with 2-HOBA, 4-HOBA, or vehicle. a IL-1β levels were measured by ELISA. n = 8 biologically independent mice per group. Data are presented as mean ± SEM. One-way ANOVA with Bonferroni’s post hoc test, p value of 2-HOBA vs vehicle is *0.0401 and 2-HOBA vs 4-HOBA is not significant. b IL-6 levels were measured by ELISA. n = 8 biologically independent mice per group. Data are presented as mean ± SEM. One-way ANOVA with Bonferroni’s post hoc test, p values of 2-HOBA vs 4-HOBA and 2-HOBA vs vehicle are ***<0.0001. c TNF-α levels were measured by ELISA. n = 8 (vehicle), 7 (4-HOBA), or 8 (2-HOBA) biologically independent mice. Data are presented as mean ± SEM. One-way ANOVA with Bonferroni’s post hoc test, p values of 2-HOBA vs 4-HOBA and 2-HOBA vs vehicle are *0.0385 and *0.0359. d The levels of SAA were measured by ELISA. n = 8 biologically independent mice per group. Data are presented as mean ± SEM. One-way ANOVA with Bonferroni’s post hoc test, p values of 2-HOBA vs 4-HOBA and 2-HOBA vs vehicle are **0.0025 and **0.0082. Source data are provided as a source data file.
Fig. 6
Fig. 6. In vitro treatment with 2-HOBA suppresses oxidative stress-induced cell apoptosis and inflammation.
a Human aortic endothelial cells were incubated for 24 h with 250 μM H2O2 alone or with either 4-HOBA or 2-HOBA (500 μM). Apoptotic cells were then detected by Annexin V staining and flow cytometry. n = 6 biologically independent experiments per group. Data are presented as mean ± SEM. One-way ANOVA with Bonferroni’s post hoc test, p values of 2-HOBA vs 4-HOBA and 2-HOBA vs vehicle are ***<0.0001. b Mouse primary macrophages were incubated for 24 h with 250 μM H2O2 alone or with either 4-HOBA or 2-HOBA (500 μM). n = 6 biologically independent experiments per group. Data are presented as mean ± SEM. One-way ANOVA with Bonferroni’s post hoc test, p values of 2-HOBA vs 4-HOBA and 2-HOBA vs vehicle are ***0.0006 and ***0.0009. ce The mRNA levels of IL-1β, IL-6, and TNF-α were analyzed by real-time PCR in the peritoneal macrophages incubated for 24 h with either oxidized LDL alone or with either 4-HOBA or 2-HOBA (500 μM). n = 3 biologically independent experiments per group. Data are presented as mean ± SEM. One-way ANOVA with Bonferroni’s post hoc test, p values of 2-HOBA vs vehicle and 2-HOBA vs 4-HOBA are ***<0.0001. fh The mRNA levels of IL-1β, IL-6, and TNF-α were analyzed by real-time PCR in the peritoneal macrophages incubated for 24 h with either 250 μM H2O2 alone or with either 4-HOBA or 2-HOBA (500 μM). n = 3 biologically independent experiments per group. Data are presented as mean ± SEM. One-way ANOVA with Bonferroni’s post hoc test, p values of 2-HOBA vs vehicle and 2-HOBA vs 4-HOBA are ***<0.0001. Source data are provided as a source data file.
Fig. 7
Fig. 7. Effects of 2-HOBA on MDA-HDL adducts and HDL function.
a The levels of MDA adducts were measured by ELISA in HDL isolated from Ldlr−/− mice treated as described in Fig. 1. n = 8 biologically independent mice per group. Data are presented as mean ± SEM. One-way ANOVA with Bonferroni’s post hoc test, p values of 2-HOBA vs vehicle and 2-HOBA vs 4-HOBA are **0.0031 and **0.0053. Western blots (b) and quantitation (c) of apoAI and MDA-apoAI in HDL isolated from plasma by immunoprecipitation using primary anti-apoAI antibody. Ldlr−/− mice were treated as described in Fig. 1 and apoAI and MDA-apoAI from Ldlr−/− mice consuming a chow diet are included for comparison. Plasma was pooled from three mice per group from 2 experiments. c Quantitation of the mean density ratio (arbitrary units) of MDA-apoAI to ApoAI was done using ImageJ software n = 2 biologically independent experiments per group. Data are presented as the mean. d The HDL was isolated from the plasma of Ldlr−/− mice consuming a western diet for 16 weeks and treated with 2-HOBA or 4-HOBA or vehicle. Cholesterol-enriched macrophages were incubated for 24 h with HDL (25 μg protein/ml), and the % reduction in cellular cholesterol content measured. n = 7 biologically independent mice per group. Data are presented as mean ± SEM. One-way ANOVA with Bonferroni’s post hoc test, p values of 2-HOBA vs vehicle and 2-HOBA vs 4-HOBA are **0.0046 and *0.0375. e The MDA adducts were measured by ELISA in HDL isolated from control or FH subjects pre- and post-LDL apheresis. n = 7 biologically independent humans per group. Data are presented as mean ± SEM. One-way ANOVA with Bonferroni’s post hoc test, p values of control vs FH pre LDL apheresis and control vs FH post-LDL apheresis are ***<0.0001. f The MDA-Lysyl crosslink content in HDL from control or FH subjects. n = 6 biologically independent humans per group. Data are presented as mean ± SEM. Two-sided unpaired t test, p value of control vs FH-HDL is ***0.0002. g The capacity of HDL from control or FH subjects pre- and post-LDL apheresis to reduce the cholesterol content of apoE−/− macrophages. n = 7 biologically independent humans per group. Data are presented as mean ± SEM. One-way ANOVA with Bonferroni’s post hoc test, p values of control vs pre LDL apheresis and control vs post-LDL apheresis are ***<0.0001. Source data are provided as a source data file.

References

    1. Linton, M. F. et al. The Role of Lipids and Lipoproteins in Atherosclerosis. In: Endotext. MDText.com, Inc. (eds. De Groot, L. J. et al.). (South Dartmouth (MA), 2019). https://www.ncbi.nlm.nih.gov/pubmed/26844337.
    1. Sampson UK, Fazio S, Linton MF. Residual cardiovascular risk despite optimal LDL cholesterol reduction with statins: the evidence, etiology, and therapeutic challenges. Curr. Atheroscler. Rep. 2012;14:1–10. - PMC - PubMed
    1. Anderson TJ. Oxidative stress, endothelial function and coronary atherosclerosis. Cardiologia. 1997;42:701–714. - PubMed
    1. Aviram M. Atherosclerosis: cell biology and lipoproteins–inflammation and oxidative stress in atherogenesis: protective role for paraoxonases. Curr. Opin. Lipidol. 2011;22:243–244. - PubMed
    1. Peluso I, Morabito G, Urban L, Ioannone F, Serafini M. Oxidative stress in atherosclerosis development: the central role of LDL and oxidative burst. Endocr. Metab. Immune Disord. Drug Targets. 2012;12:351–360. - PubMed

Publication types

MeSH terms