. 2020 Aug 14;3(1):439.
doi: 10.1038/s42003-020-01167-x.

Maximizing transcription of nucleic acids with efficient T7 promoters

Affiliations

Maximizing transcription of nucleic acids with efficient T7 promoters

Thomas Conrad et al. Commun Biol. .

Abstract

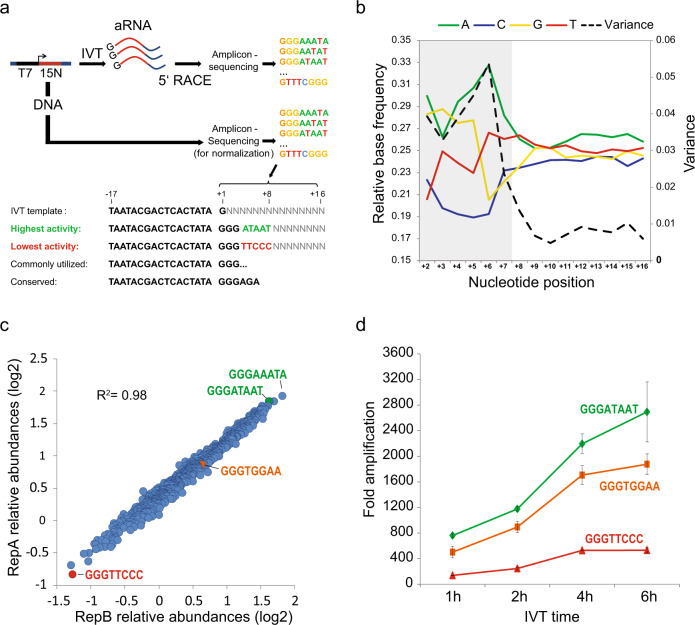
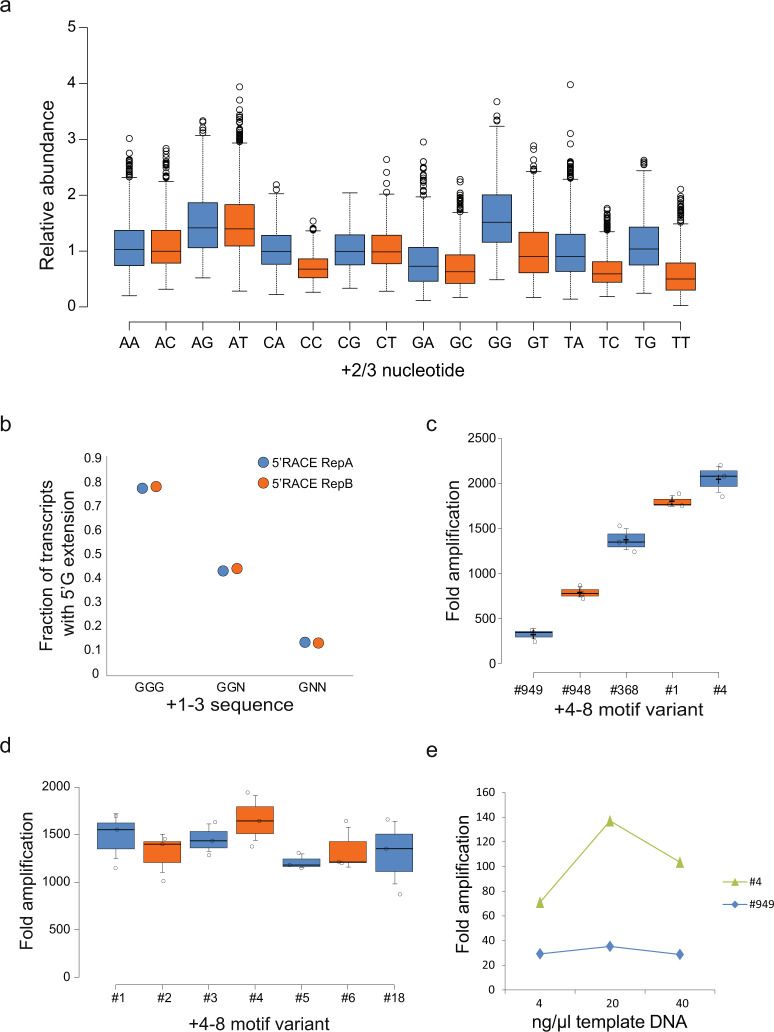
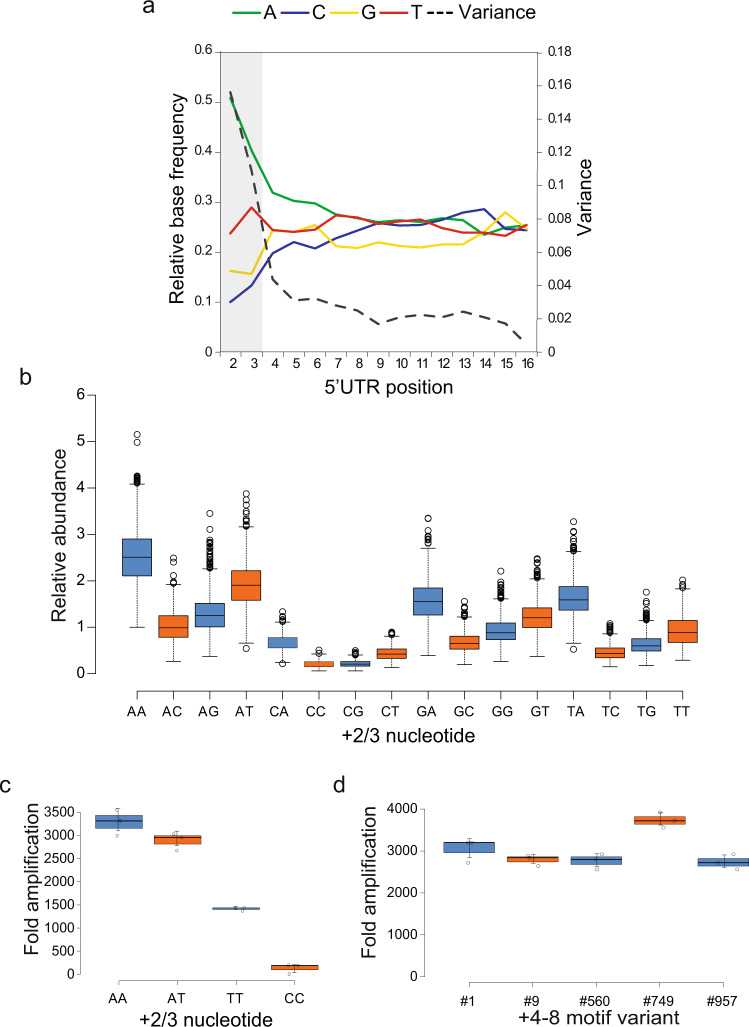
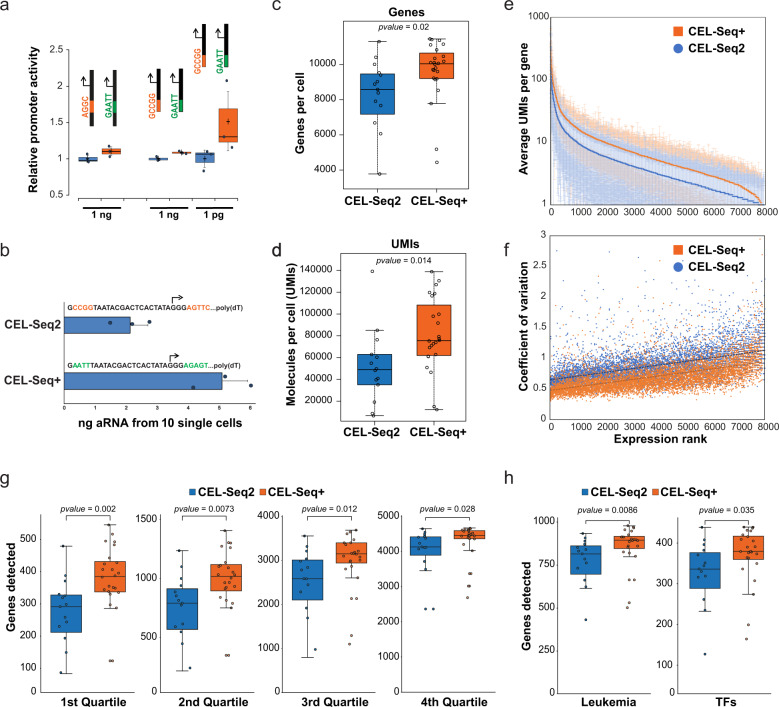
In vitro transcription using T7 bacteriophage polymerase is widely used in molecular biology. Here, we use 5'RACE-Seq to screen a randomized initially transcribed region of the T7 promoter for cross-talk with transcriptional activity. We reveal that sequences from position +4 to +8 downstream of the transcription start site affect T7 promoter activity over a 5-fold range, and identify promoter variants with significantly enhanced transcriptional output that increase the yield of in vitro transcription reactions across a wide range of template concentrations. We furthermore introduce CEL-Seq+ , which uses an optimized T7 promoter to amplify cDNA for single-cell RNA-Sequencing. CEL-Seq+ facilitates scRNA-Seq library preparation, and substantially increases library complexity and the number of expressed genes detected per cell, highlighting a particular value of optimized T7 promoters in bioanalytical applications.


Conflict of interest statement

A patent dealing with optimized T7 and other promoter sequences has been filed by Thomas Conrad and Sascha Sauer (EP19199289). The remaining authors (Izabela Plumbom, Maria Alcobendas, and Ramon Vidal) declare no competing interests.

Figures

Fig. 1
Fig. 1. 5′ RACE-Seq reveals hyperactive T7 promoter variants.
a 5RACE-Seq scheme. A 500 bp dsDNA library harboring a T7 promoter template with randomized nucleotide composition from +2 to +16 (highlighted in red) was transcribed in vitro, using T7 RNA polymerase. The resulting 210 nucleotides long RNAs were reverse transcribed, and the 5 end of the respective cDNA was converted into a library for deep sequencing. In parallel, an aliquot of the promoter DNA library was directly sequenced to account for potential sequence bias in the template. b Normalized average nucleotide compositions of T7 promoter sequence variants from positions +2 to +16 in amplified RNAs, determined by 5′ RACE-Seq. The region of the extended initiation bubble, which extends from positions −4 to +7, is highlighted in light gray. c Differential promoter activity of +4 to +8 sequence motifs determined by 5RACE-seq. Shown are the log2 relative abundances of individual sequence motifs. All promoters contain a G at positions +1 to +3. High correlation was observed between two independent experiments. d In vitro transcription reactions comparing +4 to +8 sequence motifs with high, low, and intermediate promoter activity. A 410-nucleotides long RNA was in vitro transcribed for the indicated time points using the displayed promoter variant. Shown is the resulting fold amplification of template DNA. Error bars represent the standard deviation of triplicate experiments.
Fig. 2
Fig. 2. Analysis of T7 promoter sequences.
a Relative 5′RACE-Seq abundances of T7 promoter +2 to +8 sequence variants, grouped by +2/+3 dinucleotide. Promoters with three guanines at positions +1 to +3 (GGG) showed the highest activity on average (+1G is present in all tested promoter variants). Each whisker plot represents 948–985 +1 to +8 motifs, dependent on homopolymer filtering. Whiskers reach to 1.5× IQR away from the 1st/3rd quartile. b Fraction of transcripts with the indicated +1 to +3 sequence, that have an additional G added to the 5′ terminus as a result of polymerase sliding during initiation. Shown are the values from two replicate 5RACE-Seq experiments. c Comparison of the IVT activity of +4 to +8 T7 promoter variants with different 5′ RACE-Seq ranks. All T7 promoter variants comprised a GGG sequence at positions +1 to +3 and were used to in vitro transcribe a 410 nucleotides long RNA for 2 h. Shown is the fold amplification relative to the template DNA. Indicated below is the +4 to +8 RACE-Seq rank. c The highest ranked +4 to +8 sequence motifs were used for in vitro transcription with T7 polymerase. Shown is the resulting fold amplification of the template DNA after 1 h IVT. d The highest ranked +4 to +8 sequence motifs were used for in vitro transcription with T7 polymerase. Shown is the resulting fold amplification of the template DNA after 1 h IVT. e Comparison of the IVT activity of two T7 promoter variants using different IVT DNA template concentrations. IVT was performed for 2 h. All error bars represent standard deviation for triplicate experiments.
Fig. 3
Fig. 3. Analysis of SP6 promoter sequences.
a 5RACE-seq using SP6 polymerase. Normalized average nucleotide composition from position +2 to +16 in RNA transcribed by SP6 RNA polymerase from a randomized SP6 promoter library. Substantial sequence preference was observed until the +3 nucleotide position. b Box plot showing relative abundances of +2 to +16 SP6 promoter variants detected in 5RACE-seq, separated by +2/3 dinucleotide sequence. All variants have a G at +1. Promoters with +1 to +3 GAA showed highest activity. Each whisker plot represents 948–985 +1 to +8 motifs, dependent on homopolymer filtering. Whiskers reach to 1.5× IQR away from the 1st/3rd quartile. c IVT using high ranking +2 to +8 SP6 promoter variants with the indicated +2/3 dinucleotides. The +2/3 dinucleotide sequence appeared as main determinant of SP6 transcriptional activity. d IVT using SP6 promoter templates harboring +1 to +3 GAA followed by +4 to +8 sequence motifs of varying 5RACE-seq rank. IVT was performed for 2 h. Shown is the resulting fold amplification of the template DNA. Sequence elements after +4 showed no effects on SP6 promoter activity. All error bars represent standard deviation for triplicate experiments.
Fig. 4
Fig. 4. An optimized T7 promoter boosts single-cell RNA-Sequencing.
a Addition of an AT-rich upstream promoter-flanking region enhances the activity of the T7 promoter at low template concentrations. A 410 nucleotide long RNA was in vitro transcribed for 2 h (1 nanogram template), or 15 h (1 picogram template) in the absence or presence of an AT-rich upstream element as indicated. Shown is the relative RNA yield. The start of the promoter sequence was either located at position 73 (left bars), or at position 6 of the DNA template (middle and right bars). Error bars represent the standard deviation of triplicate experiments. b CEL-Seq2 was performed from single K562 cells using the indicated DNA sequences. After reverse transcription and second strand synthesis, cDNA from 10 cells was pooled and in vitro transcribed for 15 h. Purified aRNA was fragmented and quantified on a Tapestation (Agilent). Error bars represent the standard deviation from triplicate experiments. c Linear amplification of cDNA in single cells with an optimized T7 promoter (CEL-Seq+) significantly increased the number of detected genes in single-cell RNA-Sequencing (9749 genes per cell on average with new T7 promoter (n = 24 cells), 8281 genes per cell on average with conventional T7 promoter (n = 14 cells). d Linear amplification with an optimized T7 promoter (CEL-Seq+) significantly increased the number of detected molecules in single-cell RNA-Sequencing (85,066 unique molecular identifiers (UMIs)/transcripts per cell on average with new T7 promoter, 53541 UMIs per cell on average with conventional T7 promoter). Statistical analysis was performed using the Mann–Whitney Wilcoxon test. e Average UMI count per gene in CEL-Seq2 and CEL-Seq+. Shown are all genes with more than 1 average UMI per cell in both assays (n = 7904). Genes are independently sorted by expression rank. Fourteen cells from CEL-Seq+ were randomly chosen for comparison with 14 cells from CEL-Seq2. Error bars show the standard deviation between cells. f Coefficient of variation for UMI counts from CEL-Seq2 and CEL-Seq+ for the genes shown in (e). g Genes from deep sequenced bulk K562 RNA-Seq were sorted into quartiles by expression level. Shown are the numbers of genes from the indicated bulk quartiles that were detected in individual cells by CEL-Seq2 or CEL-Seq+. h Shown are the numbers of genes detected in individual cells that are differentially expressed throughout CML disease progression, or with GO association “DNA binding transcription factor”. Whiskers reach to 1.5× IQR away from the 1st/3rd quartile.

References

    1. Sauer S, et al. Miniaturization in functional genomics and proteomics. Nat. Rev. Genet. 2005;6:465–476. doi: 10.1038/nrg1618. - DOI - PubMed
    1. Li J, Eberwine J. The successes and future prospects of the linear antisense RNA amplification methodology. Nat. Protoc. 2018;13:811–818. doi: 10.1038/nprot.2018.011. - DOI - PMC - PubMed
    1. Hashimshony T, et al. CEL-Seq2: sensitive highly-multiplexed single-cell RNA-Seq. Genome Biol. 2016;17:77. doi: 10.1186/s13059-016-0938-8. - DOI - PMC - PubMed
    1. Klein AM, et al. Droplet barcoding for single-cell transcriptomics applied to embryonic stem cells. Cell. 2015;161:1187–1201. doi: 10.1016/j.cell.2015.04.044. - DOI - PMC - PubMed
    1. Chen C, et al. Single-cell whole-genome analyses by linear amplification via transposon insertion (LIANTI) Science. 2017;356:189–194. doi: 10.1126/science.aak9787. - DOI - PMC - PubMed

Publication types