. 2020 Aug 14;3(1):438.
doi: 10.1038/s42003-020-01174-y.

Chemically induced mutations in a MutaMouse reporter gene inform mechanisms underlying human cancer mutational signatures

Affiliations

Chemically induced mutations in a MutaMouse reporter gene inform mechanisms underlying human cancer mutational signatures

Marc A Beal et al. Commun Biol. .

Abstract

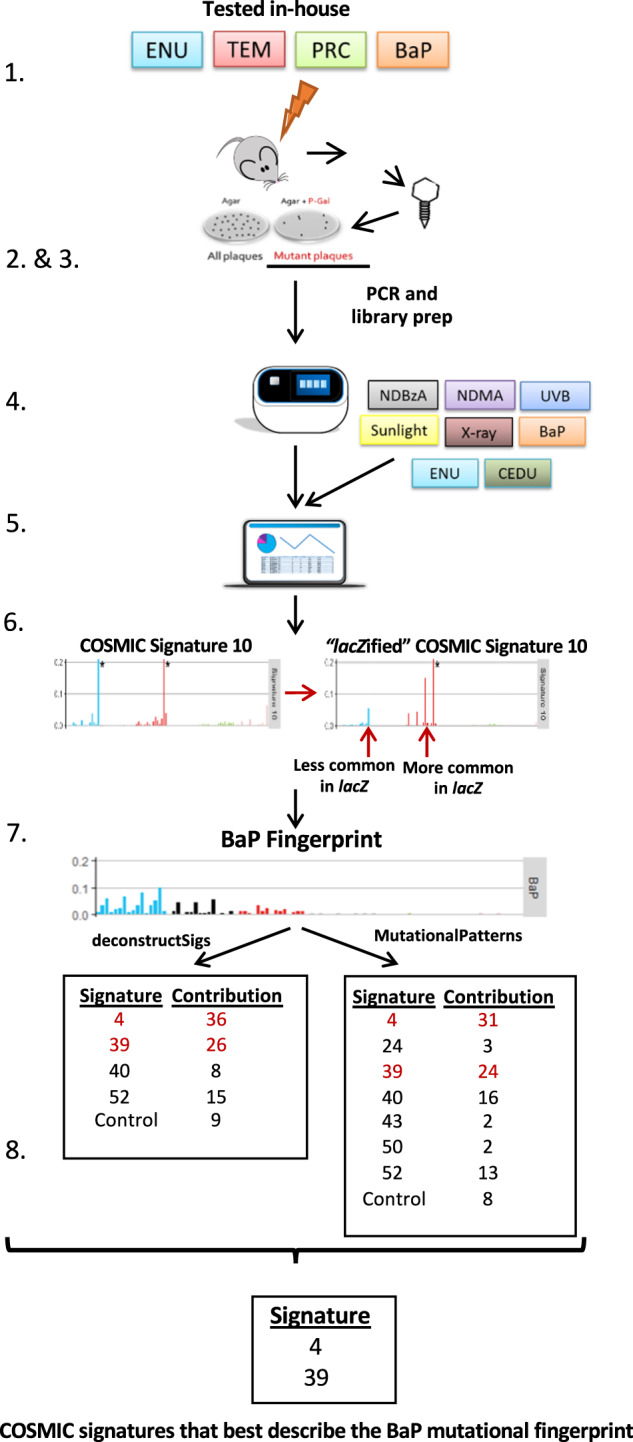
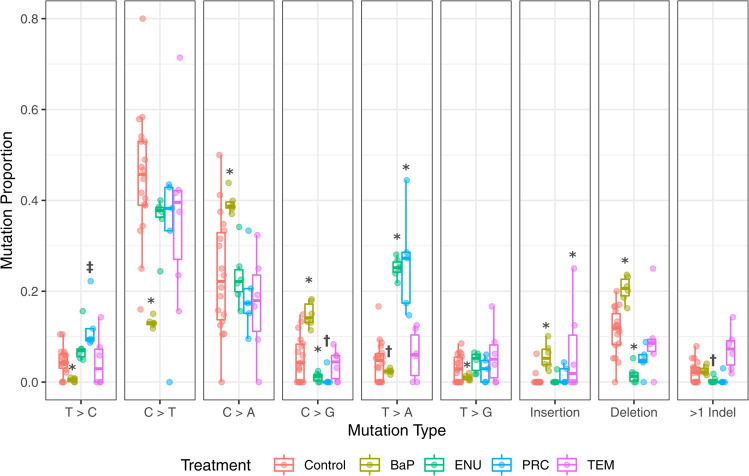
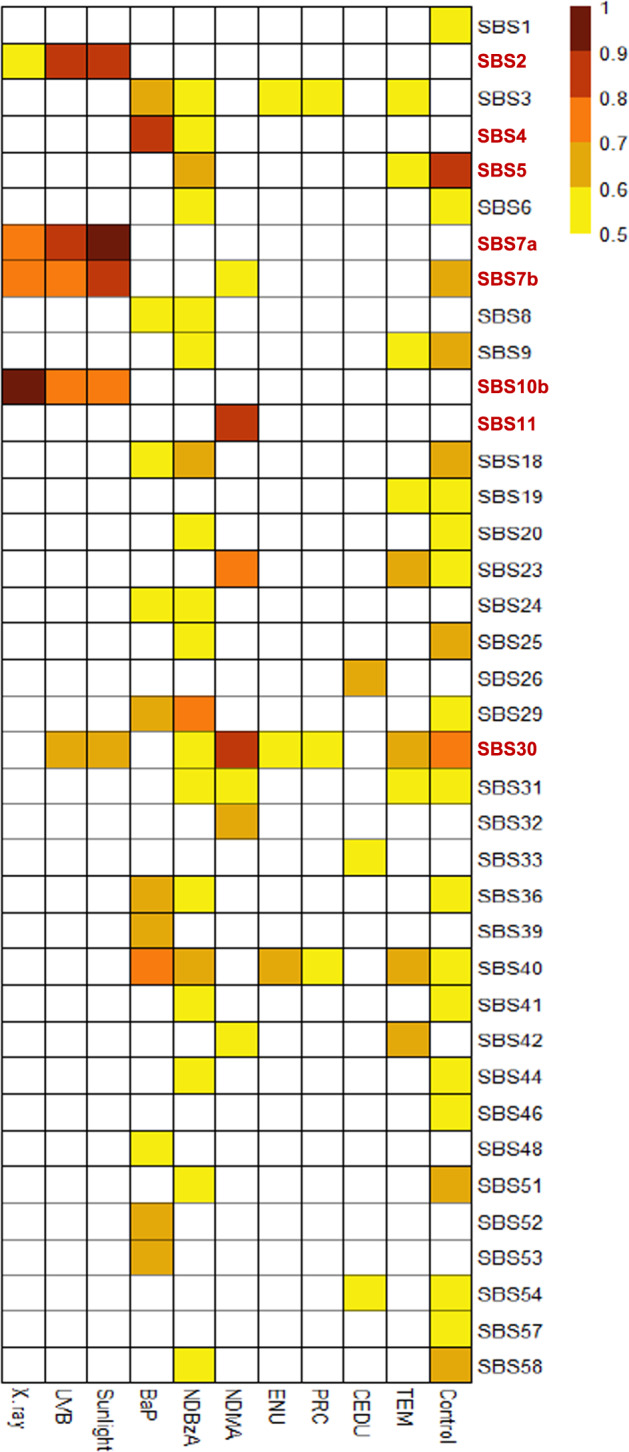
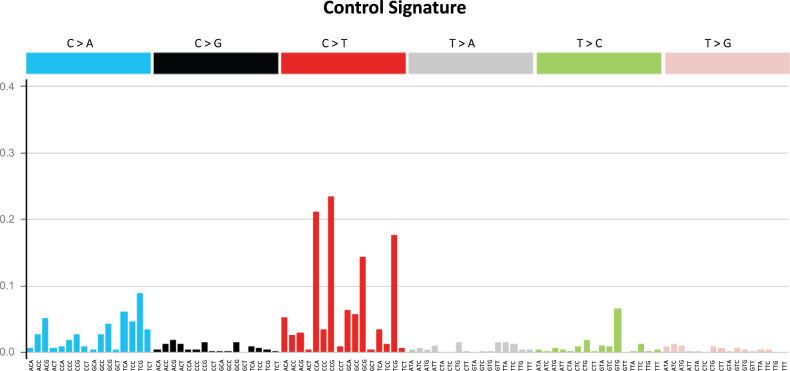
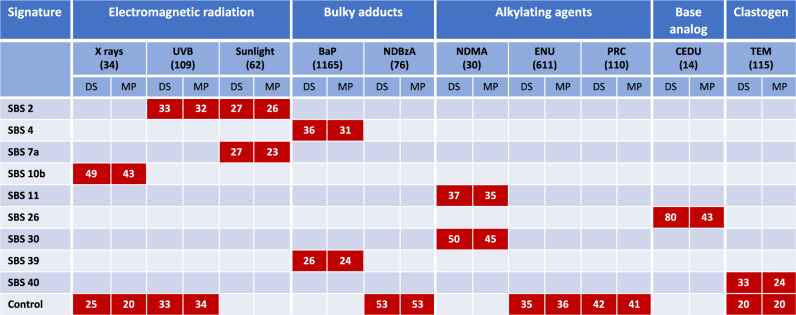
Transgenic rodent (TGR) models use bacterial reporter genes to quantify in vivo mutagenesis. Pairing TGR assays with next-generation sequencing (NGS) enables comprehensive mutation pattern analysis to inform mutational mechanisms. We used this approach to identify 2751 independent lacZ mutations in the bone marrow of MutaMouse animals exposed to four chemical mutagens: benzo[a]pyrene, N-ethyl-N-nitrosourea, procarbazine, and triethylenemelamine. We also collected published data for 706 lacZ mutations from eight additional environmental mutagens. We report that lacZ gene sequencing generates chemical-specific mutation signatures observed in human cancers with established environmental causes. For example, the mutation signature of benzo[a]pyrene, a carcinogen present in tobacco smoke, matched the signature associated with tobacco-induced lung cancers. Our results suggest that the analysis of chemically induced mutations in the lacZ gene shortly after exposure provides an effective approach to characterize human-relevant mechanisms of carcinogenesis and propose novel environmental causes of mutation signatures observed in human cancers.


Conflict of interest statement

The authors declare no competing interests.

Figures

Fig. 1
Fig. 1. Experimental design.
The experimental workflow included: animal exposure and determination of mutant frequencies (steps 1–2); sequencing of collected plaques and collection of published lacZ sequenced data (steps 3–4); generation of mutation profiles (steps 5–6); and query of the COSMIC database to identify mutational signatures that contributed to the mutation profile of tested agents (steps 7–8). The steps are detailed here and numbered as in the figure: (1) Four chemicals were tested in-house against solvent controls using the TGR in vivo mutagenicity assay. (2) Mutant plaques from controls and chemical-exposed mice were collected and pooled per individual. (3) Mutant plaques were PCR amplified as two technical replicates, library prepped and sequenced on the Ion Proton Platform. SNVs were called and corrected for clonal expansion. (4) Published Sanger sequencing data were compiled for eight additional mutagens, plus controls, tested using the lacZ plasmid or MutaMouse mice. (5) All sequencing data (Sanger and Ion Proton) were imported into the R console and trinucleotide mutation context were obtained using the “mutationContext” function. (6) To compare human COSMIC signatures and lacZ mutation data, the COSMIC signatures were normalized to lacZ trinucleotide frequencies and each of the 96 trinucleotide substitutions were represented as relative frequency. (7) The “deconstructSigs” and “MutationalPatterns” packages were used in parallel to identify COSMIC signatures that best describe the mutational fingerprint of mutagen exposure. (8) High confidence signatures were selected as those that: (i) were detected by both “deconstructSigs” and “MutationalPatterns”; (ii) contributed at least 20%; (iii) had a cosine similarity of 0.5 or higher with the mutational fingerprint.
Fig. 2
Fig. 2. Spontaneous and chemical-induced mutation proportions in bone marrow as characterized by NGS.
BaP, shown in yellow, has significantly higher proportions of C>A, C>G, insertions, and deletions compared to control (red). In contrast, there is a lower proportion of T>C, C>T, T>A, and T>G mutations than control. ENU, shown in green, has a higher proportion of T>A mutations, while C>T, C>G, and deletions are lower. PRC, shown in blue, has a higher proportion of T>A compared to control, and a marginally significant increase in T>C mutations compared to control (P = 0.055). The mutation pattern for TEM, shown in purple, is most similar to that of the control, with the exception of a significant increase in the proportion of insertions. P < 0.1, P < 0.05, *P < 0.0001. The number of animals for controls, BaP, ENU, PRC, and TEM were, 18, 6, 6, 5, and 6, respectively.
Fig. 3
Fig. 3. Trinucleotide context differences between the lacZ transgene, mouse genome, and human genome.
Comparison of the frequencies of the 64 possible trinucleotides among the lacZ transgene (lacZ), mouse genome (mm10), and human genome (hg38) show that mouse and human genome frequencies are comparable with each other, while lacZ is more variable and biased towards some GC rich trinucleoties.
Fig. 4
Fig. 4. Heatmap of similarities between obtained mutational profiles of tested agents and COSMIC SBS signatures.
All comparisons that had a cosine similarity above 0.5 are shown. The eight SBS signatures that had a cosine similarity greater than 0.7 are indicated in bold on the right of the heatmap.
Fig. 5
Fig. 5. The lacZ control signature.
The control signature is based on empirical mutation data from control animals in NGS and Sanger studies.
Fig. 6
Fig. 6. The contribution of COSMIC signatures to the mutation profile of each agent.
The number below each agent indicates the number of unique mutants sequenced, while the number in each box represents the percent contribution of each signature to the mutation profile of each tested agent. Only those signatures that passed the criteria for inclusion (i.e., detected by both deconstructSigs and MutationalPatterns; at least 20% contribution by both methods; and cosine similarity >0.5 with the mutation profile) are shown. DS = deconstructSigs; MP = MutationalPatterns.

References

    1. Lambert IB, Singer TM, Boucher SE, Douglas GR. Detailed review of transgenic rodent mutation assays. Mutat. Res. 2005;590:1–280. - PubMed
    1. OECD, Detailed Review Paper on Transgenic Rodent Mutation Assay Series on testing and assessment, No. 103, ENV/JM/MONO(2009)7, OECD, Paris (2009).
    1. Meier MJ, Beal MA, Schoenrock A, Yauk CL, Marchetti F. Whole genome sequencing of the mutamouse model reveals strain- and colony-level variation, and genomic features of the transgene integration site. Sci. Rep. 2019;9:13775. - PMC - PubMed
    1. Shwed PS, Crosthwait J, Douglas GR, Seligy VL. Characterisation of MutaMouse lambdagt10-lacZ transgene: evidence for in vivo rearrangements. Mutagenesis. 2010;25:609–616. - PMC - PubMed
    1. Gingerich J. D., Soper L., Lemieux C. L., Marchetti F. & Douglas G. R. Transgenic Rodent Gene Mutation Assay in Somatic Tissues (Springer Science+Business Media, 2014).

Publication types

Substances