. 2020 Aug 14;16(8):e1008718.
doi: 10.1371/journal.ppat.1008718. eCollection 2020 Aug.

Footprint of the host restriction factors APOBEC3 on the genome of human viruses

Affiliations

Footprint of the host restriction factors APOBEC3 on the genome of human viruses

Florian Poulain et al. PLoS Pathog. .

Abstract

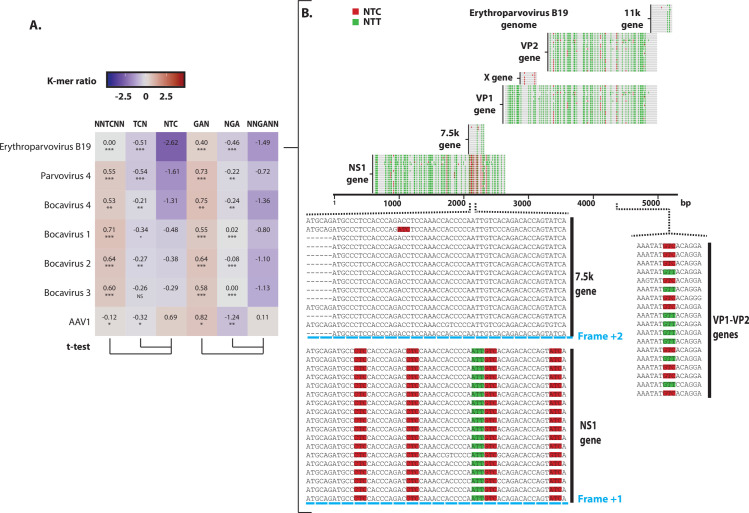
APOBEC3 enzymes are innate immune effectors that introduce mutations into viral genomes. These enzymes are cytidine deaminases which transform cytosine into uracil. They preferentially mutate cytidine preceded by thymidine making the 5'TC motif their favored target. Viruses have evolved different strategies to evade APOBEC3 restriction. Certain viruses actively encode viral proteins antagonizing the APOBEC3s, others passively face the APOBEC3 selection pressure thanks to a depleted genome for APOBEC3-targeted motifs. Hence, the APOBEC3s left on the genome of certain viruses an evolutionary footprint. The aim of our study is the identification of these viruses having a genome shaped by the APOBEC3s. We analyzed the genome of 33,400 human viruses for the depletion of APOBEC3-favored motifs. We demonstrate that the APOBEC3 selection pressure impacts at least 22% of all currently annotated human viral species. The papillomaviridae and polyomaviridae are the most intensively footprinted families; evidencing a selection pressure acting genome-wide and on both strands. Members of the parvoviridae family are differentially targeted in term of both magnitude and localization of the footprint. Interestingly, a massive APOBEC3 footprint is present on both strands of the B19 erythroparvovirus; making this viral genome one of the most cleaned sequences for APOBEC3-favored motifs. We also identified the endemic coronaviridae as significantly footprinted. Interestingly, no such footprint has been detected on the zoonotic MERS-CoV, SARS-CoV-1 and SARS-CoV-2 coronaviruses. In addition to viruses that are footprinted genome-wide, certain viruses are footprinted only on very short sections of their genome. That is the case for the gamma-herpesviridae and adenoviridae where the footprint is localized on the lytic origins of replication. A mild footprint can also be detected on the negative strand of the reverse transcribing HIV-1, HIV-2, HTLV-1 and HBV viruses. Together, our data illustrate the extent of the APOBEC3 selection pressure on the human viruses and identify new putatively APOBEC3-targeted viruses.


Conflict of interest statement

The authors have declared that no competing interests exist.

Figures

Fig 1
Fig 1. Definition and estimation method of the A3 footprint.
A. A3-induced cytidine deamination followed by viral replication leads to C to T mutations (in red). Most of the A3 enzymes favor deamination in a 5’TC context. The TC dinucleotide motif is depicted in three possible codon contexts on both coding and template strand. Depending on the position of the mutated C, the C to T transition can be synonymous (S) or non-synonymous (NS). Proportion of S and NS mutations is reported when the two types of mutation can be produced. Because synonymous mutations are more likely to be retained, the A3 footprint can be defined as the depletion of the NTC and/or NNGANN codons. B. Depletion or enrichment of a given K-mer (e.g. NTC) is calculated as the log2 ratio of the observed occurrence of that K-mer (n obs) divided by its expected occurrence (n exp). For each human virus, its coding sequences (colored arrows) are concatenated to generate a synthetic coding genome from which we obtain the n obs of a given K-mer. The synthetic coding genome is then shuffled a thousand times and the n exp is calculated as the average count for that K-mer.
Fig 2
Fig 2. Evidence of an A3 footprint in human polyomaviruses.
The observed/expected ratios of TC dinucleotide at various codon positions and on both strand (i.e. NNTCNN, TCN, NTC, GAN, NGA and NNGANN) were calculated for BK polyomavirus (panels A-B), JC polyomavirus (panels C-D) and Merkel cell polyomavirus (panel E-F). For the dot plots, each point stands for a unique full-length viral genome. Median and quartile are depicted by a boxplot. P-values were calculated by Student’s unpaired, two-tailed t-test (NS for not significant, * p< 0.05, ** p< 0.01, *** p< 0.001). Panels B, D and F illustrate NTC and NNGANN ratios for the different viral coding sequences. A colored scale with increasing shades of blue indicating depletion and increasing shades of red indicating enrichment. Replication origin is illustrated by a black dot and gene transcriptional orientation is symbolized by black arrows.
Fig 3
Fig 3. A sub-population of Human and non-human primate viruses is depleted in NTC codon.
Four datasets including Human viruses (n = 33,400), non-human primate viruses (n = 1,397), avian viruses (n = 9,160) and fish viruses (n = 570) have been analyzed for their observed/expected K-mer ratios. A. The composition of each data set regarding the breakdown into viral groups is illustrated by pie charts. B. The observed/expected ratios of TC dinucleotide at various codon positions for Human, non-human primate, bird and fish viruses are illustrated by dot plots (one point represents one unique viral sequence). C. K-mers are grouped and colored according to their capacity to encode a common amino-acid (in red for NTT/C, in yellow for NCC/G/T/A, in orange for NGT/C, in blue for NAC/T and in green for NAA/G).
Fig 4
Fig 4. Search for the A3-footprinted human viruses.
A. The NTC and NNGANN observed/expected ratios for 33,400 human viruses’ genomes (from 870 unique species) were calculated, grouped by species and colored according to the Baltimore classification. Each point represents a unique viral genome. Abundance distribution is depicted by a histogram on the right-hand side of the panel. Viral species with an NTC or NNGANN ratio below two times the standard deviation (dotted grey line) from the population median (red line) are the putative A3-footprinted viruses. B. The observed/expected ratios of TC dinucleotide at various codon positions and on both strands (i.e. NNTCNN, TCN, NTC, GAN, NGA and NNGANN) were calculated for the putative A3-footprinted viral species and depicted by a heatmap. A colored scale with increasing shades of blue indicating depletion and increasing shades of red indicating enrichment. P-values were calculated by Student’s unpaired, two-tailed t-test (NS for not significant, * p< 0.05, ** p< 0.01, *** p< 0.001). (PV stands for papillomavirus, PyV for polyomavirus).
Fig 5
Fig 5. Intensive A3 footprint on both strands of the B19 Erythroparvovirus genome.
A. The observed/expected ratios of TC dinucleotide at various codon positions for the B19 Erythroparvovirus were compared to those of the other human members of the parvoviridae family and depicted by a heatmap. A colored scale with increasing shades of blue indicating depletion and increasing shades of red indicating enrichment. P-values were calculated by Student’s unpaired, two-tailed t-test (NS for not significant, * p< 0.05, ** p< 0.01, *** p< 0.001). B. Coding sequences (NS1, 7.5k, VP1, X, VP2 and 11k) from 18 full-length B19 erythroparvirus were depicted by grey lines overlaid by red marks to symbolize NTC and green marks to position NTT codons. Zoom-in detailed a 60 bp-long sequence from the NS1 and 7.5k genes (from nucleotide 1723 to 1783). A second zoom-in detailed a 15 bp-long sequence from the VP1-VP2 genes (from nucleotide 3973 to 3987).
Fig 6
Fig 6. A3 footprint on endemic but not on zoonotic coronaviruses.
The observed/expected ratios of TC dinucleotide at various codon positions were calculated for endemic human coronaviruses (229E, NL63, OC43 and HKU1) and compared to those of zoonotic coronaviruses (MERS-CoV, SARS-CoV-1 and SARS-CoV-2) and their ancestors (camel-MERS and bat-SARS). A colored scale with increasing shades of blue indicating depletion and increasing shades of red indicating enrichment. P-values were calculated by Student’s unpaired, two-tailed t-test (NS for not significant, * p< 0.05, ** p< 0.01, *** p< 0.001).
Fig 7
Fig 7. Search for an A3 footprint at the gene level.
A. Alongside the observed/expected K-mer ratios calculated from the synthetic coding genomes (named genomic K-mer ratios), K-mer ratios were also computed for each viral coding sequence individually (named genic K-mer ratios). Differential ratio is defined as the subtraction of genic K-mer ratio to the corresponding genomic K-mer ratio. B. List of the putative A3-footprinted viral genes and belonging to an otherwise non-depleted viral genome (having at least five reported sequences).
Fig 8
Fig 8. A3 footprint at the genomic ends of adenoviruses.
NTC observed/expected ratios (panel A) and NNGANN observed/expected ratios (panel B) were calculated for the different genes of the Adenovirus A and B (each point represents a unique coding sequence). C. Proposed model for A3-editing activity on the adenovirus genome. Genes are represented by black arrows. A3-favored NTC sequence is represented in red and the NTT edited product in green.
Fig 9
Fig 9. A3 footprint at the lytic replication origins of EBV.
A. NTC observed/expected ratios were calculated for the different genes of EBV (each point represents a unique coding sequence) and the five most A3-footprinted genes were highlighted and positioned on the EBV genome map. B. Zoom-in detailing the NTC ratios of the genes surrounding the Ori-Lyt (lytic origin of replication) of EBV. A colored scale with increasing shades of blue indicating NTC depletion and increasing shades of red indicating NTC enrichment. C. Proposed model for A3-editing activity favoring the lagging strand at the EBV lytic origin of replication. A3-favored NTC sequence is represented in red and the NTT edited product in green.
Fig 10
Fig 10. A3 footprint on the negative strand of HTLV-1 and HBV.
A. NTC and NNGANN observed/expected ratios were calculated for the different genes of HTLV-1. B. Each gene specific NTC and NNGANN ratio median values were reported on HTLV-1 genome map by a colored scale. C. NTC and NNGANN observed/expected ratios were calculated for the different genes of HBV. D. Each gene specific NTC and NNGANN ratio median values were reported on HBV genome map by a colored scale.
Fig 11
Fig 11. A3 footprint on the negative strand of HIV-1, HIV-2 and SIV.
The observed/expected ratios of TC dinucleotide at various codon positions and on both strand (i.e. NNTCNN, TCN, NTC, GAN, NGA and NNGANN) were calculated for the genomes of HIV-1 (distributed into their respective groups and subtypes, panels A to G), HIV-2 (panel H) and SIV (panel I). Each point stands for a unique full-length viral genome. Median and quartile are depicted by a boxplot. P-values were calculated by Student’s unpaired, two-tailed t-test (NS for not significant, * p< 0.05, ** p< 0.01, *** p< 0.001).

References

    1. Harris RS, Dudley JP. APOBECs and virus restriction. Virology. 2015;479–480: 131–145. 10.1016/j.virol.2015.03.012 - DOI - PMC - PubMed
    1. Willems L, Gillet NA. APOBEC3 Interference during Replication of Viral Genomes. Viruses. 2015;7: 2999–3018. 10.3390/v7062757 - DOI - PMC - PubMed
    1. Salter JD, Bennett RP, Smith HC. The APOBEC Protein Family: United by Structure, Divergent in Function. Trends Biochem Sci. 2016;41: 578–594. 10.1016/j.tibs.2016.05.001 - DOI - PMC - PubMed
    1. Münk C, Willemsen A, Bravo IG. An ancient history of gene duplications, fusions and losses in the evolution of APOBEC3 mutators in mammals. BMC Evol Biol. 2012;12: 71 10.1186/1471-2148-12-71 - DOI - PMC - PubMed
    1. Taylor BJ, Nik-Zainal S, Wu YL, Stebbings LA, Raine K, Campbell PJ, et al. DNA deaminases induce break-associated mutation showers with implication of APOBEC3B and 3A in breast cancer kataegis. Stamatoyannopoulos J, editor. eLife. 2013;2: e00534 10.7554/eLife.00534 - DOI - PMC - PubMed

Publication types