. 2020 Nov 2;217(11):e20191259.
doi: 10.1084/jem.20191259.

Necroptosis restricts influenza A virus as a stand-alone cell death mechanism

Affiliations

Necroptosis restricts influenza A virus as a stand-alone cell death mechanism

Maria Shubina et al. J Exp Med. .

Abstract

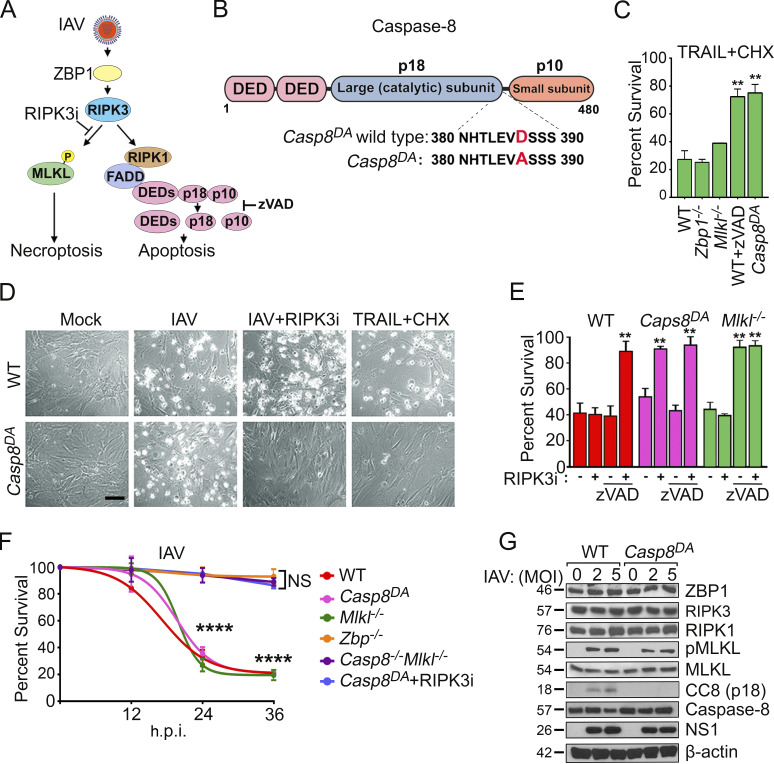
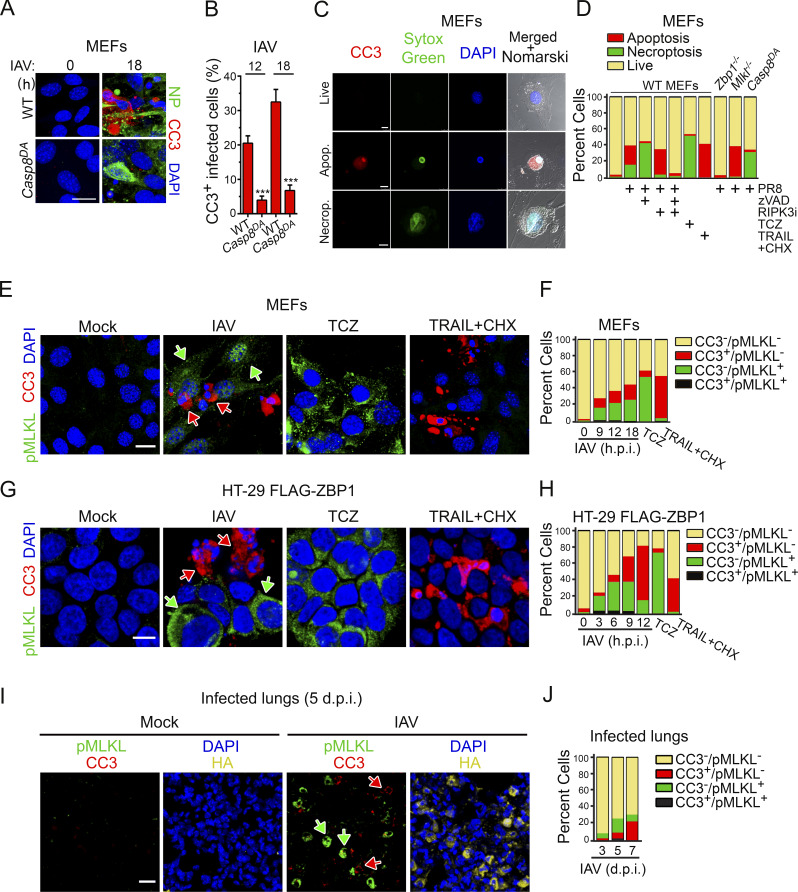
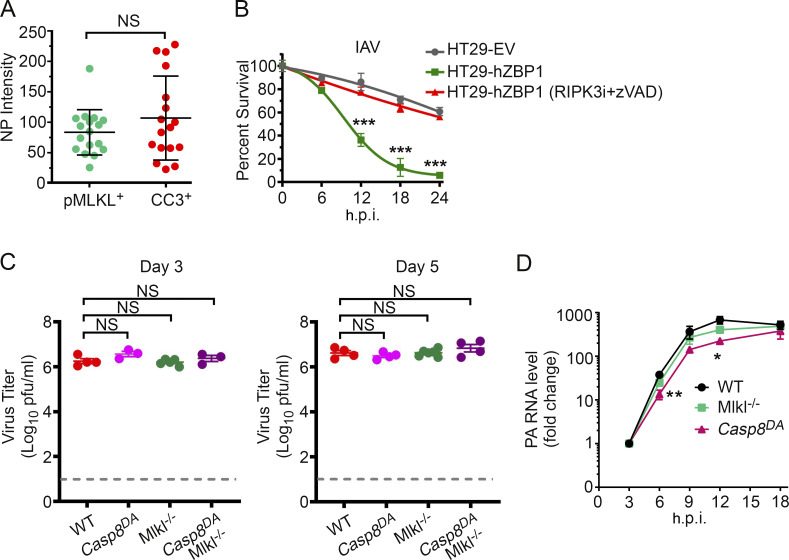
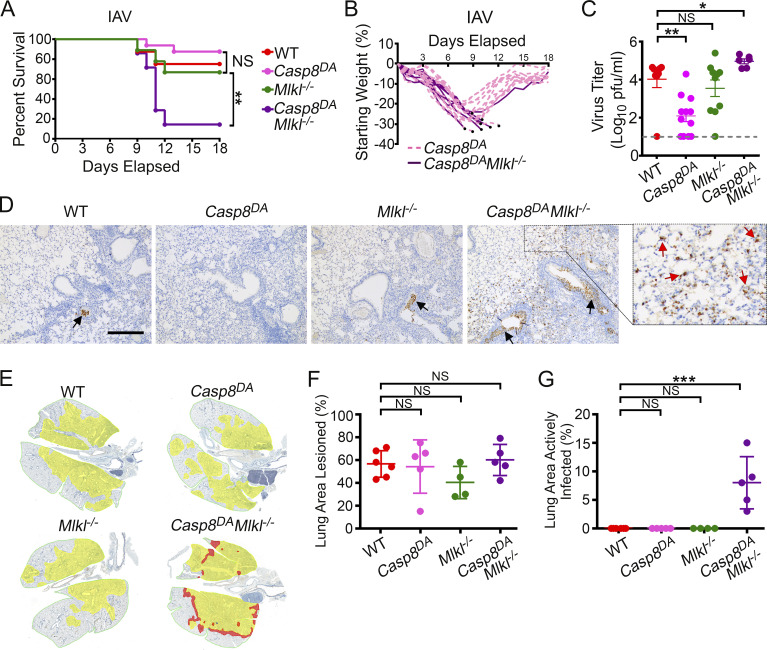
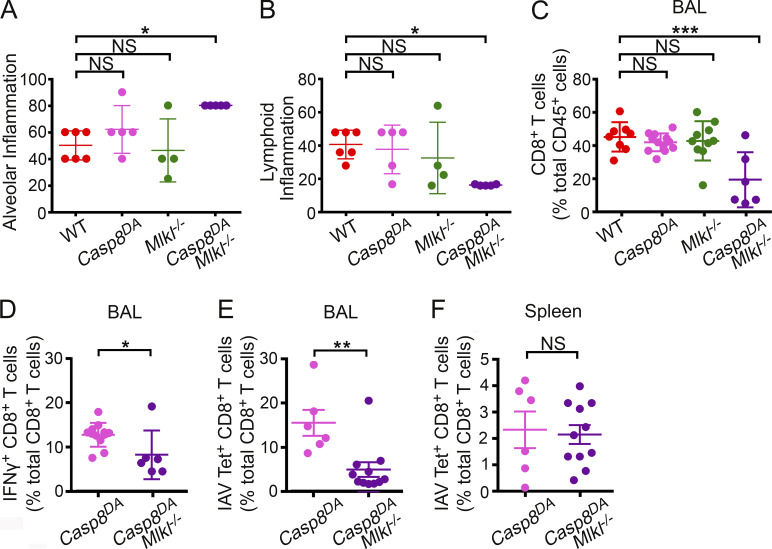
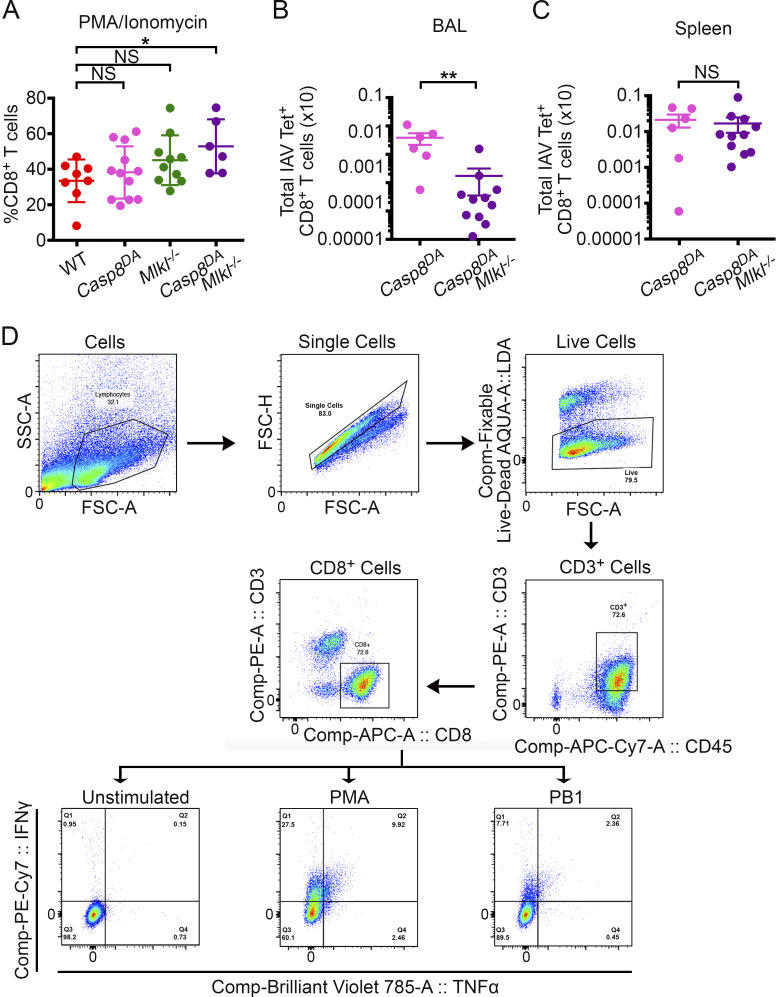
Influenza A virus (IAV) activates ZBP1-initiated RIPK3-dependent parallel pathways of necroptosis and apoptosis in infected cells. Although mice deficient in both pathways fail to control IAV and succumb to lethal respiratory infection, RIPK3-mediated apoptosis by itself can limit IAV, without need for necroptosis. However, whether necroptosis, conventionally considered a fail-safe cell death mechanism to apoptosis, can restrict IAV-or indeed any virus-in the absence of apoptosis is not known. Here, we use mice selectively deficient in IAV-activated apoptosis to show that necroptosis drives robust antiviral immune responses and promotes effective virus clearance from infected lungs when apoptosis is absent. We also demonstrate that apoptosis and necroptosis are mutually exclusive fates in IAV-infected cells. Thus, necroptosis is an independent, "stand-alone" cell death mechanism that fully compensates for the absence of apoptosis in antiviral host defense.


Conflict of interest statement

Disclosures: P.G. Thomas reported other from Cytoagents outside the submitted work; in addition, P.G. Thomas had a patent to US201462068561P pending. No other disclosures were reported.

Figures

Figure 1.
Figure 1.
Casp8DA MEFs are selectively resistant to IAV-induced apoptosis. (A) ZBP1-RIPK3–dependent cell death pathways activated by IAV. Apoptosis is mediated by RIPK1/FADD-dependent activation of Casp8. (B) Casp8 domain organization and knock-in mutation (D387A) in Casp8DA mice. DED, death effector domain. (C) MEFs were treated with murine TRAIL (100 ng/ml) in the presence of cycloheximide (CHX; 250 ng/ml), and cell viability was determined at 24 h. n = 3 replicates per condition; data are from one of four experiments with similar results. (D) Photomicrographs of WT and Casp8DA MEFs infected with PR8 (multiplicity of infection [MOI]), 2) in the presence or absence of RIPK3 inhibitor GSK’843 (5 µM) or treated with TRAIL (100 ng/ml) + CHX (250 ng/ml) for 24 h. Scale bar = 100 µm. (E) WT, Casp8DA, or Mlkl−/− MEFs were infected with PR8 (MOI, 2) and exposed to the indicated inhibitors, and cell viability was determined at 24 h postinfection (h.p.i.). n = 3 replicates per condition; data are from one of four experiments with similar results. (F) Cell death kinetics after PR8 infection (MOI, 2) of MEFs from the indicated genotypes. n = 3 replicates per condition; data are from one of six experiments with similar results. (G) WT and Casp8DA MEFs were infected with PR8 (MOI, 2 or 5) and examined for the indicated proteins at 24 h. Molecular weights in kilodaltons are shown to the left. Results are representative of three independent experiments. Unpaired Student’s t test (C and E); two-way ANOVA and Tukey’s multiple comparisons test (F). Error bars represent mean ± SD; **, P < 0.005; ****, P < 0.00005.
Figure S1.
Figure S1.
Generation of Casp8DA mice. (A) Schematic of the Casp8DA allele showing primer sequences, location of the SacI cleavage site, and sizes of expected PCR amplicons after cleavage with SacI. (B) PCR results showing undigested (top) or SacI-digested (bottom) amplicon products produced from genomic tail DNA of mice from the indicated genotypes.
Figure 2.
Figure 2.
IAV-induced apoptosis and necroptosis do not occur in the same infected cell. (A) WT and Casp8DA MEFs infected with PR8 (MOI, 2) were examined for apoptosis using antibodies to CC3 (red) at 18 h.p.i. Virus replication was determined by staining for NP (green). Scale bar = 20 µm. (B) Quantification of CC3 in virus-positive infected cells at the indicated times after infection. Data are pooled from four fields with 30–60 cells/field; data are from one of four experiments with similar results. (C) MEFs were infected with PR8 (MOI, 2), harvested at 18 h.p.i., and stained for CC3 (red) and SYTOX Green. Scale bar = 10 µm. (D) Quantification of live, apoptotic, and necroptotic cells following the indicated treatments at 18 h (PR8; MOI, 2) or 12 h (TCZ, TRAIL + CHX). Data are pooled from four fields with 30–60 cells/field; data are from one of four experiments with similar results. (E) Primary MEFs infected with PR8 (MOI, 2; 18 h) or treated with either TCZ (12 h) or TRAIL + CHX (12 h) were examined for apoptosis and necroptosis by immunofluorescence using antibodies to CC3 (red) and pMLKL (green), respectively. Scale bar = 20 µm. (F) Quantification of CC3 and/or pMLKL positivity at the indicated times after infection (PR8) or at 12 h (TCZ, TRAIL + CHX). Data are pooled from four fields with 20–50 cells/field; data are from one of four experiments with similar results. (G) Human HT-29 cells made competent for IAV-activated cell death by stable retroviral expression of FLAG-tagged hZBP1 were infected with PR8 (MOI, 2; 9 h.p.i.) or treated with either TCZ (6 h) or TRAIL + CHX (9 h) and examined for apoptosis and necroptosis by immunofluorescence using antibodies to CC3 (red) and pMLKL (green). Scale bar = 10 µm. (H) Quantification of CC3 and/or pMLKL positivity at the indicated times after infection (PR8; MOI, 2). TCZ- and TRAIL + CHX–treated cells were evaluated at 6 h and 9 h after treatment, respectively. Data are pooled from four fields with 30–50 cells/field; data are from one of four experiments with similar results. (I) Mock- or IAV-infected lungs were stained for CC3 (red) or pMLKL (green) at 5 d.p.i. Nuclei are stained with DAPI (blue), and IAV HA is shown in yellow. Scale bar = 20 µm. (J) Quantification of pMLKL- and CC3-positive cells in IAV-infected lungs at the indicated days after infection. Arrows in E, G, and I point to pMLKL+ (green) or CC3+ (red) cells. Data are pooled from seven fields with 60–130 cells/field; data are from one of two experiments with similar results. Unpaired Student’s t test (B). Error bars represent mean ± SD. ***, P < 0.005.
Figure S2.
Figure S2.
Characterization of virus replication in cells and in vivo. (A) Quantification of NP signal intensity in IAV-infected WT MEFs (PR8; MOI, 2; 18 h.p.i.) that are either pMLKL+ or CC3+. Of note, a few apoptotic (i.e., CC3+) cells showed a markedly intense NP signal, likely because they had shrunk in size (characteristic of apoptosis) and therefore harbor a more condensed pool of NP. Data are pooled from three fields with 6–10 cells/field; data are from one of four experiments with similar results. (B) HT-29 FLAG-ZBP1 cells were produced by retroviral transduction of an expression vector encoding FLAG-tagged human ZBP1 into the HT-29 cell line. These cells, but not control cells expressing an empty vector (EV), underwent rapid cell death upon infection with PR8 (MOI, 2). IAV-induced cell death was dependent on ZBP1-RIPK3 signaling, shown by rescue with the combination of RIPK3i (GSK’843; 5 µM) + zVAD (50 µM). n = 3 replicates per condition; data are from one of six experiments with similar results. (C) Lung virus titers of mice of the indicated genotypes at 3 d.p.i. (left) or at 5 d.p.i (right) with PR8 (1,500 EID50). WT, n = 4; Casp8DA, n = 3; Mlkl−/−, n = 5; Casp8DAMlkl−/−, n = 3 for D3. WT, n = 4; Casp8DA, n = 4; MlKl−/−, n = 5; Casp8DAMlKl−/−, n = 4 for D5. (D) Kinetics of IAV (PR8; MOI, 2) replication in MEFs of the indicated genotypes as determined by quantitative RT-PCR analysis of PA segment levels. n = 3 replicates per condition; data are from one of six experiments with similar results. Unpaired Student’s t test (A and D); two-way ANOVA with Tukey’s multiple comparisons test (B); Mann-Whitney test (C). Error bars represent mean ± SD. *, P < 0.05; **, P < 0.005; ***, P < 0.0005.
Figure 3.
Figure 3.
Necroptosis protects against IAV in the absence of apoptosis. (A) Survival analysis of 8–12-wk-old sex-matched mice of the indicated genotypes (WT, n = 8; Casp8DA, n = 13; Mlkl−/−, n = 7; Casp8DAMlkl−/−, n = 7) following infection with PR8 (2,500 EID50/mouse). (B) Weight loss analysis of Casp8DA and Casp8DAMlkl−/− mice shown in A. Dead mice are represented by black circles. Casp8DA, n = 13; Casp8DAMlkl−/−, n = 7. (C) Lung virus titers of mice of the indicated genotypes at 9 d.p.i. with PR8 (1,500 EID50). WT, n = 8; Casp8DA, n = 12; Mlkl−/−, n = 10; Casp8DAMlkl−/−, n = 6. (D) Staining for IAV antigen in the lung at 9 d.p.i. with PR8 (1,500 EID50). Red arrows show actively infected cells in lungs of Casp8DAMlkl−/− mice. Black arrows point to antigen-positive extracellular virus debris. Scale bar = 300 µm. (E) Morphometry of virus spread. Alveolar areas containing virus antigen–positive cells are highlighted in red, and lesioned areas with no/minimal antigen-positive debris are shown in yellow. (F) Percentage of infected lungs with lesioned areas, calculated from the morphometric images shown in E. WT, n = 6; Casp8DA, n = 5; Mlkl−/−, n = 4; Casp8DAMlkl−/−, n = 5. (G) Percentage of infected lung showing areas of active infection, calculated from the morphometric images shown in E. WT, n = 6; Casp8DA, n = 5; Mlkl−/−, n = 4; Casp8DAMlkl−/−, n = 5. Data are representative of (A and B) or pooled from (C–G) two independent experiments. Log-rank (Mantel-Cox) test (A); Mann-Whitney test (C); one-way ANOVA comparing WT samples with every other genotype (G and H). Error bars represent mean ± SD. *, P < 0.05; **, P < 0.005; ***, P < 0.00005.
Figure 4.
Figure 4.
Necroptosis mediates effective anti-IAV CD8+ T cell responses in the absence of apoptosis. (A) Quantification of alveolar inflammation in infected lungs from mice of the indicated genotypes at 6 d.p.i. with PR8 (1,500 EID50). WT, n = 6; Casp8DA, n = 5; Mlkl−/−, n = 4; Casp8DAMlkl−/−, n = 5. (B) Assessment of lymphoid inflammation from infected lungs of the indicated genotypes at 6 d.p.i. with PR8 (1,500 EID50). WT, n = 6; Casp8DA, n = 5; Mlkl−/−, n = 4; Casp8DAMlkl−/−, n = 5. (C) Percentage of CD8+ T cells as a proportion of all immune (CD45+) cells in the BAL of mice of the indicated genotypes at 9 d.p.i. with PR8 (1,500 EID50). WT, n = 8; Casp8DA, n = 12; Mlkl−/−, n = 10; Casp8DAMlkl−/−, n = 6. (D) Frequencies of IFNγ+ CD8+ T cells among all CD8+ T cells from the BAL of mice of the indicated genotypes following stimulation with IAV PB1703–711 peptide ex vivo. BAL fluid was collected at 8 d.p.i. with PR8 (1,500 EID50). Casp8DA, n = 12; Casp8DAMlkl−/−, n = 6. (E) Frequencies of IAV PB1703–711 tetramer+ CD8+ T cells from the BAL of mice of the indicated genotypes collected at 8 d.p.i. with PR8 (1,500 EID50). Casp8DA, n = 6; Casp8DAMlkl−/−, n = 11. (F) Frequencies of IAV PB1703–711 tetramer+ CD8+ T cells from the spleens of mice of the indicated genotypes collected at 8 d.p.i. with PR8 (1,500 EID50). Casp8DA, n = 6; Casp8DAMlkl−/−, n = 11. Gating strategy used for flow cytometric analyses in this figure is shown in Fig. S3 D. Data are pooled from two independent experiments (A–F). One-way ANOVA comparing WT samples with every other genotype (A–F). Error bars represent mean ± SD. *, P < 0.05; **, P < 0.005; ***, P < 0.0005.
Figure S3.
Figure S3.
CD8+ T cell activation defects in Casp8DAMlkl−/− mice are lung specific. (A) Proliferation of CD8+ T cells from Casp8DAMlkl−/− mice is not impeded in response to the nonspecific stimulus PMA/ionomycin ex vivo. WT, n = 8; Casp8DA, n = 12; Mlkl−/−, n = 10; Casp8DAMlkl−/−, n = 6. (B) Total IAV PB1703–711 tetramer+ CD8+ T cells from the BAL of mice of the indicated genotypes collected at 8 d.p.i. with PR8 (1,500 EID50). Casp8DA, n = 6; Casp8DAMlkl−/−, n = 11. (C) Total IAV PB1703–711 tetramer+ CD8+ T cells from the BAL of mice of the indicated genotypes collected at 8 d.p.i. with PR8 (1,500 EID50). Casp8DA, n = 6; Casp8DAMlkl−/−, n = 11. (D) Gating strategy used in this figure and in Fig. 4. Data are representative of two independent experiments (A–C). One-way ANOVA comparing WT samples with every other genotype (A–C). *, P < 0.05; **, P < 0.005. FSC, forward scatter; SSC, side scatter.

References

    1. Ashkenazi A., and Dixit V.M.. 1998. Death receptors: signaling and modulation. Science. 281:1305–1308. 10.1126/science.281.5381.1305 - DOI - PubMed
    1. Cook W.D., Moujalled D.M., Ralph T.J., Lock P., Young S.N., Murphy J.M., and Vaux D.L.. 2014. RIPK1- and RIPK3-induced cell death mode is determined by target availability. Cell Death Differ. 21:1600–1612. 10.1038/cdd.2014.70 - DOI - PMC - PubMed
    1. Daniels B.P., Snyder A.G., Olsen T.M., Orozco S., Oguin T.H. III, Tait S.W.G., Martinez J., Gale M. Jr., Loo Y.M., and Oberst A.. 2017. RIPK3 restricts viral pathogenesis via cell death-independent neuroinflammation. Cell. 169:301–313.e11. 10.1016/j.cell.2017.03.011 - DOI - PMC - PubMed
    1. Daniels B.P., Kofman S.B., Smith J.R., Norris G.T., Snyder A.G., Kolb J.P., Gao X., Locasale J.W., Martinez J., Gale M. Jr., et al. . 2019. The nucleotide sensor ZBP1 and kinase RIPK3 induce the enzyme IRG1 to promote an antiviral metabolic state in neurons. Immunity. 50:64–76.e4. 10.1016/j.immuni.2018.11.017 - DOI - PMC - PubMed
    1. Dillon C.P., Oberst A., Weinlich R., Janke L.J., Kang T.B., Ben-Moshe T., Mak T.W., Wallach D., and Green D.R.. 2012. Survival function of the FADD-CASPASE-8-cFLIP(L) complex. Cell Rep. 1:401–407. 10.1016/j.celrep.2012.03.010 - DOI - PMC - PubMed

Publication types

MeSH terms