. 2020 Aug 3;61(10):31.
doi: 10.1167/iovs.61.10.31.

Autophagy in the Aging and Experimental Ocular Hypertensive Mouse Model

Affiliations

Autophagy in the Aging and Experimental Ocular Hypertensive Mouse Model

April Nettesheim et al. Invest Ophthalmol Vis Sci. .

Abstract

Purpose: To investigate autophagy in the outflow pathway and ganglion cell layer in the aging and ocular hypertensive mouse.

Methods: Both 4-month-old and 18-month-old C57BL/6J and GFP-LC3 mice were subjected to unilateral injection of hypertonic saline into a limbal vein, causing sclerosis of the outflow pathway and subsequent elevation of intraocular pressure (IOP). IOP was measured on a weekly basis using a rebound tonometer. Protein expression levels of LC3B, Lamp1, and p62 were evaluated by western blot and/or immunofluorescence. Retinal ganglion cell (RGC) count was performed in whole retinal flat mounts using an anti-Brn3a antibody. Optic nerves were fixed with 4% paraformaldehyde and resin-embedded for axon counts and electron microscopy.

Results: In contrast to 18-month-old mice, which developed sustained elevated IOP with a single injection, 4-month-old mice were refractory to high elevations of IOP. Interestingly, both the percentage of animals that developed elevated IOP and the mean ∆IOP were significantly higher in the transgenic mice compared to C57BL/6J. Immunofluorescence and western blot analysis showed dysregulated autophagy in the iridocorneal and retina tissues from 18-month-old mice compared to 4-month-old ones. Moreover, the LC3-II/LC3-I ratio correlated with IOP. As expected, injected hypertensive eyes displayed axonal degeneration and RGC death. RGC and axon loss were significantly exacerbated with aging, especially when combined with GFP-LC3 expression. Autophagic structures were observed in the degenerating axons.

Conclusions: Our results indicate dysregulation of autophagy in the trabecular meshwork and retinal tissues with aging and suggest that such dysregulation of autophagy contributes to neurodegeneration in glaucoma.


Conflict of interest statement

Disclosure: A. Nettesheim, None; A. Dixon, None; M.S. Shim, None; A. Coyne, None; M. Walsh, None; P.B. Liton, None

Figures

Figure 1.
Figure 1.
Effect of age and GFP-LC3 transgene on IOP. (A) Mean IOP (mm Hg) over time in C57BL/6J and GFP-LC3 mice. (B) Percentage of injected mice developing low (<50 mm Hg-days), mild (5–200 mm Hg-days), and severe (>200 mm Hg-days) ∆Integral IOP. (C) ∆Integral IOP with aging and GFP-LC3. *P < 0.05, 2-way ANOVA with Bonferroni post hoc test (n4moC57BL/6J = 26, n18moC57BL/6J = 17, n4moGFP-LC3 = 18, n18moGFP-LC3 = 17).
Figure 2.
Figure 2.
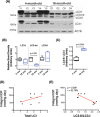
Quantification of the autophagy marker LC3 in the dissected iridocorneal angle region from 4-month-old and 18-month-old C57BL/6J mice. (A) Protein expression levels of LC3 in whole-tissue lysates (5 µg) of dissected iridocorneal region from 4-month-old (n = 5) and 18-month-old (n = 4) C57BL/6J mice, analyzed by WB. (B) Normalized relative protein levels of LC3-I, LC3-Int, and LC3-II and (C) the LC3-II/LC3-I ratios were calculated from the densitometric analysis of the bands. β-Actin was used as a loading control. Data are the means ± SD; t-test. (D, E) Linear correlation analysis between total LC3 and LC3-II/LC3-I protein levels with ∆Integral IOP calculated from the last 6-week IOP measurements prior to tissue dissection (n = 9; five 4-month-old and four 18-month-old mice).
Figure 3.
Figure 3.
Qualitative expression of autophagy markers in the TM of 4-month-old and 18-month-old C57BL/6J mice. (A) Representative immunofluorescence staining of LC3, p62, and LAMP1 (red fluorescence). Blue fluorescence represents DAPI nuclear counterstaining. Insets show high-magnification images of the TM region. (B) Mean scoring values of IF staining in the TM/SC region graded in a masked fashion by three independent observers (t-test, n4mo = 11, n18mo = 6). CB, ciliary body.
Figure 4.
Figure 4.
Effect of age and GFP-LC3 transgene in RGC loss in ocular hypertensive eyes. (A) Representative images from whole retinal flat mounts from 4-month-old and 18-month-old C57BL/6J and GFP-LC3 mice (uninjected and injected eyes) stained with anti-Brn3a (red fluorescence). Green fluorescence represents endogenous GFP-LC3 fluorescence; blue fluorescence represents nuclear DAPI staining. (B) Schematic drawing of flat mounts and placement of areas in which RGC counts were conducted. (C) Quantification of the number of Brn3a-positive cells. Data are the means ± SD. *,#P < 0.05: *2-way ANOVA with Bonferroni post hoc test, #paired t-test (n4mo-C57BL/6J =  6, n18mo-C57BL/6j =  8, n4mo-GFP-LC3 =  5, n18mo-GFP-LC3 = 6).
Figure 5.
Figure 5.
Autophagy in the GCL of aging and ocular hypertensive eye. (A) Representative immunofluorescence staining of LC3, p62, and LAMP1 (red fluorescence) in the GCL of injected and uninjected eyes in 4-month-old and 18-month-old C57BL/6J mice. Blue fluorescence represents nuclear DAPI counterstaining. The region of interest is delineated in yellow. (B) Standardized relative quantification of immunofluorescence staining in the region of interest. Data are the means ± SD. Two-way ANOVA with Bonferroni post hoc test; #paired t-test (n4mo-C57BL/6J =  6, n18mo-C57BL/6J =  8).
Figure 6.
Figure 6.
Effect of age and GFP-LC3 transgene in axonal degeneration in ocular hypertensive eyes. (A) Representative transmission electron micrographs of cross-sectional areas of the myelinated segment of the ONs in C57BL/6J and GFP-LC3 mice (4-month-old and 18-month-old, injected and uninjected eyes). Insets represent higher magnification images of autophagic structures in degenerating axons. (B) Total axon number counts. Data are the means ± SD. *, #P < 0.05: *2-way ANOVA with Bonferroni post hoc test, #paired t-test (n4mo-C57BL/6J =  6, n18mo-C57BL/6J =  8, n4mo-GFP-LC3 =  6, n18mo-GFP-LC3 = 9).

References

    1. Tombran-Tink J, Barnstable CJ, Shields MB, eds. Mechanisms of the glaucomas: disease processes and therapeutic modalities. Totowa, NJ: Humana Press; 2008.
    1. Chen DF, Cho K-S. Optic neuropathy and ganglion cell degeneration in glaucoma: mechanisms and therapeutic strategies. In: Tombran-Tink J Barnstable CJ, Shields BM, eds. Mechanisms of the glaucomas. Totowa, NJ: Humana Press; 2008: 393–423.
    1. Beckman KB, Ames BN. The free radical theory of aging matures. Physiol Rev. 1998; 78: 547–581. - PubMed
    1. Cuervo AM. Autophagy and aging: keeping that old broom working. Trends Genet. 2008; 24: 604–612. - PMC - PubMed
    1. Levine B, Kroemer G. Autophagy in the pathogenesis of disease. Cell. 2008; 132: 27–42. - PMC - PubMed

Publication types

MeSH terms

Substances