Review
. 2021 Jan 15;89(2):134-143.
doi: 10.1016/j.biopsych.2020.06.012. Epub 2020 Jun 17.

Great Expectations: A Critical Review of and Suggestions for the Study of Reward Processing as a Cause and Predictor of Depression

Affiliations
Review

Great Expectations: A Critical Review of and Suggestions for the Study of Reward Processing as a Cause and Predictor of Depression

Dylan M Nielson et al. Biol Psychiatry. .

Abstract

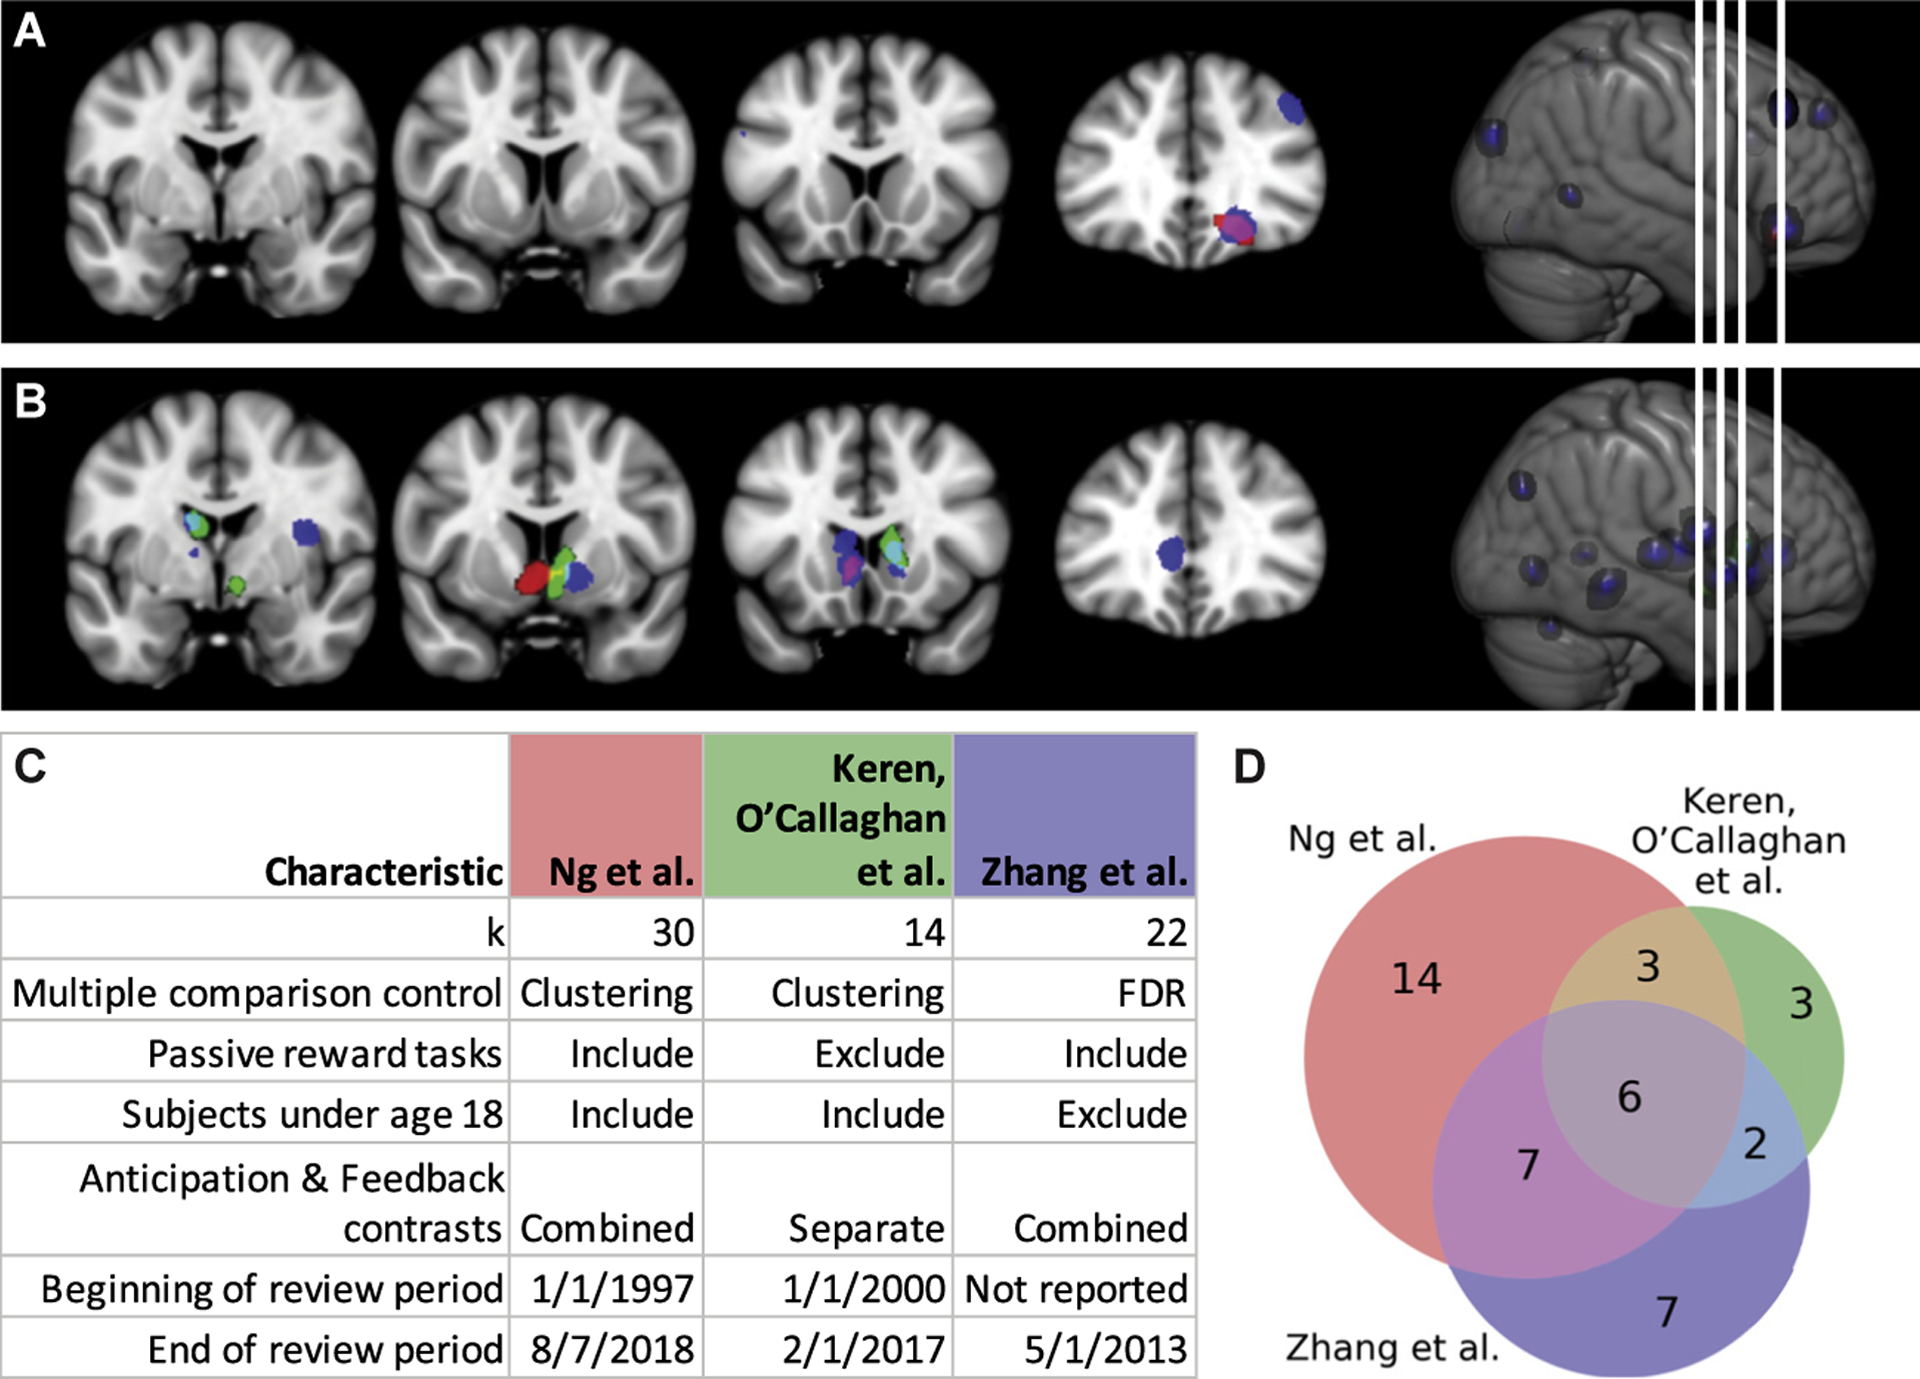
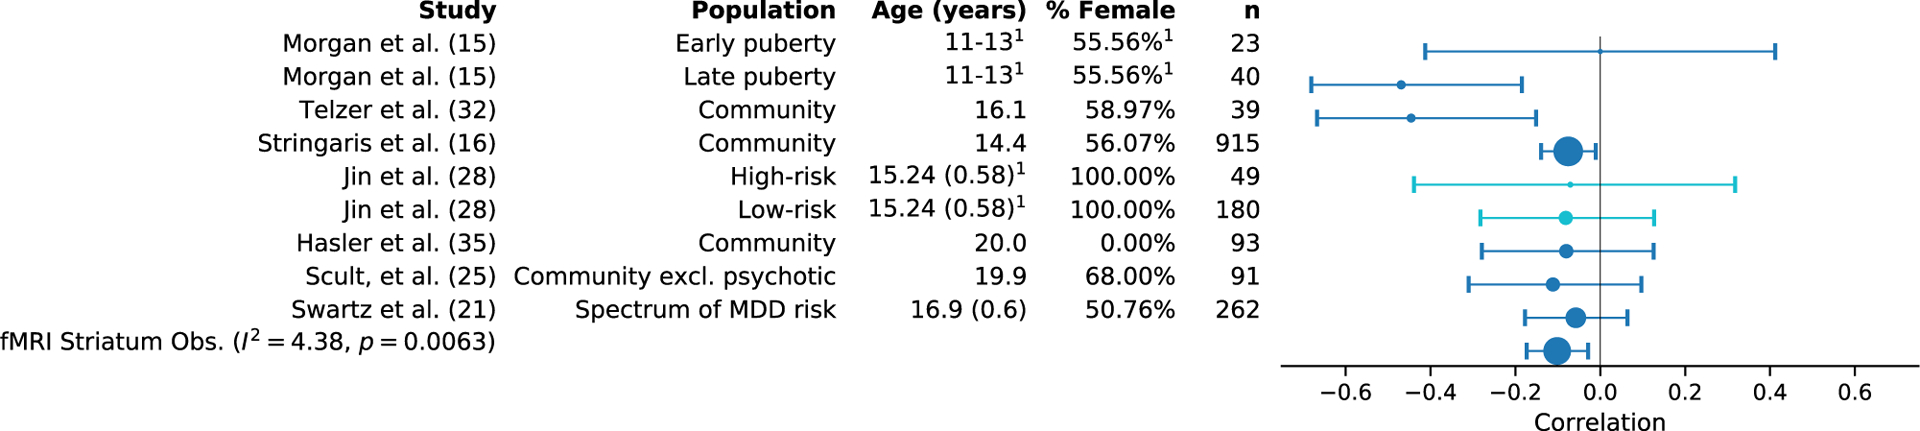
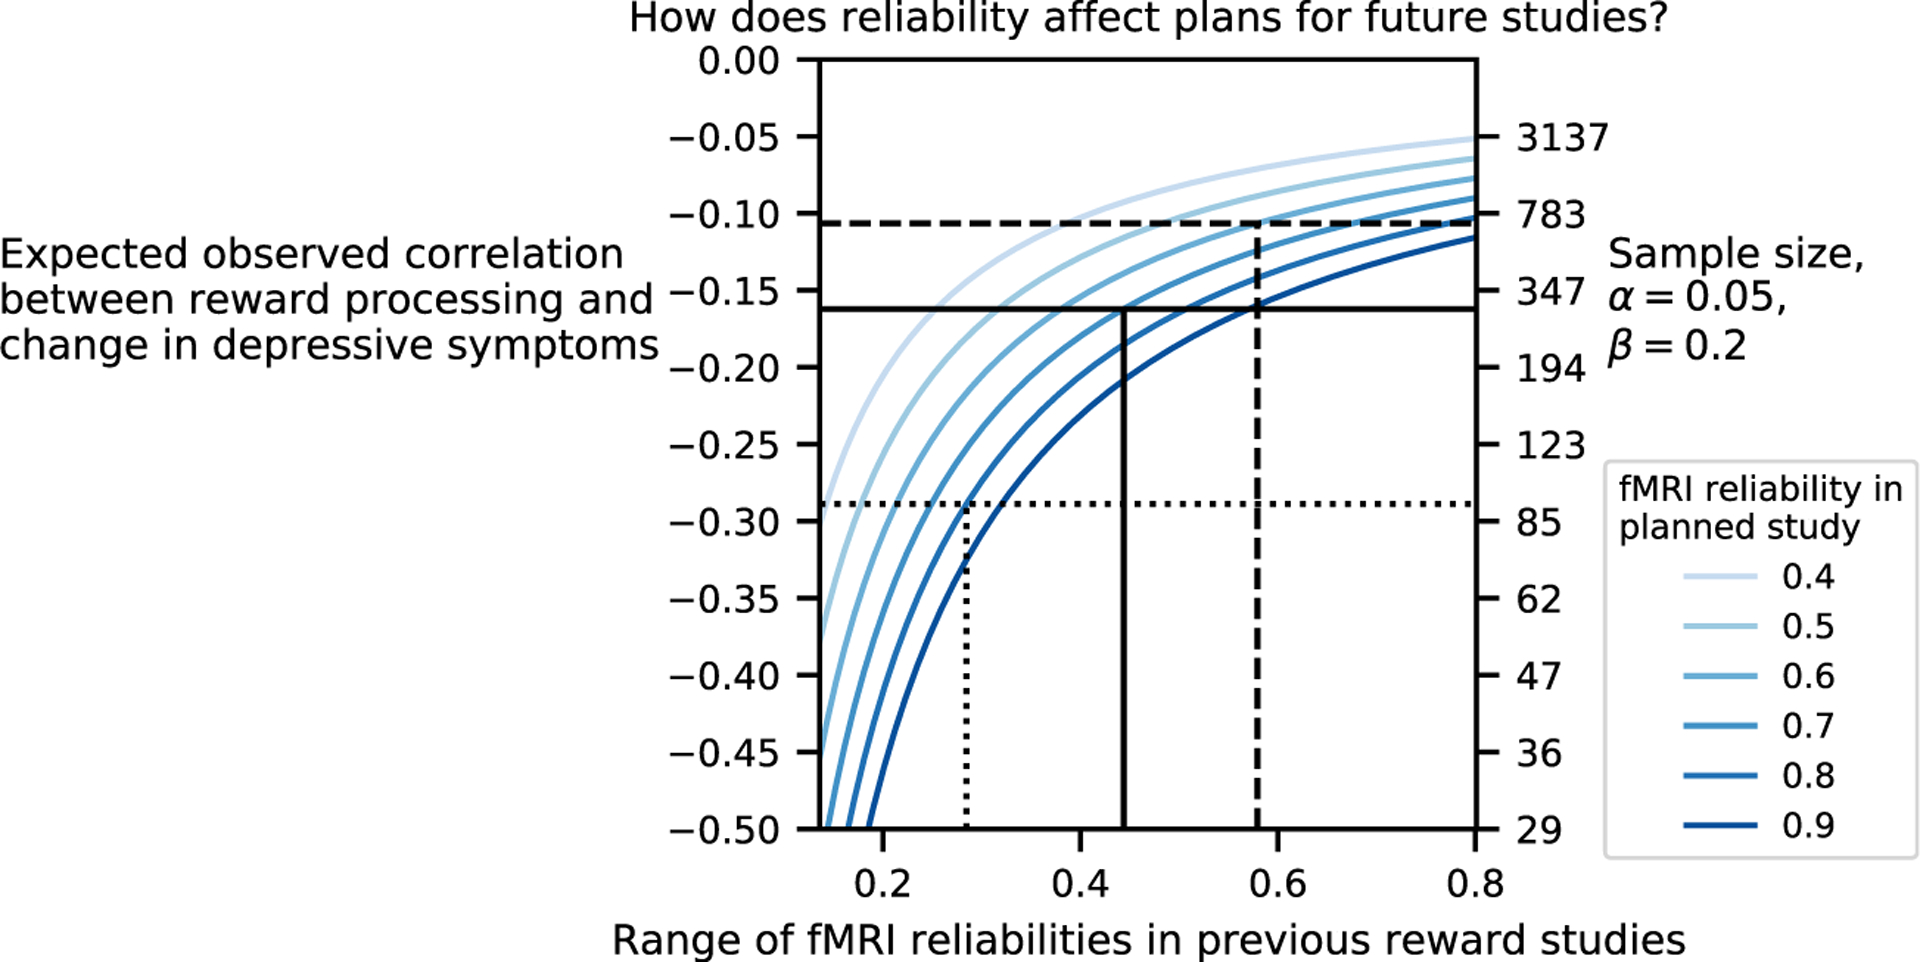
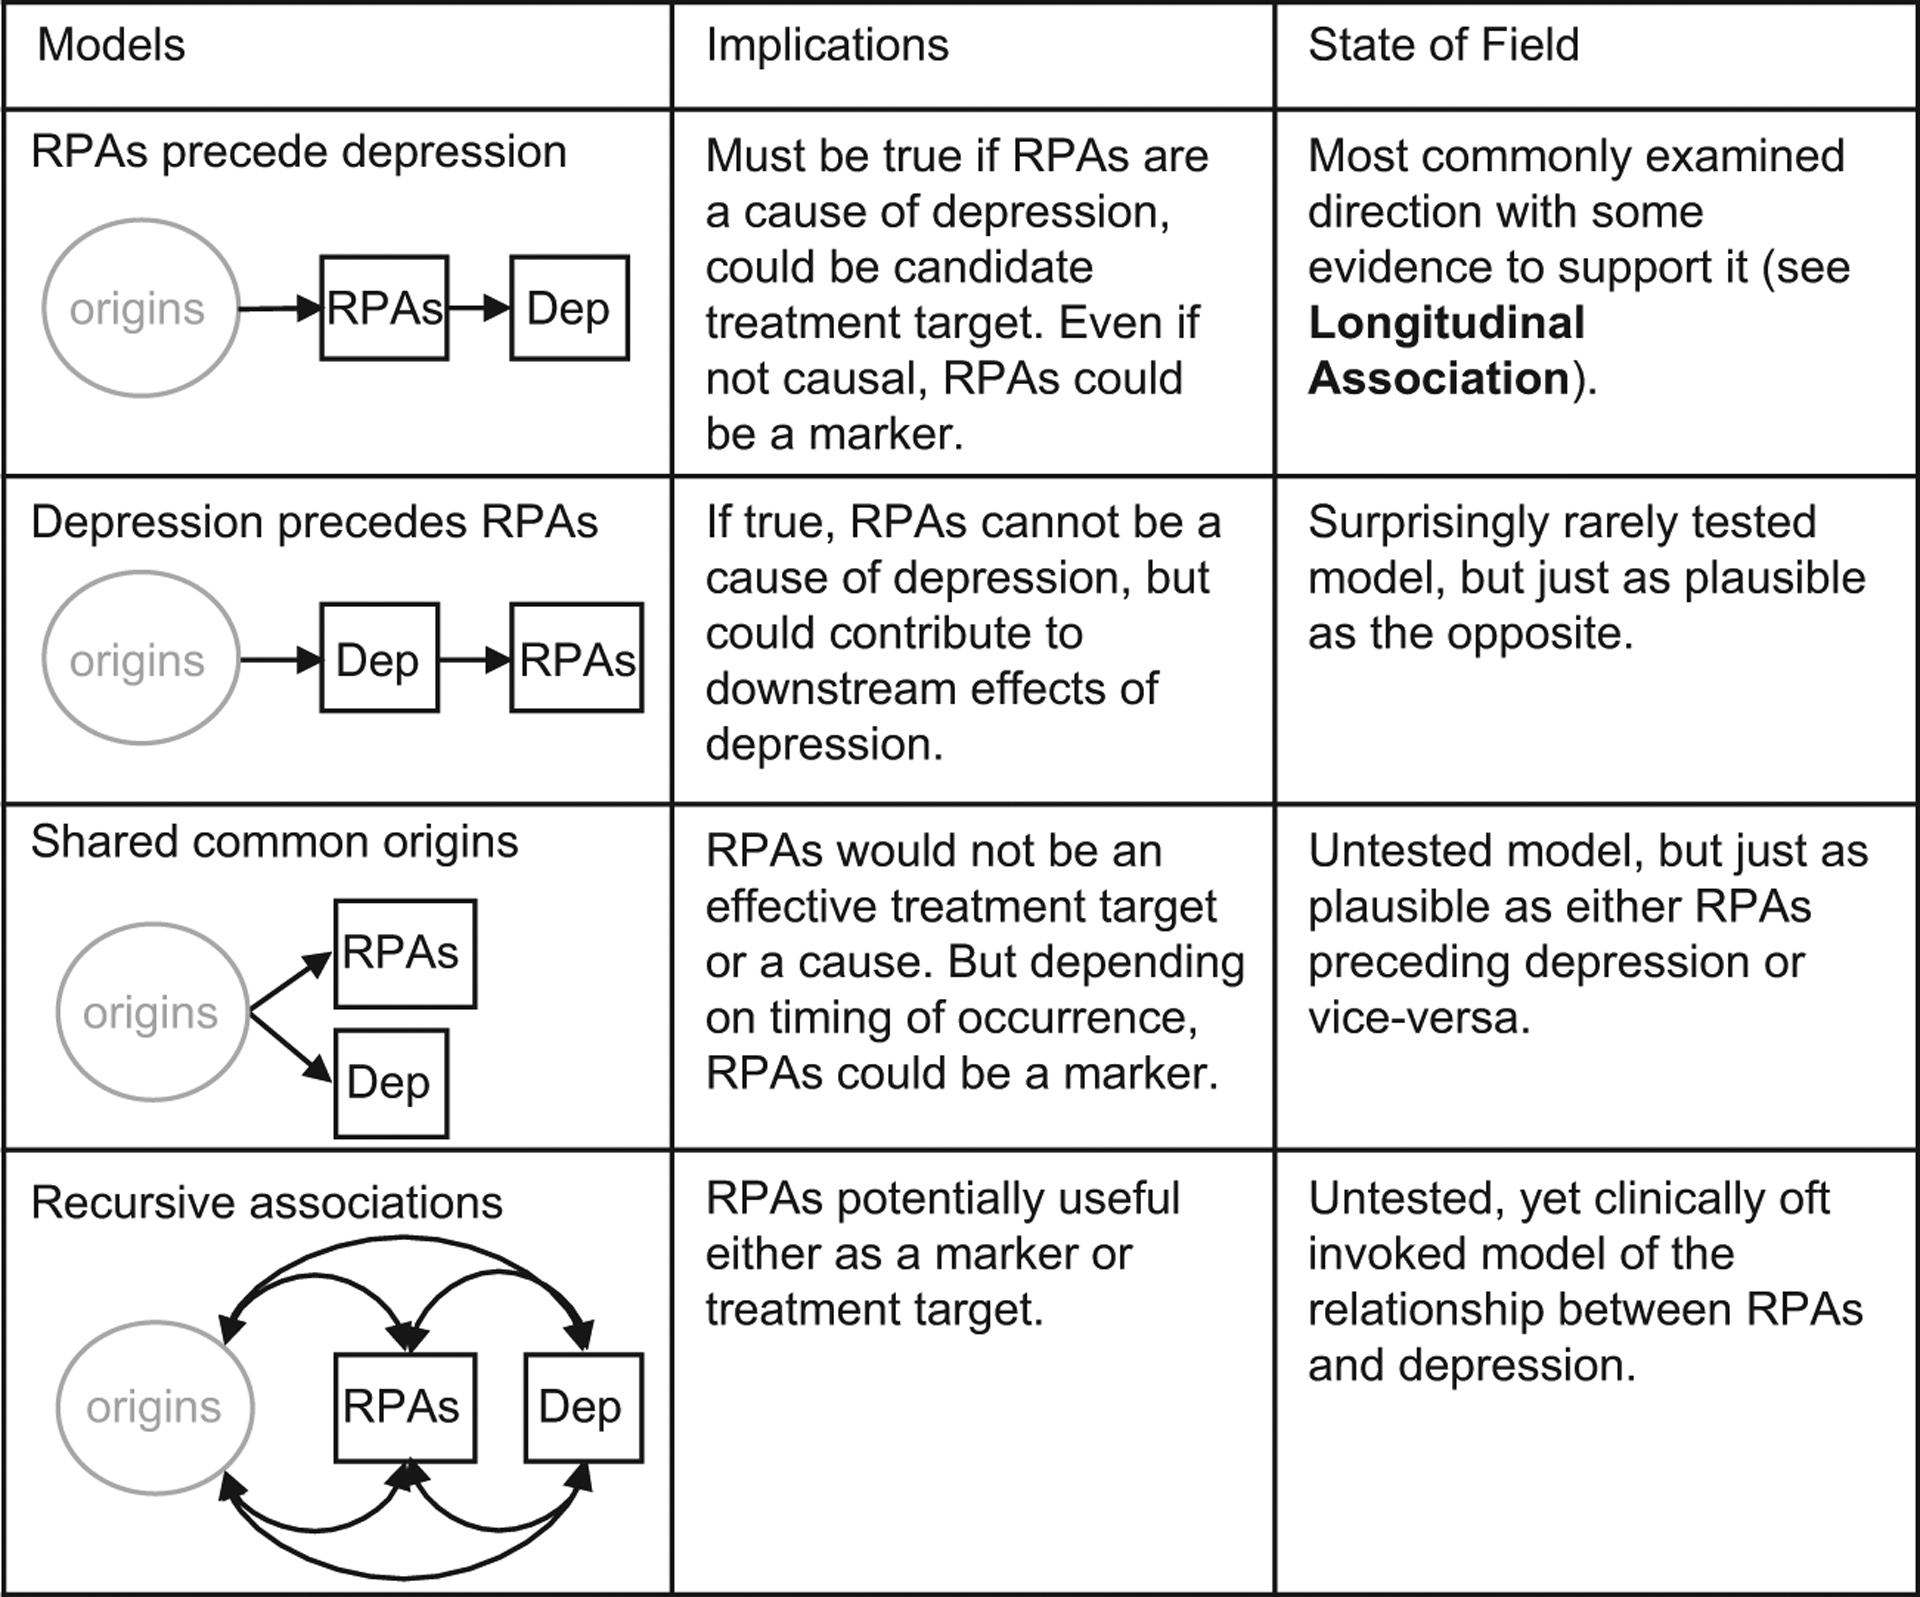
Both human and animal studies support the relationship between depression and reward processing abnormalities, giving rise to the expectation that neural signals of these processes may serve as biomarkers or mechanistic treatment targets. Given the great promise of this research line, we scrutinized those findings and the theoretical claims that underlie them. To achieve this, we applied the framework provided by classical work on causality as well as contemporary approaches to prediction. We identified a number of conceptual, practical, and analytical challenges to this line of research and used a preregistered meta-analysis to quantify the longitudinal associations between reward processing abnormalities and depression. We also investigated the impact of measurement error on reported data. We found that reward processing abnormalities do not reach levels that would be useful for clinical prediction, yet the available evidence does not preclude a possible causal role in depression.

Keywords: Depression; Development; Meta-analysis; Reliability; Reproducibility; Reward processing.


Figures

Figure 1.
Figure 1.
Comparison of coordinate based meta-analyses by Ng et al. (5), Keren et al. (1), and Zhang et al. (6). Results from Ng et al. are in red, results from Keren et al. are in green, and results from Zhang et al. are in blue. Areas of overlap are indicated by additive mixture of the colors in (A), (B), and (D). Results of comparable analyses are consistent in identifying the ventral striatum and caudate as regions that differ during the execution of reward processing tasks between healthy volunteers and participants with major depressive disorder. Keren et al. (1) did not find any regions where participants with major depressive disorder showed more activity than healthy volunteers, but both Zhang et al. (6) and Ng et al. (5) found an area in the orbitofrontal cortex (A). The studies broadly agree on decreased reward responsiveness in the nucleus accumbens and caudate (B). This concordance implies that these findings are relatively robust given the differences in inclusion criteria (C) and studies (D) included in each meta-analysis. The overlapping regions in (D) indicate the number of studies in common between meta-analyses. Of particular note, Zhang et al. used a false discovery rate (FDR) for multiple comparison control, which is not as stringent as the clustering approach with a voxel level threshold of p < .001 and a cluster-level familywise error rate of .05 used by the other two meta-analyses (105). Keren et al. reported results for feedback and anticipation contrasts separately, and here we considered only the results for feedback contrasts. Studies are specified in Table S1.
Figure 2.
Figure 2.
Forest plot for random effects meta-analysis of observational functional magnetic resonance imaging (fMRI) studies reporting a striatal effect for the correlation with change in depressive symptoms. Across these studies (15,16,21,25,28,32,35), predominantly conducted in adolescents, we found that the mean effect size for similar studies was −.10 (95% confidence interval = [−.18, −.03]). In the figure, the size of the marker corresponds to study sample size. The error bars indicate the 95% confidence interval. The results in lighter blue [from Jin et al. (28)] represent unreported null effects where the effect size was imputed via the MetaNSUE method. 1Demographics reported for the entire study population, not for the subgroup on which the displayed correlation is based. excl., excluding; MDD, major depressive disorder; Obs., observational.
Figure 3.
Figure 3.
Impact of functional magnetic resonance imaging (fMRI) test–retest reliability on expected effect size and required sample size of future studies. The figure depicts the dependence of the effect size to be expected in future studies (y-axis on the left) and the sample size of future studies (y-axis on the right) on the reliability of past studies (x-axis) and the expected reliability of future studies (color-coded lines). The reliability of past studies is derived from references (–45), and the minimum and maximum values bound the x-axis. The following 3 cases are illustrated. Dotted line: If previous studies had a low reliability (.28) and our planned study will have a reliability of .80, we would expect to observe a correlation between reward processing and change in depressive symptoms of −.29 (95% confidence interval [CI] = [−.52, −.02]) and would expect a required sample size of 92 to have 80% power to detect with a two-sided test for Pearson correlation difference from 0. Solid line: If previous studies had a reliability of .44 and our planned study will increase this to .70, we would expect an observed correlation of −.16 (95% CI = [−.31, −.01]), requiring a sample size of 297. Dashed line: If previous studies had a reliability of .57 and our planned study will have a reliability of .60, we would expect an observed correlation of −.11 (95% CI = [−.21, −.01]), requiring a sample size of 690. For this figure, we assume a depressive symptom measurement reliability of .77 (95% CI = [.67, .84]) based on 8 studies (Table S8). If depressive symptom measurement reliability is improved in the planned study, the above observed effect sizes would be proportionally higher (Figure S8).
Figure 4.
Figure 4.
Schematic depiction of potential relationships between depression (Dep) and reward processing abnormalities (RPAs). The most commonly tested model is that RPAs precede depression, but plausible alternatives such as the reverse of this relationship or a common origin receive little attention. The recursive associations model is frequently cited in the behavioral analysis literature (–108) but has not been thoroughly tested. Datasets from many of the studies cited in the “Longitudinal Association” section could be used to assess the relative strengths of RPAs preceding depression versus depression preceding RPAs. In the schematics, “origins” indicates an unspecified combination of genetic and environmental factors. This is by no means a depiction of every possible model; mediating and moderating relationships, for example, are not depicted.

References

    1. Keren H, O’Callaghan G, Vidal-Ribas P, Buzzell GA, Brotman MA, Leibenluft E, et al. (2018): Reward processing in depression: A conceptual and meta-analytic review across fMRI and EEG studies. Am J Psychiatry 175:1111–1120. - PMC - PubMed
    1. Haber SN (2011): Neuroanatomy of reward: A view from the ventral striatum. In: Gottfried JA, editor. Neurobiology of Sensation and Reward. Boca Raton, FL: CRC Press/Taylor & Francis, 235–261. - PubMed
    1. Ferenczi EA, Zalocusky KA, Liston C, Grosenick L, Warden MR, Amatya D, et al. (2016): Prefrontal cortical regulation of brainwide circuit dynamics and reward-related behavior. Science 351:aac9698. - PMC - PubMed
    1. Alexander L, Gaskin PLR, Sawiak SJ, Fryer TD, Hong YT, Cockcroft GJ, et al. (2019): Fractionating blunted reward processing characteristic of anhedonia by over-activating primate subgenual anterior cingulate cortex. Neuron 101:307–320.e6. - PMC - PubMed
    1. Ng TH, Alloy LB, Smith DV (2019): Meta-analysis of reward processing in major depressive disorder reveals distinct abnormalities within the reward circuit. Transl Psychiatry 9:293. - PMC - PubMed