. 2020 Aug 21;23(8):101424.
doi: 10.1016/j.isci.2020.101424. Epub 2020 Jul 30.

GPCR Genes as Activators of Surface Colonization Pathways in a Model Marine Diatom

Affiliations

GPCR Genes as Activators of Surface Colonization Pathways in a Model Marine Diatom

Weiqi Fu et al. iScience. .

Abstract

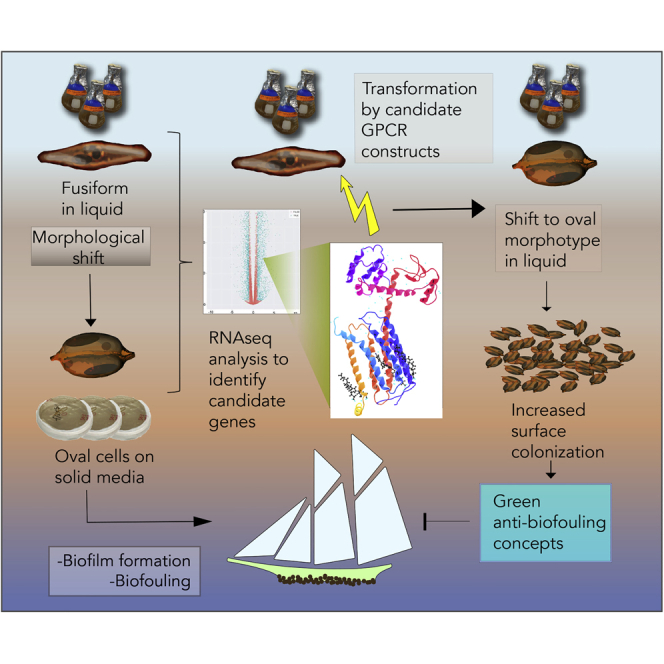
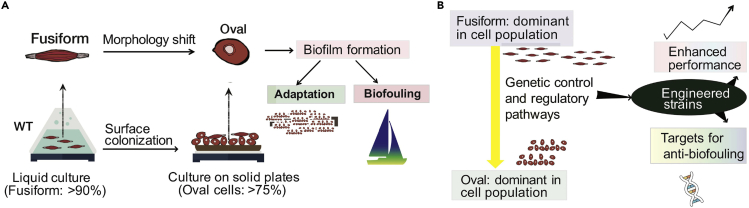
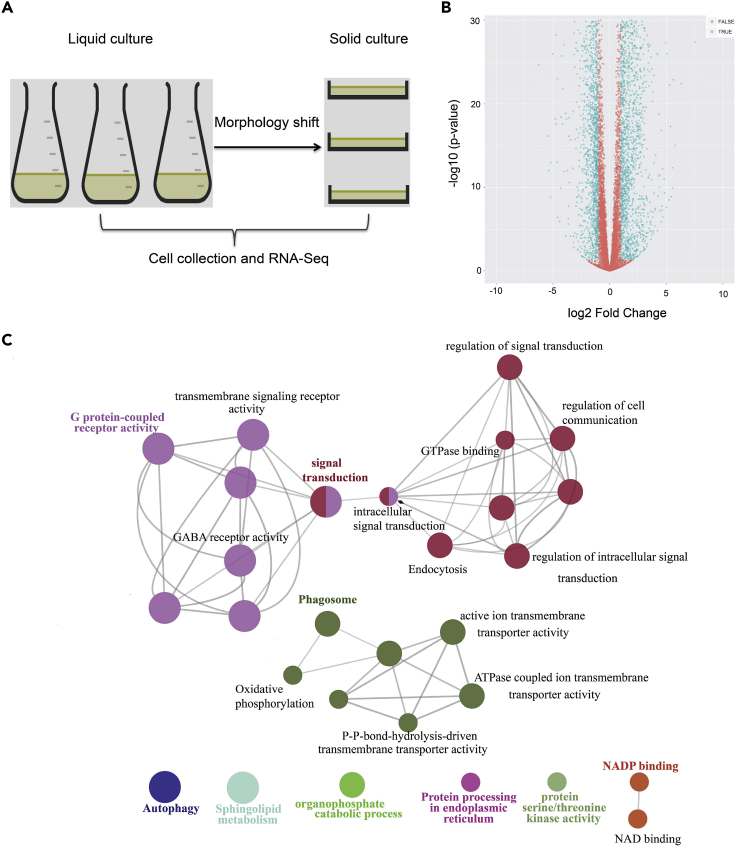
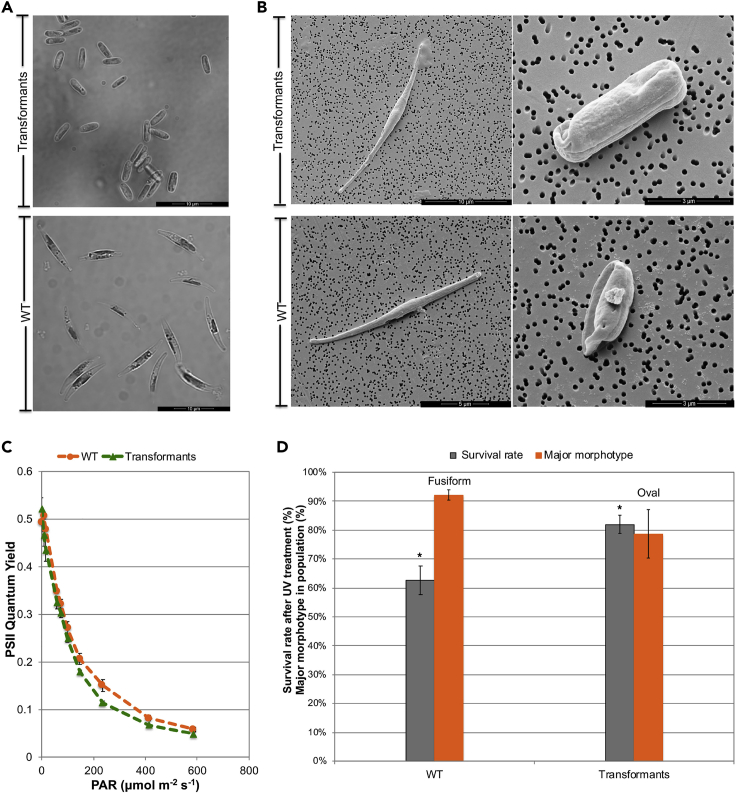
Surface colonization allows diatoms, a dominant group of phytoplankton in oceans, to adapt to harsh marine environments while mediating biofoulings to human-made underwater facilities. The regulatory pathways underlying diatom surface colonization, which involves morphotype switching in some species, remain mostly unknown. Here, we describe the identification of 61 signaling genes, including G-protein-coupled receptors (GPCRs) and protein kinases, which are differentially regulated during surface colonization in the model diatom species, Phaeodactylum tricornutum. We show that the transformation of P. tricornutum with constructs expressing individual GPCR genes induces cells to adopt the surface colonization morphology. P. tricornutum cells transformed to express GPCR1A display 30% more resistance to UV light exposure than their non-biofouling wild-type counterparts, consistent with increased silicification of cell walls associated with the oval biofouling morphotype. Our results provide a mechanistic definition of morphological shifts during surface colonization and identify candidate target proteins for the screening of eco-friendly, anti-biofouling molecules.

Keywords: Genetics; Microbiology.


Conflict of interest statement

Declaration of Interests The authors declare no competing financial interests.

Figures

None
Graphical abstract
Figure 1
Figure 1
An Overview of the Morphotype Shifting of the Model Diatom P. tricornutum Associated with Surface Colonization (A) Natural cell morphology shift in diatoms as an indicator for biofilm formation. There are multiple morphotypes in P. tricornutum cultures; of these, the fusiform cells are dominant in liquid growth under non-stress conditions and the oval cells dominate benthic growth and surface colonization. Fusiform cells gradually shift to oval cells during surface colonization or when subjected to other environmental stress, before biofilm formation and biofouling. (B) By comparing gene expression profiles of different P. tricornutum morphotypes, putative regulatory pathways and gene products can be identified. The role of these candidate effectors can be validated by their expression in engineering strains. Once confirmed, the identified gene products can be used as targets in future studies to reverse the natural surface colonization process of diatoms in oceans to combat biofouling.
Figure 2
Figure 2
Global Transcriptomic Analysis and Identification of DEGs For a Figure360 author presentation of this figure, see https://doi.org/10.1016/j.isci.2020.101424. (A) Liquid culture (fusiform cells in population >90%) and solid culture (oval cells in population >75%) of the model diatom P. tricornutum Pt1 8.6F were generated and cells were collected for RNA-seq. (B) Volcano plot with p values and fold changes as log-scaled axes. DEGs are identified with a threshold of log2(fold changes) > 1 and a significance level of FDR < 0.05. Significant differences at p value < 0.05 with >2-fold changes are shown in blue color. (C) Gene set enrichment analysis of up-regulated signaling genes highlighting the GPCR signaling pathway. A group of 61 identified signaling genes was used for analysis. GO terms are represented as nodes in the graph, each pathway and its related nodes were presented with a unique color (p < 0.05), and node sizes indicate the relative numbers of genes that represent the GO term, whereas the edges represent genes shared between the GO terms.
Figure 3
Figure 3
Morphological Shift in the Diatom Population and Its Characteristics (A) Bright-field microscopic images showing the dominant morphotypes in the GPCR1A transformants when compared with the wild-type (WT). (B) Scanning electron microscopic images of different morphotypes in transformants and WT. (C) Determination of the theoretical photosynthetic efficiency (Fv/Fm) and effective quantum yield (QY) of photosystem II under a light intensity of 220 μmol photons m−2 s−1. (D) Enhanced cell resistance to UV radiation in transformants (with oval cells at >75% of the population) when compared with the wild type (with oval cells at <10% of the population). Values were averaged from either two or three independent experiments. WT, wild-type; PAR, photosynthetically active radiation. Error bars indicate SEM. ∗ Indicates statistical significance between the groups (p < 0.05).
Figure 4
Figure 4
Comparative Analysis of Gene Expression Profiles upon Morphological Shift in Engineered and Wild-Type Strains (A) Venn diagram of shared and unique genes between transformants-derived and solid culture condition-derived DEGs. (B) Gene ontology analysis of the shared, up-regulated DEGs showing the significantly enriched (p < 0.05) terms shared between transformants-derived and solid culture condition-derived morphological shift from fusiform to oval cells. (C) Gene ontology analysis of the signaling genes (a subset of up-regulated DEGs in the transformants) highlighting the significant enrichment of GPCR-related signaling pathways.
Figure 5
Figure 5
Differential Expression of Transcription Factors (A and B) The expression of transcription factors (TFs) was compared between wild-type (WT) cells grown on solid medium and in liquid (A) and between GPCR1A transformants grown in liquid culture and WT cells grown in liquid (B). The bar graphs represent TF families and their genes with their expression level shown as log2 of their fold change. TF annotations for the model diatom P. tricornutum were obtained from https://phycocosm.jgi.doe.gov/mycocosm/annotations/browser/transfactor/summary;zEFxC9?p=Phatr2.
Figure 6
Figure 6
A Reconstructed Putative Signaling Network Involved in Surface Colonization The P. tricornutum signaling network reconstruction was done using information obtained from KAAS (KEGG Automatic Annotation Server), as well as through manual curation. Annotations were obtained by performing BLAST and assigning orthologs by the BBH (bidirectional best hit) method, against the manually curated KEGG GENES database. Compounds are indicated within circles: AMP, 5′-adenosine monophosphate; Ca2+, calcium cation; cAMP, cyclic AMP; DAG, diacylglycerol; PA, phosphatidic acid. Proteins are indicated in square-shaped boxes: 14-3-3, 14-3-3 protein epsilon; AC, adenylate cyclase 1; ACC1, acetyl-CoA carboxylase/biotin carboxylase 1; ARF-EF, ARF guanyl-nucleotide exchange factor; ATG, autophagy-related protein; ATM, serine-protein kinase ATM; ATR, serine/threonine-protein kinase ATR; CBP, E1A/CREB-binding protein; CytC, cytochrome c; DAGK, diacylglycerol kinase; GABARAP, GABA(A) receptor-associated protein; GATOR, GATOR complex protein; GPCR, G-protein-coupled receptor; HMGR, hydroxymethylglutaryl-CoA reductase; HSP70, heat shock 70-kDa protein; HSP90, heat shock 90-kDa protein; IPO7, importin-7; MOB, MOB kinase activator; mTORC1, serine/threonine-protein kinase mTOR; NDUFS7, NADH dehydrogenase (ubiquinone) Fe-S protein 7; PI3K, phosphatidylinositol 3-kinase; PIRH-2, RING finger and CHY zinc finger domain-containing protein; PKA, protein kinase A; PKC, protein kinase C; PLCD, phosphatidylinositol phospholipase C, delta; PLD, phospholipase D1/2; PMCA, P-type Ca2+ transporter type 2B; SMEK, protein phosphatase 4 regulatory subunit 3; SPK, sphingosine kinase; UBCD, ubiquitin-conjugating enzyme E2 D; V-ATPase, V-type H+ -transporting ATPase. Detailed information on differentially expressed genes is included in Table S6. Solid-line arrows represented direct transduction between two proteins/compounds, whereas dashed-line arrows indicated multiple steps of transduction between two proteins/compounds. The coloring of the lines was done to enhance the diagram. Blue-colored text indicated that the genes encoding the proteins were up-regulated in solid wild-type (WT) culture compared with liquid WT culture, yellow-colored boxes represented the genes encoding the proteins that were up-regulated in liquid transformants culture compared with liquid WT culture; the gene expression information is based on whole-transcriptome analysis carried out in this study.

Similar articles

Cited by

References

    1. Aguirre L.E., Ouyang L.Q., Elfwing A., Hedblom M., Wulff A., Inganas O. Diatom frustules protect DNA from ultraviolet light. Sci. Rep. 2018;8:5138. - PMC - PubMed
    1. Baio J.E., Zane A., Jaeger V., Roehrich A.M., Lutz H., Pfaendtner J., Drobny G.P., Weidner T. Diatom mimics: directing the formation of biosilica nanoparticles by controlled folding of lysine-leucine peptides. J. Am. Chem. Soc. 2014;136:15134–15137. - PMC - PubMed
    1. Basson M.A. Signaling in cell differentiation and morphogenesis. Cold Spring Harb. Perspect. Biol. 2012;4:a008151. - PMC - PubMed
    1. Basu S., Patil S., Mapleson D., Russo M.T., Vitale L., Fevola C., Maumus F., Casotti R., Mock T., Caccamo M. Finding a partner in the ocean: molecular and evolutionary bases of the response to sexual cues in a planktonic diatom. New Phytol. 2017;215:140–156. - PMC - PubMed
    1. Benoiston A.S., Ibarbalz F.M., Bittner L., Guidi L., Jahn O., Dutkiewicz S., Bowler C. The evolution of diatoms and their biogeochemical functions. Philos. T R. Soc. B. 2017;372:20160397. - PMC - PubMed