. 2020 Sep:59:102923.
doi: 10.1016/j.ebiom.2020.102923. Epub 2020 Aug 13.

Molecular correlates of sensitivity to PARP inhibition beyond homologous recombination deficiency in pre-clinical models of colorectal cancer point to wild-type TP53 activity

Affiliations

Molecular correlates of sensitivity to PARP inhibition beyond homologous recombination deficiency in pre-clinical models of colorectal cancer point to wild-type TP53 activity

Jørgen Smeby et al. EBioMedicine. 2020 Sep.

Abstract

Background: PARP inhibitors are active in various tumour types beyond BRCA-mutant cancers, but their activity and molecular correlates in colorectal cancer (CRC) are not well studied.

Methods: Mutations and genome-wide mutational patterns associated with homologous recombination deficiency (HRD) were investigated in 255 primary CRCs with whole-exome sequencing and/or DNA copy number data. Efficacy of five PARP inhibitors and their molecular correlates were evaluated in 93 CRC cell lines partly annotated with mutational-, DNA copy number-, and/or gene expression profiles. Post-treatment gene expression profiling and specific protein expression analyses were performed in two pairs of PARP inhibitor sensitive and resistant cell lines.

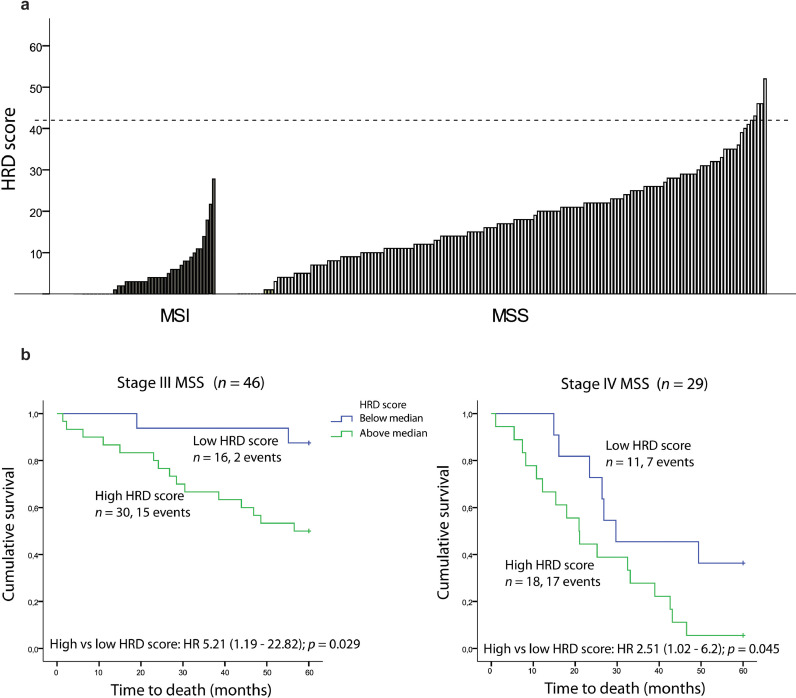
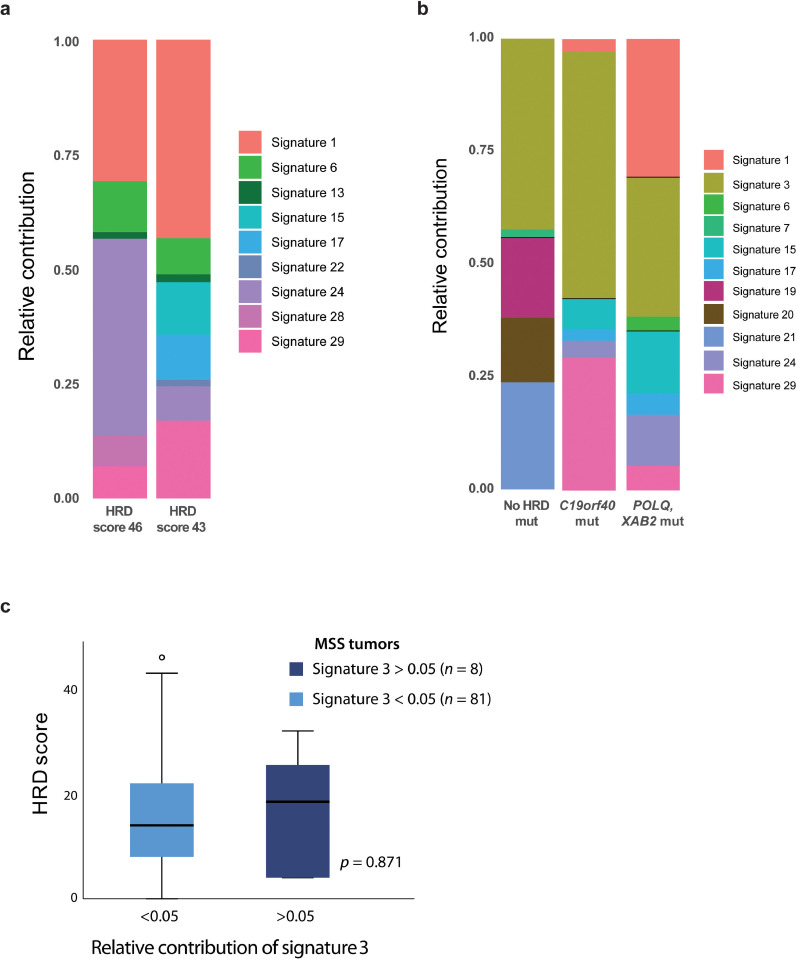
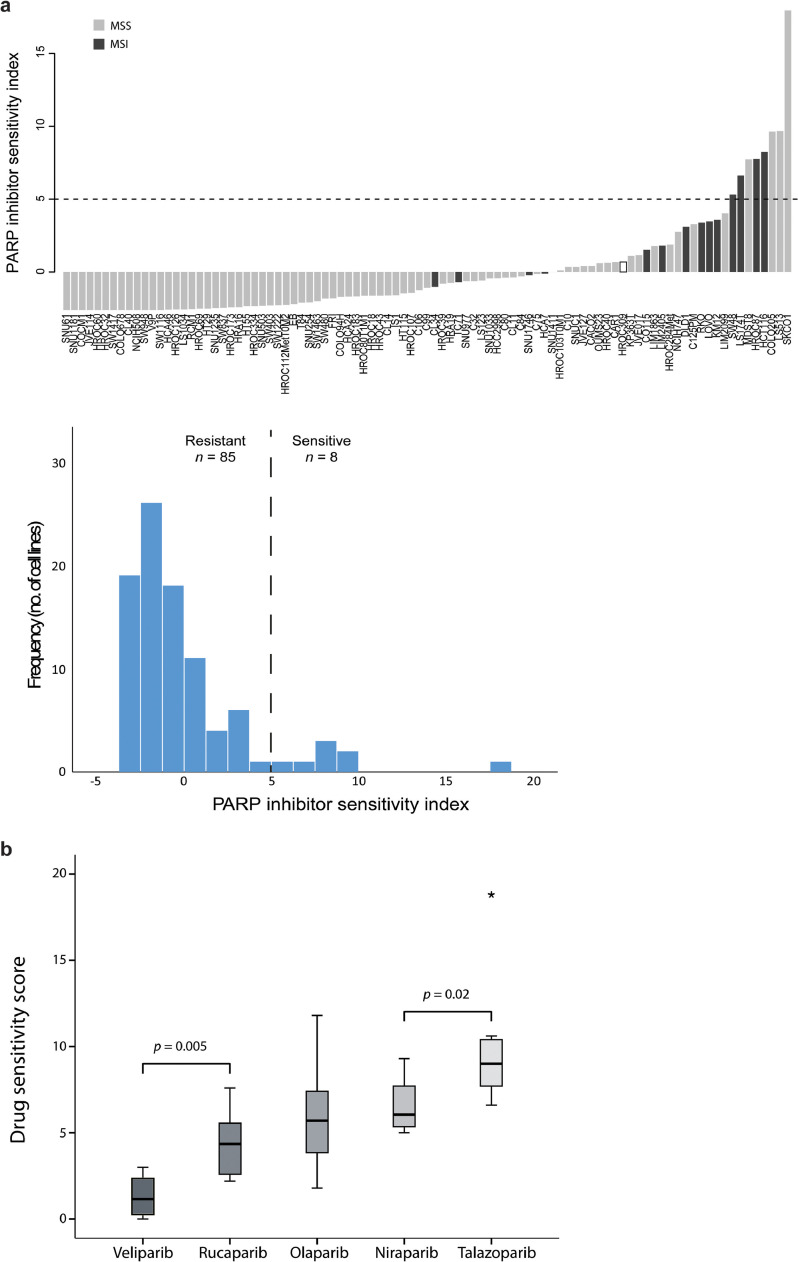
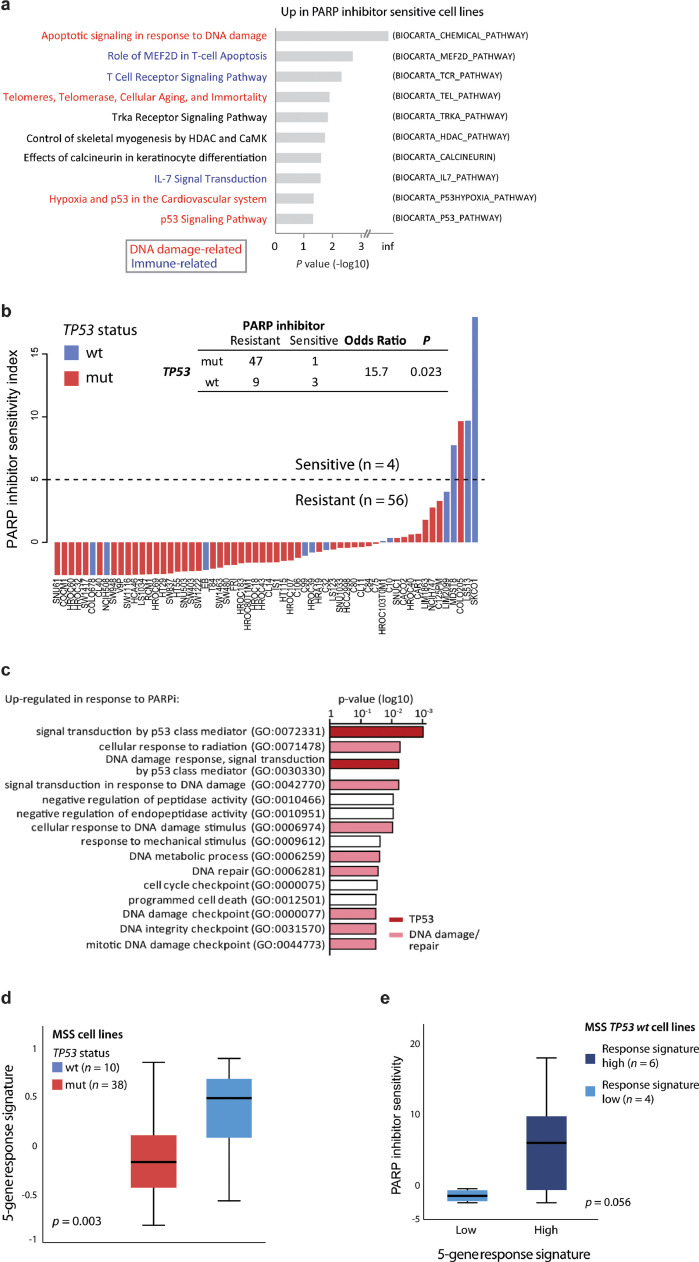
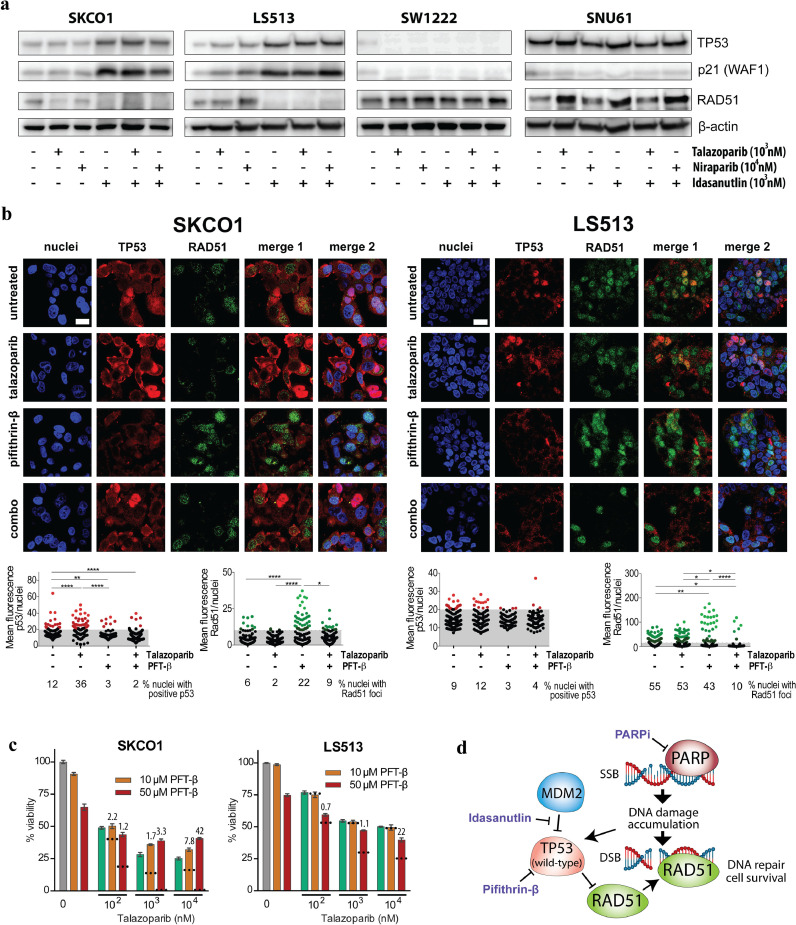
Findings: A subset of microsatellite stable (MSS) CRCs had truncating mutations in homologous recombination-related genes, but these were not associated with genomic signatures of HRD. Eight CRC cell lines (9%) were sensitive to PARP inhibition, but sensitivity was not predicted by HRD-related genomic and transcriptomic signatures. In contrast, drug sensitivity in MSS cell lines was strongly associated with TP53 wild-type status (odds ratio 15.7, p = 0.023) and TP53-related expression signatures. Increased downstream TP53 activity was among the primary response mechanisms, and TP53 inhibition antagonized the effect of PARP inhibitors. Wild-type TP53-mediated suppression of RAD51 was identified as a possible mechanism of action for sensitivity to PARP inhibition.

Interpretation: PARP inhibitors are active in a subset of CRC cell lines and preserved TP53 function may increase the likelihood of response.

Keywords: Colorectal cancer; PARP inhibition; RAD51; TP53; gene expression; homologous recombination deficiency; mutational signatures.


Conflict of interest statement

The authors declare no competing interests.

Figures

Fig 1
Fig. 1
HRD scores and their prognostic impact in primary colorectal cancers. a DNA copy number-based HRD scores in 199 primary tumours, split according to MSI status. Dashed horizontal line marks HRD score ≥ 42 used as threshold for homologous recombination deficiency in previous non-CRC publications. b Kaplan-Meier survival curves showing five-year overall survival (OS) in patients with MSS tumours with high (above median) and low HRD scores (below median) in stage III (left panel) and stage IV (right panel).
Fig 2
Fig. 2
Base substitution mutational signatures in primary colorectal cancers. a Relative contribution of the various base substitution mutational signatures (as designated in COSMIC and described by Alexandrov et al.) in the two samples with HRD scores ≥ 42 and available whole-exome sequencing data. b Relative contribution of mutational signatures in the three samples where signature 3 was most dominant. One sample harboured a frameshift mutation in POLQ and a missense mutation in XAB2 with mutant allele fractions of 0.30 and 0.66, respectively. Another sample had a missense mutation in C19orf40 with a mutant allele fraction of 0.21, while no mutations in homologous recombination-related genes were detected in the last sample. None of these three tumours had DNA copy number data and HRD scores available. The frequency of different types of base substitutions for Fig. 3a and b is shown in Supplementary Fig. S2a–b. c Comparison of HRD scores in MSS tumours according to relative contribution of signature 3. P value from independent samples t-test.
Fig 3
Fig. 3
PARP inhibitor drug sensitivity scores per cell line. a Barplot with cell lines ordered according to a PARP inhibitor sensitivity index (the sum of the standardized drug sensitivity score for four PARP inhibitors with veliparib excluded due to low activity/low correlation). Dashed horizontal line indicates value used for dichotomy in downstream analyses. Samples are coloured according to MSI-status (dark grey: MSI; grey: MSS; white: unknown). Histogram shows distribution of PARP inhibitor drug sensitivity scores among 93 cell lines. b Comparison of potency of the five PARP inhibitors based on drug sensitivity scores in the eight cell lines classified as PARP inhibitor sensitive. P values are from paired-samples t-tests.
Fig 4
Fig. 4
PARP inhibitor sensitivity is associated with TP53 activity. a Gene set enrichment analysis comparing PARP inhibitor resistant (n = 53) and sensitive (n = 4) colorectal cancer cell lines. Only microsatellite stable cell lines are included. Gene sets from BioCarta. The ten most upregulated gene sets in PARP inhibitor sensitive cell lines are shown, ranked according to p values (log10-scale). b Barplot shows summed standardized PARP inhibitor drug sensitivity scores per cell line, ranked according to drug sensitivity and coloured according to TP53 mutation status. Dashed horizontal line indicates value used for dichotomy in downstream analyses. Only MSS cell lines with known TP53 mutation status are included (n = 60). Similar plot including MSI cell lines is shown in Supplementary Fig. S3A. c Gene set enrichment analysis of genes associated with PARP inhibitor response. Analysis based on genes upregulated (paired limma-analysis) in PARP inhibitor sensitive cell lines (SKCO1 and LS513) after treatment with talazoparib compared to DMSO (control). d Five-gene response signature (GDF15, PLK2, MDM2, TP53INP1, RRM2B) according to TP53 mutation status in untreated MSS cell lines. e Comparison of PARP inhibitor sensitivity scores in MSS TP53 wild-type (wt) cell lines split according to the 5-gene response signature. Samples are dichotomized according to high or low gene response signature using a threshold of 0.3, reflecting the largest discontinuity in the distribution of response signature values. P value from Welch's t-test.
Fig 5
Fig. 5
TP53 activation and regulation of RAD51 after PARP inhibition. a Western Blot analyses of TP53, p21 and RAD51 in PARP inhibitor sensitive (SKCO1 and LS513) and resistant cell lines (SW1222 and SNU61) after treatment with talazoparib, niraparib and idasanutlin for 48 h. b Representative images of TP53 expression and RAD51 foci analysed with fluorescence microscopy after 48 h treatment with 1 µM talazoparib, 50 µM pifithrin-β (PFT-β) or combination of the two. Scale bar = 20 µm. Scatter dot plots below depict analysed TP53- (red) and RAD51 (green) mean fluorescence per nuclei for the indicated treatment and cell lines, respectively. For statistical analyses, one-way ANOVA multiple comparison test with Tukey post correction was performed (****p < 0.0001, **p < 0.005, *p < 0.05). Each dot represents mean fluorescence in one nuclei and grey area indicates analysed nuclei (black) with no TP53 or RAD51 expression. c Viability of SKCO1 and LS513 cell lines after 72 h combination treatment with talazoparib and PFT-β. Values given are means ± standard error of the mean. Dotted lines indicate the predicted additive effect calculated as the sum of mean inhibitory effects from single drugs. Values above the bars for combination treatments indicate combination indexes (CI). CI < 1, CI = 1 or CI > 1 represent synergism, additive and antagonistic effects, respectively. d Schematic depiction of TP53 and RAD51 involvement after PARP inhibition in TP53 wild-type cell lines.

References

    1. Bray F, Ferlay J, Soerjomataram I, Siegel RL, Torre LA, Jemal A. Global cancer statistics 2018: GLOBOCAN estimates of incidence and mortality worldwide for 36 cancers in 185 countries. CA Cancer J Clin. 2018;68(6):394–424. - PubMed
    1. Van Cutsem E, Cervantes A, Adam R, Sobrero A, Van Krieken JH, Aderka D. ESMO consensus guidelines for the management of patients with metastatic colorectal cancer. Ann Oncol. 2016;27(8):1386–1422. - PubMed
    1. Mirza MR, Monk BJ, Herrstedt J, Oza AM, Mahner S, Redondo A. Niraparib Maintenance Therapy in Platinum-Sensitive, Recurrent Ovarian Cancer. N Engl J Med. 2016;375(22):2154–2164. - PubMed
    1. Robson M, Im SA, Senkus E, Xu B, Domchek SM, Masuda N. Olaparib for metastatic breast cancer in patients with a germline BRCA mutation. N Engl J Med. 2017;377(6):523–533. - PubMed
    1. Mateo J, Carreira S, Sandhu S, Miranda S, Mossop H, Perez-Lopez R. DNA-repair defects and olaparib in metastatic prostate cancer. N Engl J Med. 2015;373(18):1697–1708. - PMC - PubMed

MeSH terms

Substances