. 2020 Dec;22(12):e13250.
doi: 10.1111/cmi.13250. Epub 2020 Sep 28.

Synchronised infection identifies early rate-limiting steps in the hepatitis B virus life cycle

Affiliations

Synchronised infection identifies early rate-limiting steps in the hepatitis B virus life cycle

Anindita Chakraborty et al. Cell Microbiol. 2020 Dec.

Abstract

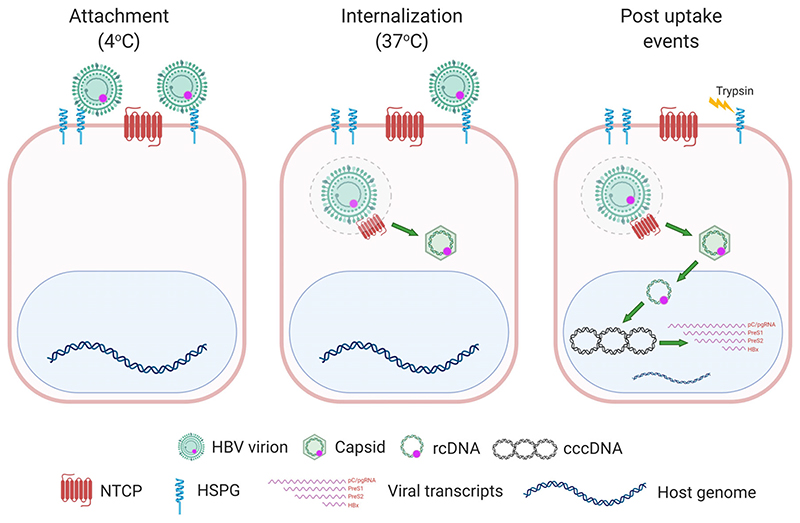
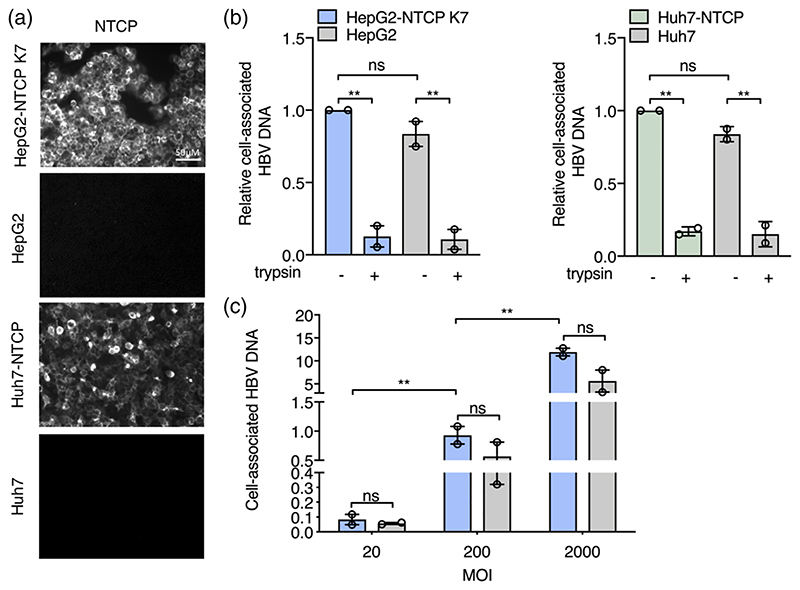
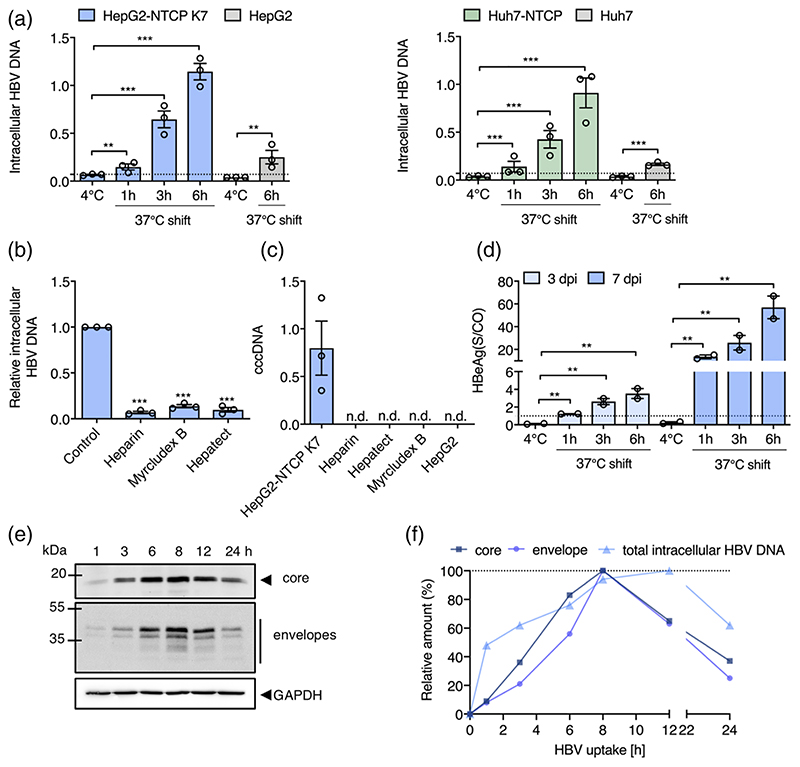
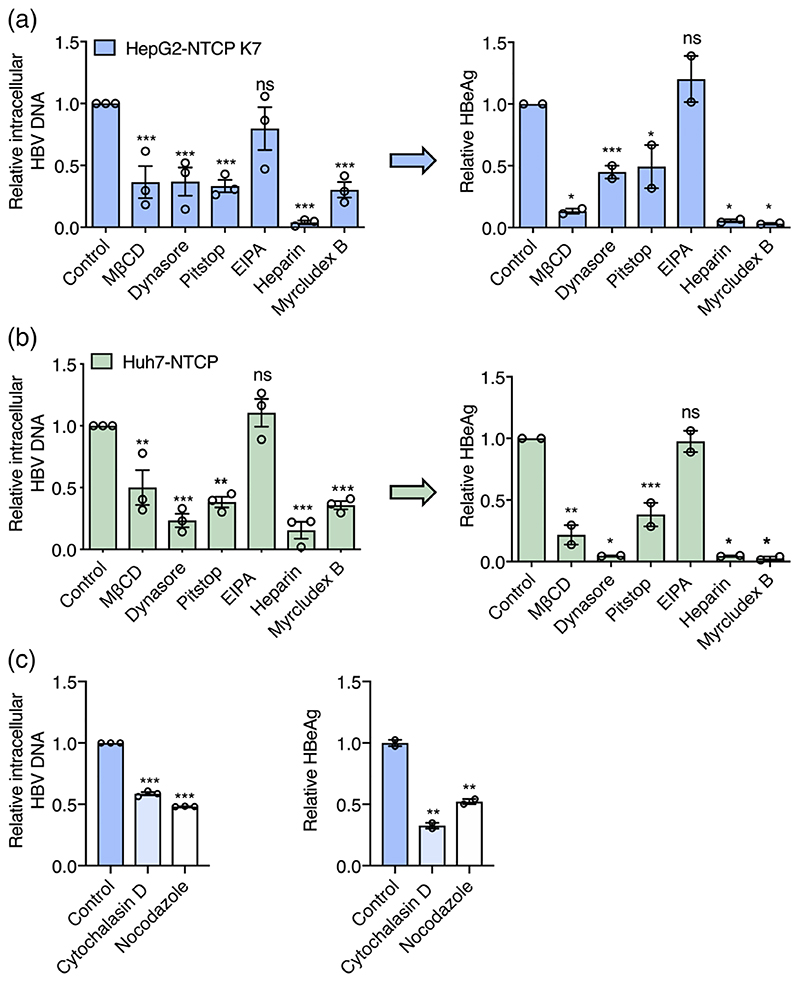
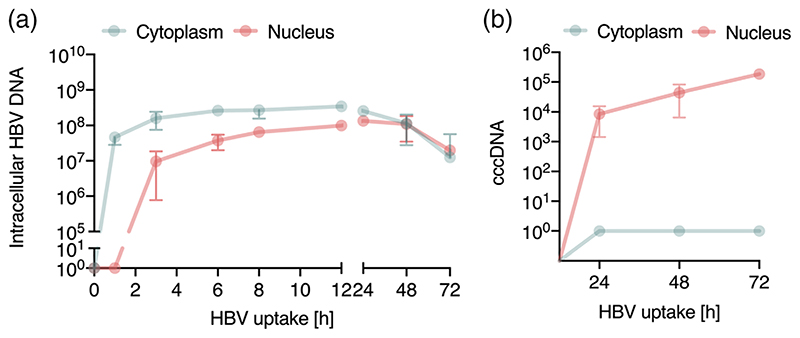
Hepatitis B virus (HBV) is an enveloped DNA virus that contains a partially double-stranded relaxed circular (rc) DNA. Upon infection, rcDNA is delivered to the nucleus where it is repaired to covalently closed circular (ccc) DNA that serves as the transcription template for all viral RNAs. Our understanding of HBV particle entry dynamics and host pathways regulating intracellular virus trafficking and cccDNA formation is limited. The discovery of sodium taurocholate co-transporting peptide (NTCP) as the primary receptor allows studies on these early steps in viral life cycle. We employed a synchronised infection protocol to quantify HBV entry kinetics. HBV attachment to cells at 4°C is independent of NTCP, however, subsequent particle uptake is NTCP-dependent and reaches saturation at 12 h post-infection. HBV uptake is clathrin- and dynamin dependent with actin and tubulin playing a role in the first 6 h of infection. Cellular fractionation studies demonstrate HBV DNA in the nucleus within 6 h of infection and cccDNA was first detected at 24 h post-infection. Our studies show the majority (83%) of cell bound particles enter HepG2-NTCP cells, however, only a minority (<1%) of intracellular rcDNA was converted to cccDNA, highlighting this as a rate-limiting in establishing infection in vitro. This knowledge highlights the deficiencies in our in vitro cell culture systems and will inform the design and evaluation of physiologically relevant models that support efficient HBV replication.

Keywords: hepatitis B; kinetics; virus internalisation.


Conflict of interest statement

Conflict of Interest

The authors declare no potential conflict of interest.

Figures

Figure 1
Figure 1. Cartoon depicting a synchronised HBV infection protocol.
Pre-chilled cells were inoculated with HBV for 1 h and cells moved to 37°C, leading to synchronous internalisation of viral particles. At various times the cells are treated with trypsin to remove cell-associated non-internalised viral particles and viral parameters quantified
Figure 2
Figure 2. Quantifying HBV attachment to target cells.
(a) HBV attachment to HepG2 cells is NTCP independent. HepG2-NTCP K7 and Huh7-NTCP along with parental cells were stained for NTCP expression using Atto488 labelled Myrcludex B (200 nM) and imaged using 63× objective (scale bars indicate 20 μm). (b) Pre-chilled HepG2, HepG2-NTCP K7 cells, Huh-7 and Huh7-NTCP were inoculated with HBV (MOI 200) for 1 h on ice, unbound virus removed by washing and cells treated with trypsin or left untreated and cell-associated HBV DNA quantified by RT-PCR. Data is expressed relative untreated HepG2-NTCP cells. (c) HBV attachment to HepG2 cells is dose-dependent. Increasing dose of HBV (MOI 20-2000) was inoculated with HepG2-NTCP K7 and HepG2 cells for 1 h at 4°C, unbound virus removed by washing and cell-associated HBV DNA quantified. HBV DNA levels are expressed relative to PRNP and represent two independent experiments presented as mean ± standard error of the mean (SEM). Each experiment consisted of three replicates per condition. Statistical analysis was performed using a Mann–Whitney U test (*p < .05, **p < .01, ***p < .001)
Figure 3
Figure 3. HBV internalisation kinetics.
(a) HBV internalisation is temperature and NTCP-dependent. HepG2 and Huh-7 hepatoma cells and those engineered to express NTCP were inoculated with HBV (MOI 200) and trypsinized after 1 h at 4°C or following incubation at 37°C for 1, 3 or 6 h. Intracellular HBV DNA levels are expressed relative to PRNP and the dotted line represents trypsinized 4°C samples that were set as background for the assay. (b) Receptor and HBV glycoprotein dependent particle internalisation. HepG2-NTCP K7 cells were inoculated with HBV (MOI 200) in the presence or absence of heparin (50 IU/mL), Myrcludex B (200 nM) or Hepatect (0.5 IU/mL) and trypsin-resistant intracellular HBV DNA copies measured after 6 h. Data are expressed relative untreated HepG2-NTCP cells. (c) Short-term synchronised HBV infection of HepG2-NTCP cells generates cccDNA. Parental HepG2 and HepG2-NTCP K7 cells were inoculated with HBV (MOI 200) as detailed above and after 6 h at 37°C cells were trypsinized and cultured at 37°C for 3 days before measuring cccDNA. Heparin (50 IU/mL), Hepatect (0.5 IU/mL) and Myrcludex B (200 nM) were included as controls. HBV cccDNA levels are expressed relative to PRNP and represent three independent experiments presented as mean ± SEM. (d) Association between internalised HBV particles and HBeAg expression. HepG2-NTCP K7 were inoculated with HBV (MOI 200) and trypsinized after 1 h at 4°C or following incubation at 37°C for 1, 3 or 6 h and the infected cells cultured for 3 or 7d before measuring extracellular HBeAg. Dotted line represents the limit of detection of the assay, where all values above 1 are considered positive. (e) HBV internalisation kinetics. HepG2-NTCP K7 cells were inoculated with HBV (MOI 200) as detailed above (a) and after defined times at 37°C the trypsinized cells were lysed and probed for HBV envelope and core proteins by western blot and images quantified by densitometry. A summary of internalisation kinetics is depicted as the amount of intracellular HBV DNA, core or envelope proteins and plotted as relative data where the highest value of the respective parameter is set to 100%. Data are representative of up to three independent experiments presented as mean ± SEM. Each experiment consisted of three replicates per condition. Statistical analysis was performed using a Mann-Whitney U test (*p < .05, **p < .01, ***p < .001), n.d: not detected
Figure 4
Figure 4
Cellular trafficking pathways exploited by HBV. HBV internalisation is clathrin and dynamin dependent. HepG2-NTCP K7 (a) or Huh7-NTCP (b) cells were treated with pharmacological agents targeting dynamin (Dynasore: 100 μM), Clathrin-mediated endocytosis (Pitstop: 50 μM) or macropinocytosis (EIPA: 100 μM) and inoculated with HBV (MOI 200) as detailed in Figure 1. Cells were pre-treated with Dynasore and Pitstop for 0.5 h prior to infection and during the HBV inoculation step. EIPA was co-treated during HBV inoculation. Trypsin-resistant intracellular HBV DNA copies after 6 h or extracellular HBeAg expression after 5 days was measured. Data are plotted relative to untreated control and represent up to three independent experiments presented as mean ± SEM. (c) HBV internalisation is actin and tubulin dependent. HepG2-NTCP cells were treated with actin and tubulin disrupting agents, Cytochalasin D and Nocodazole (50 μM each) respectively and inoculated with HBV (MOI 200). Trypsin-resistant intracellular HBV DNA after 6 h or extracellular HBeAg levels after 5 days was measured. Data are plotted relative to untreated control and represent up to three independent experiments presented as mean ± SEM. Each experiment consisted of three replicates per condition. Statistical analysis was performed using a Mann-Whitney U test (*p < .05, **p < .01, ***p < .001)
Figure 5
Figure 5. Kinetics of HBV trafficking to the nucleus.
(a) Intracellular HBV trafficking in cytoplasm and nucleus. Synchronised HBV infection (MOI 200) where cytoplasmic and nuclear samples were harvested at the indicated times. HBV DNA was first detected in cytoplasm at 1 h and in the nucleus after 3 h and monitored thereafter. Detection threshold of the qPCR lies between 10-100 copies. (b) Synchronised infection and cccDNA levels. HepG2-NTCP K7 cells were inoculated with HBV (MOI 200) as detailed above (a) and cccDNA levels in the cytoplasmic and nuclear fraction measured. Absolute numbers of total intracellular HBV DNA and cccDNA in cells/cm2 are shown. Data are representative of two independent experiments presented as mean ± SEM. Each experiment consisted of duplicates per condition. Statistical analysis was performed using a Mann-Whitney U test (*p < .05, **p < .01, ***p < .001)

References

    1. Allweiss L, Dandri M. Experimental in vitro and in vivo models for the study of human hepatitis B virus infection. Journal of Hepatology. 2016;64(1 Suppl):S17–S31. doi: 10.1016/ijhep.2016.02.012. - DOI - PubMed
    1. Arudchandran R, Brown MJ, Song JS, Wank SA, Haleem-Smith H, Rivera J. Polyethylene glycol-mediated infection of non-permissive mammalian cells with Semliki forest virus: Application to signal transduction studies. Journal of Immunological Methods. 1999;222(1-2):197–208. doi: 10.1016/s0022-1759(98)00161-6. - DOI - PubMed
    1. Asabe S, Wieland SF, Chattopadhyay PK, Roederer M, Engle RE, Purcell RH, Chisari FV. The size of the viral inoculum contributes to the outcome of hepatitis B virus infection. Journal of Virology. 2009;83(19):9652–9662. doi: 10.1128/JVI.00867-09. - DOI - PMC - PubMed
    1. Beckebaum S, Herzer K, Bauhofer A, Gelson W, DeSimone P, de Man R, et al. Tisone G. Recurrence of hepatitis B infection in liver transplant patients receiving long-term hepatitis B immunoglobulin prophylaxis. Annals of Transplantation. 2018;23:789–801. doi: 10.12659/AOT.910176. - DOI - PMC - PubMed
    1. Bissig KD, Wieland SF, Tran P, Isogawa M, Le TT, Chisari FV, Verma IM. Human liver chimeric mice provide a model for hepatitis B and C virus infection and treatment. The Journal of Clinical Investigation. 2010;120(3):924–930. doi: 10.1172/JCI40094. - DOI - PMC - PubMed

Publication types