. 2020 Aug 12;12(556):eaaz6606.
doi: 10.1126/scitranslmed.aaz6606.

Engineered PLGA microparticles for long-term, pulsatile release of STING agonist for cancer immunotherapy

Affiliations

Engineered PLGA microparticles for long-term, pulsatile release of STING agonist for cancer immunotherapy

Xueguang Lu et al. Sci Transl Med. .

Abstract

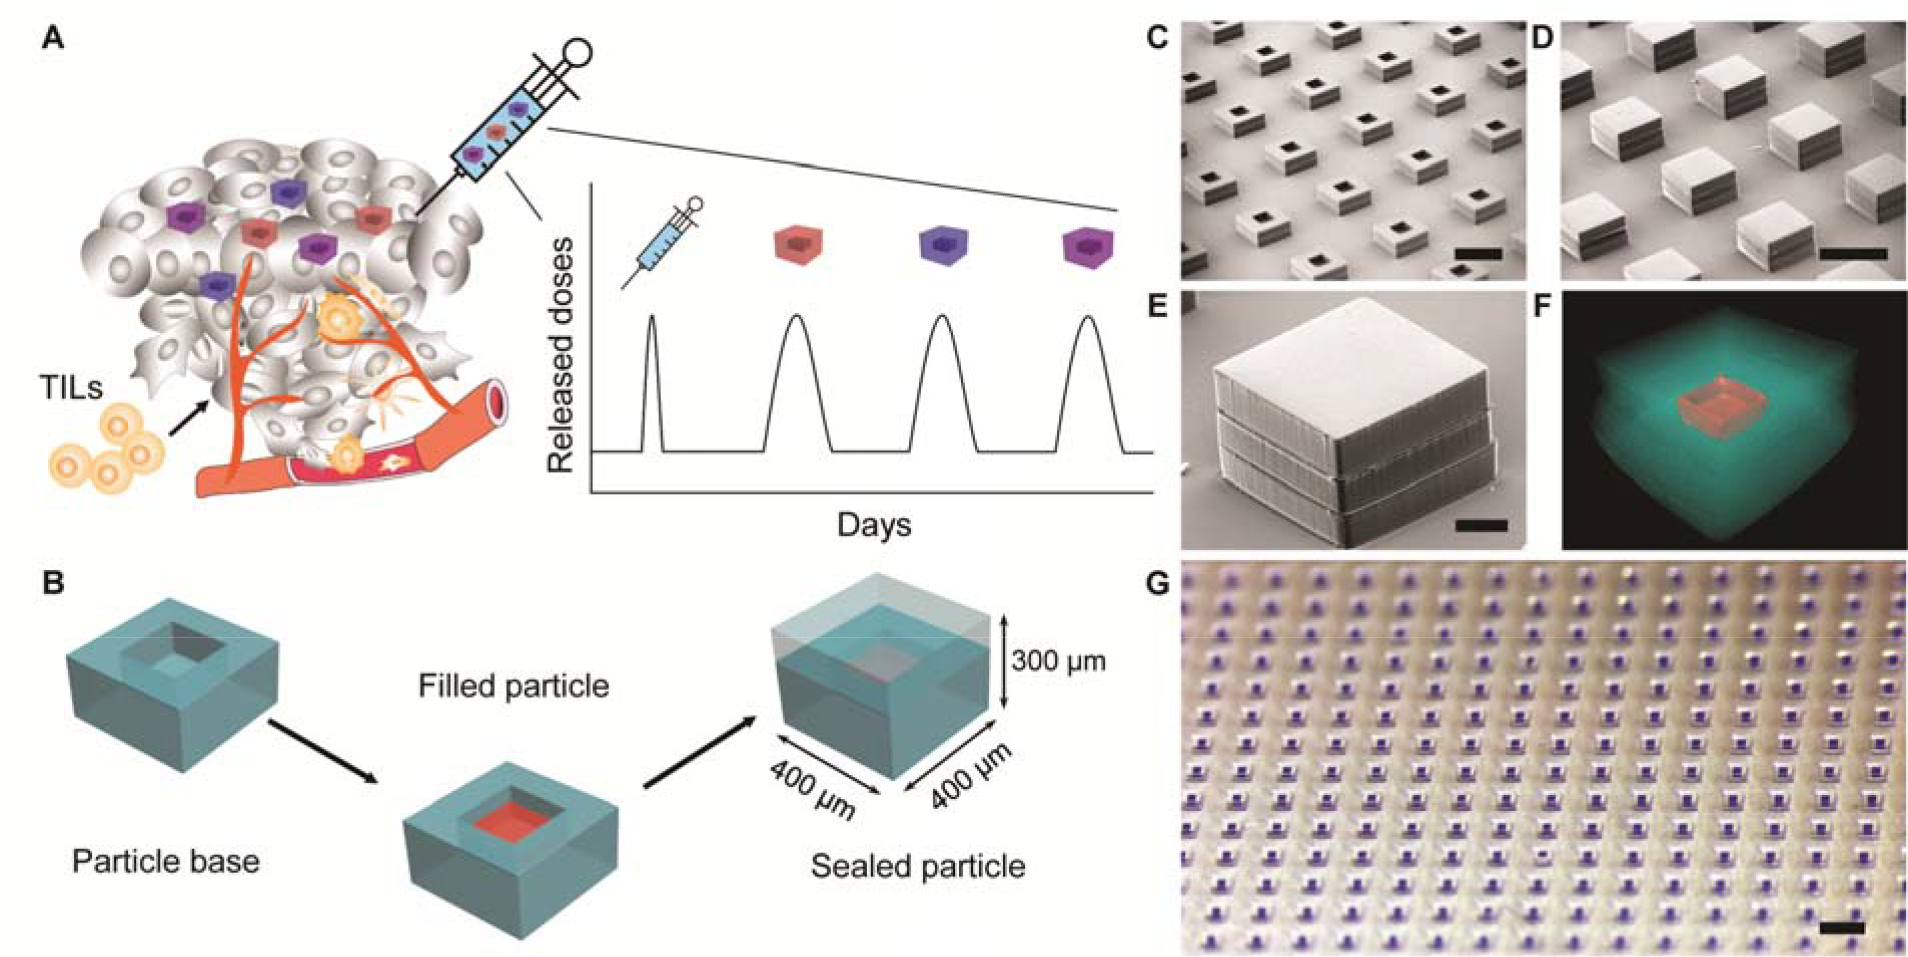
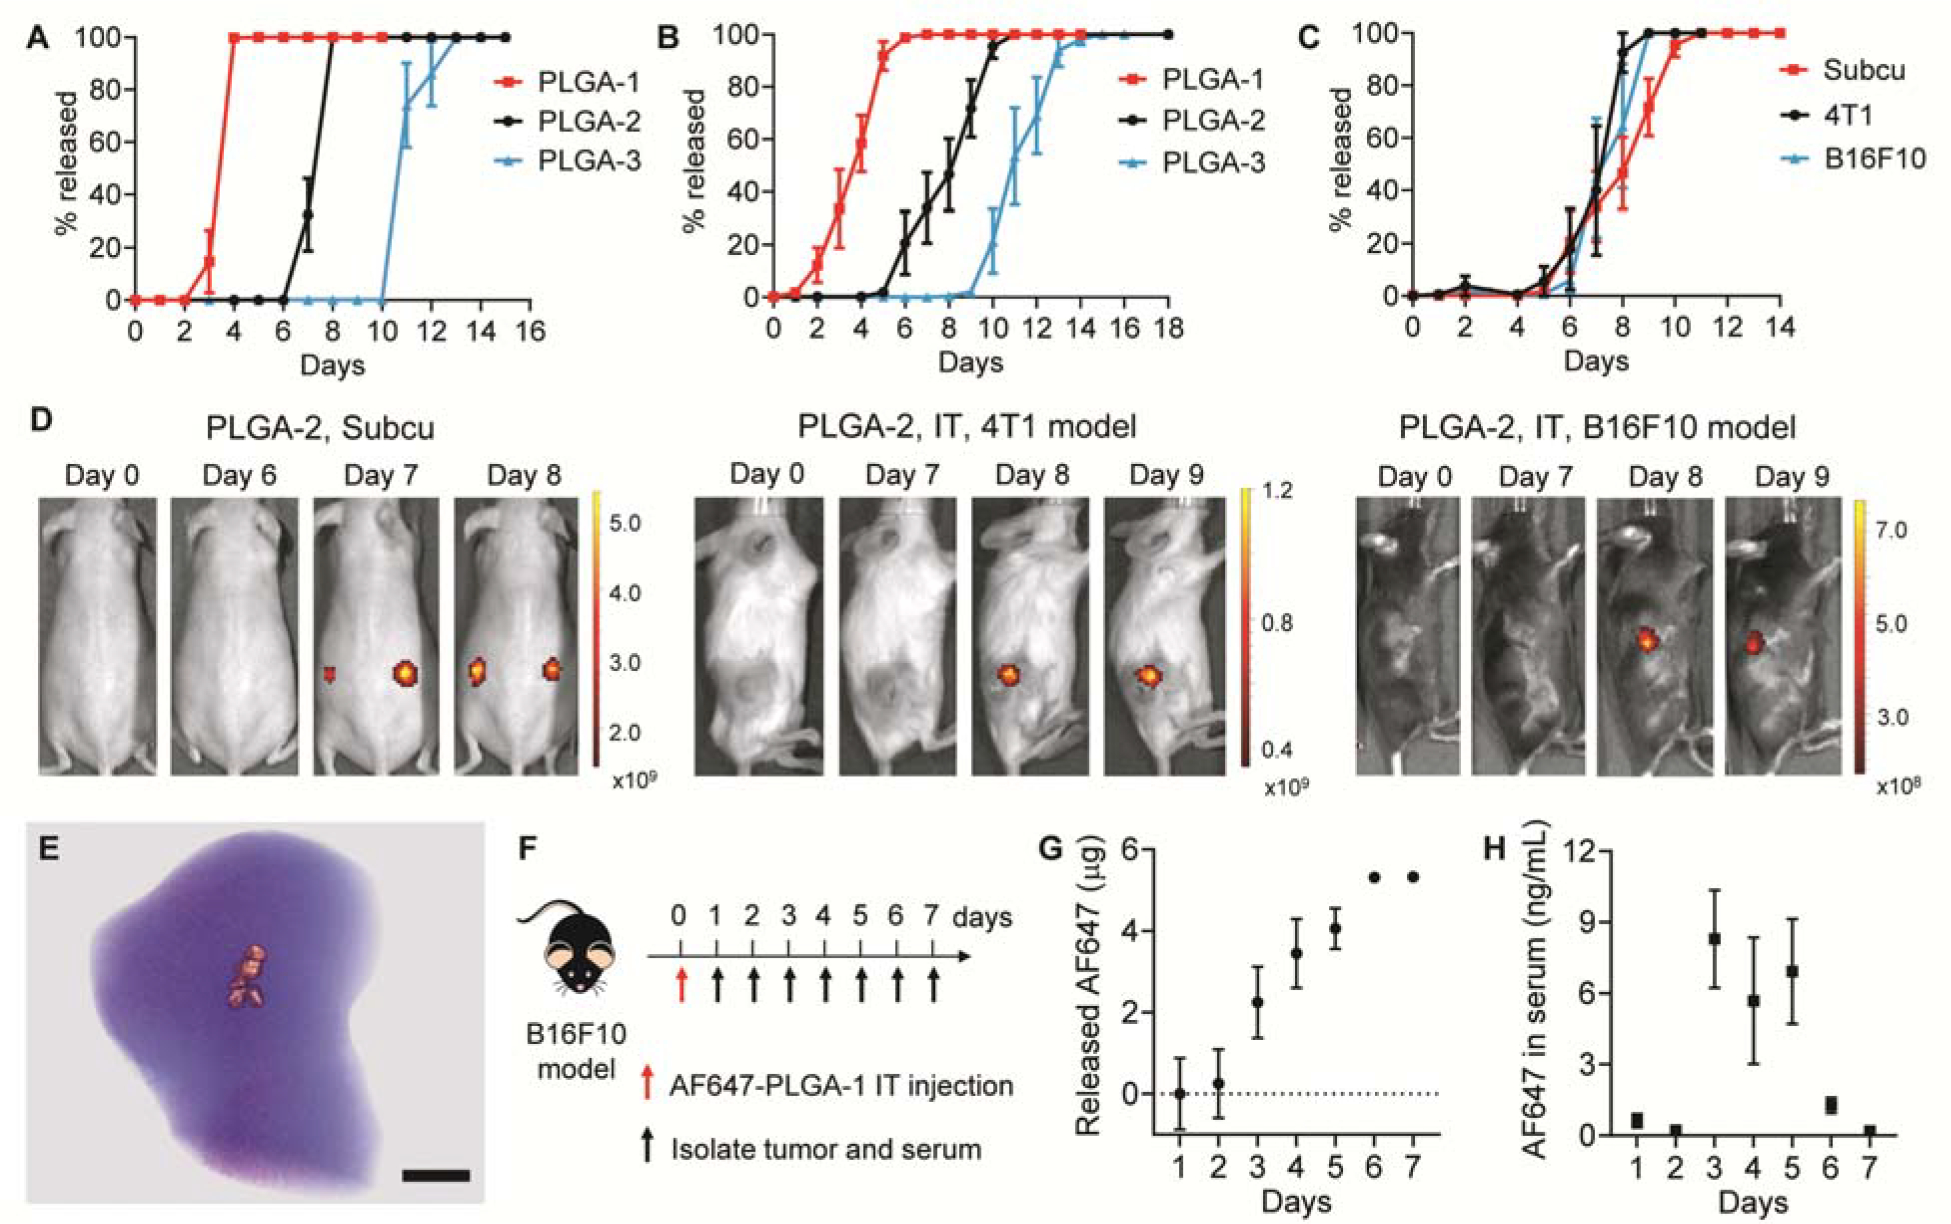
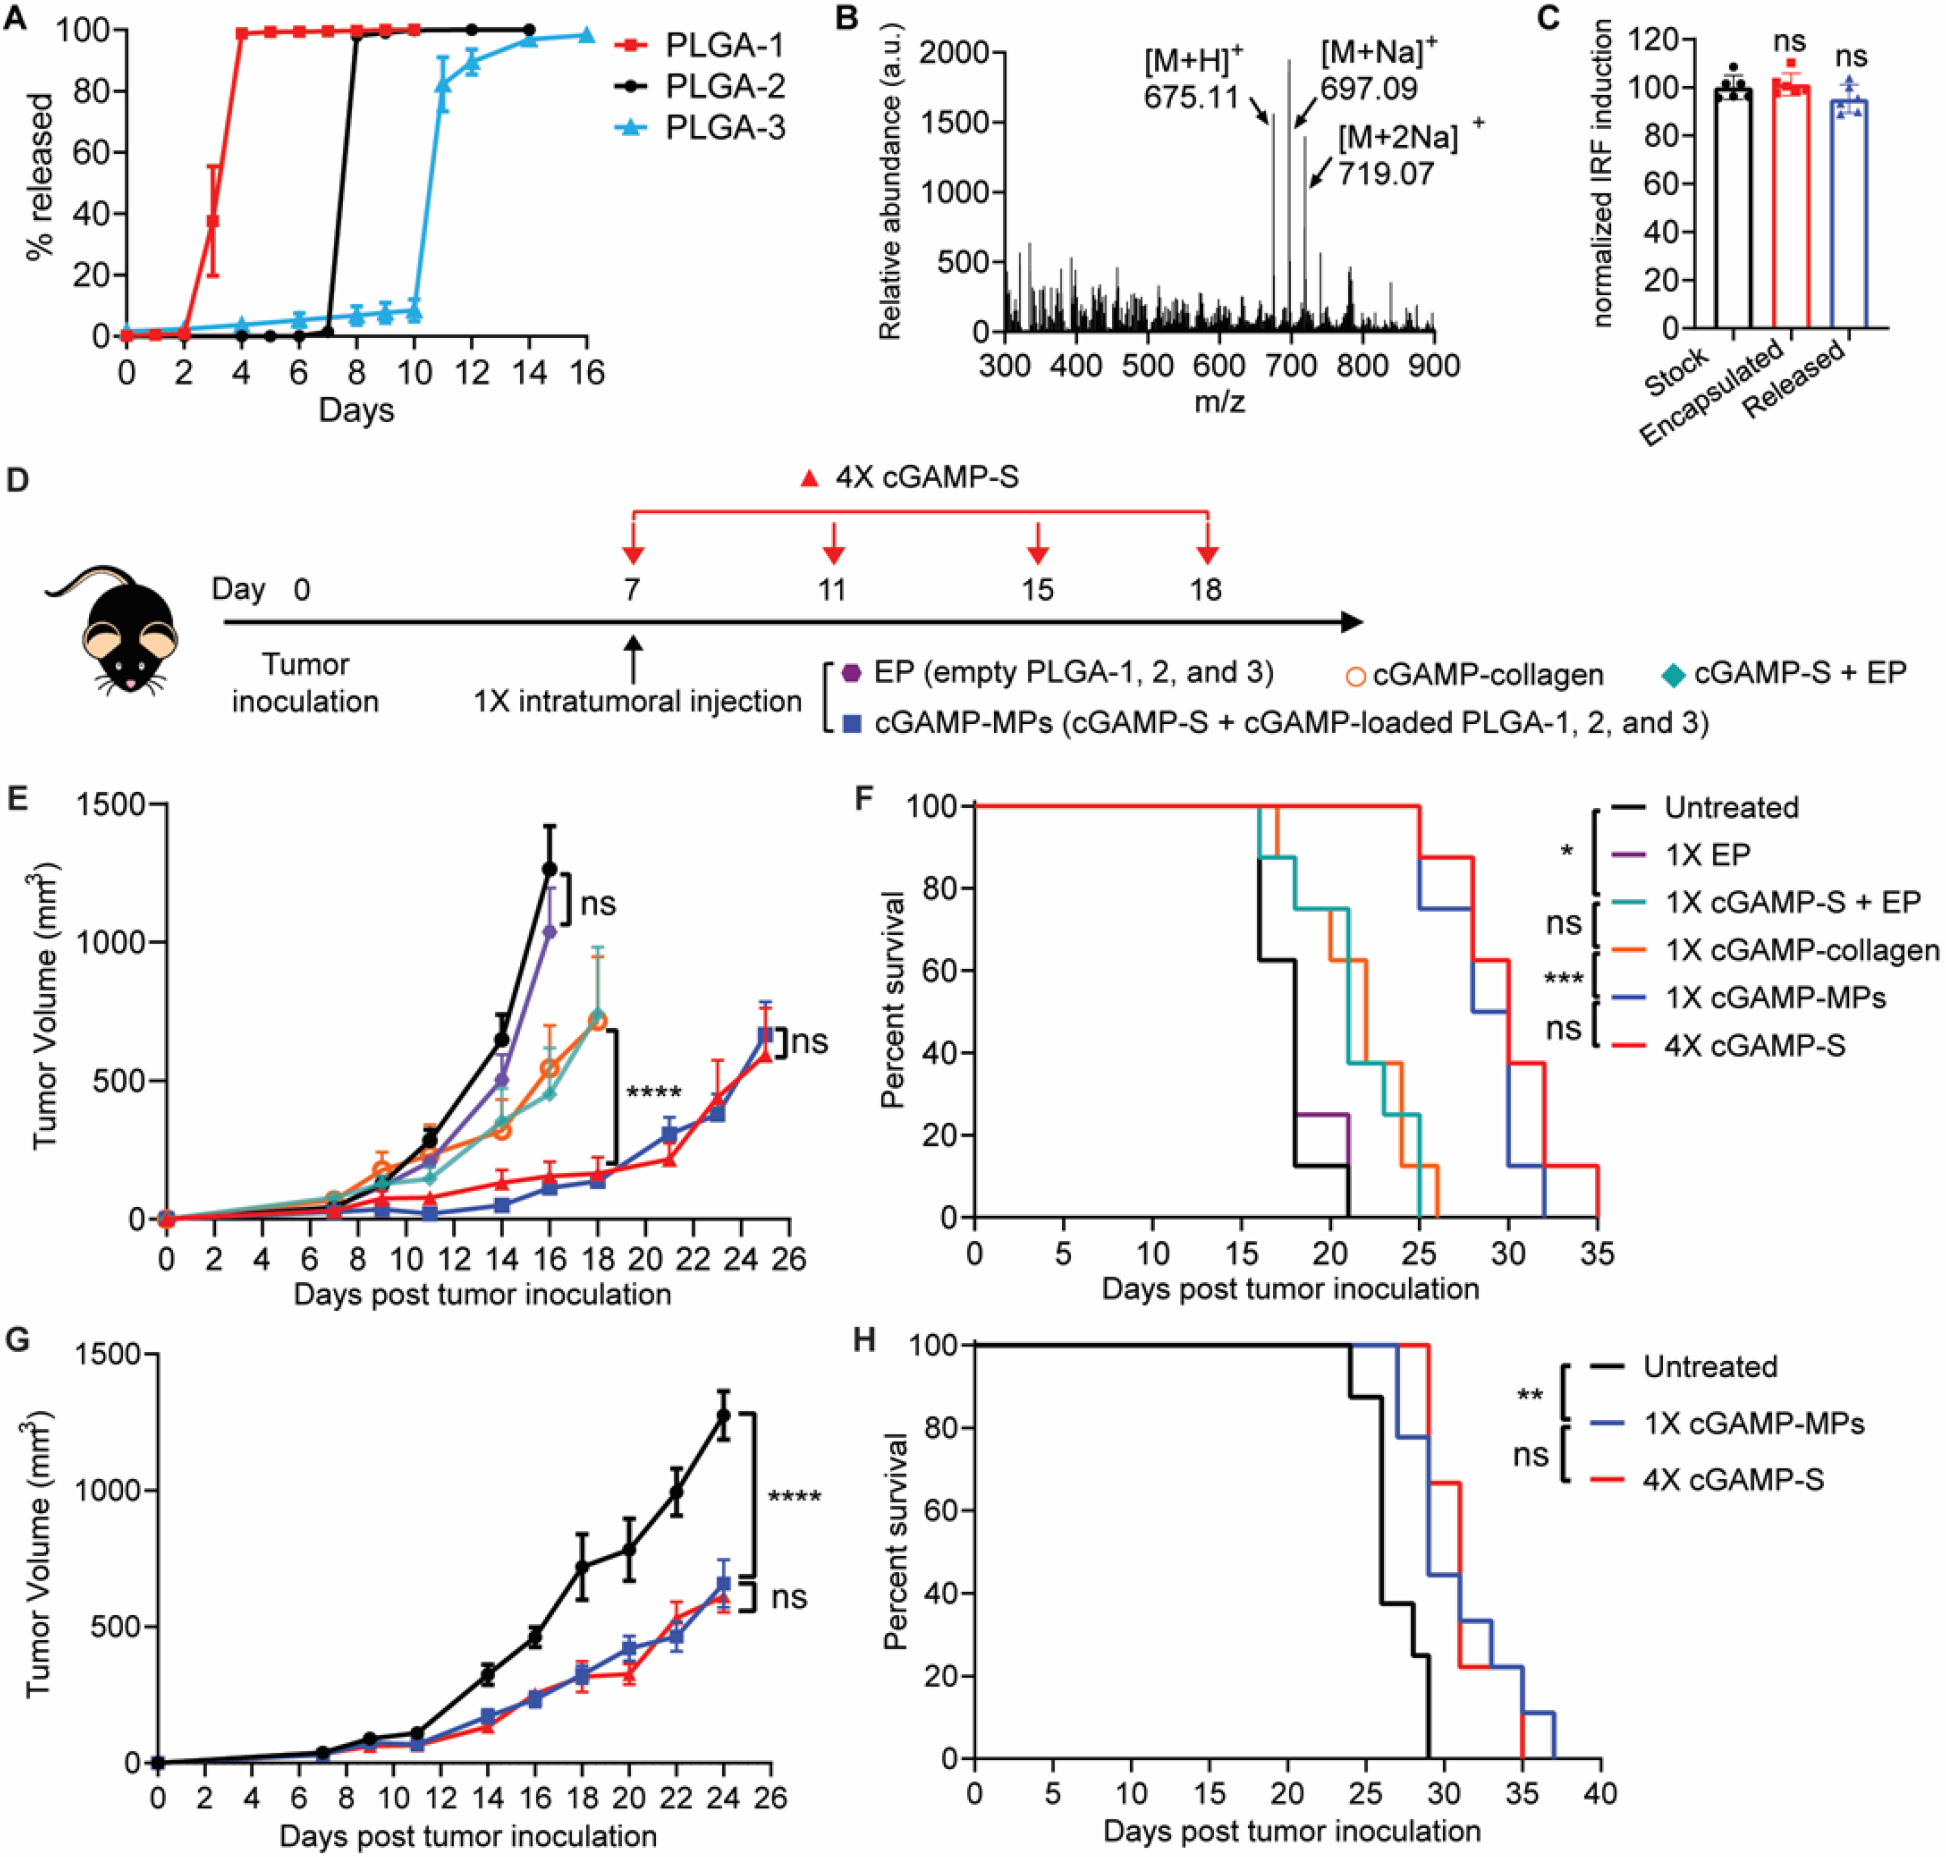
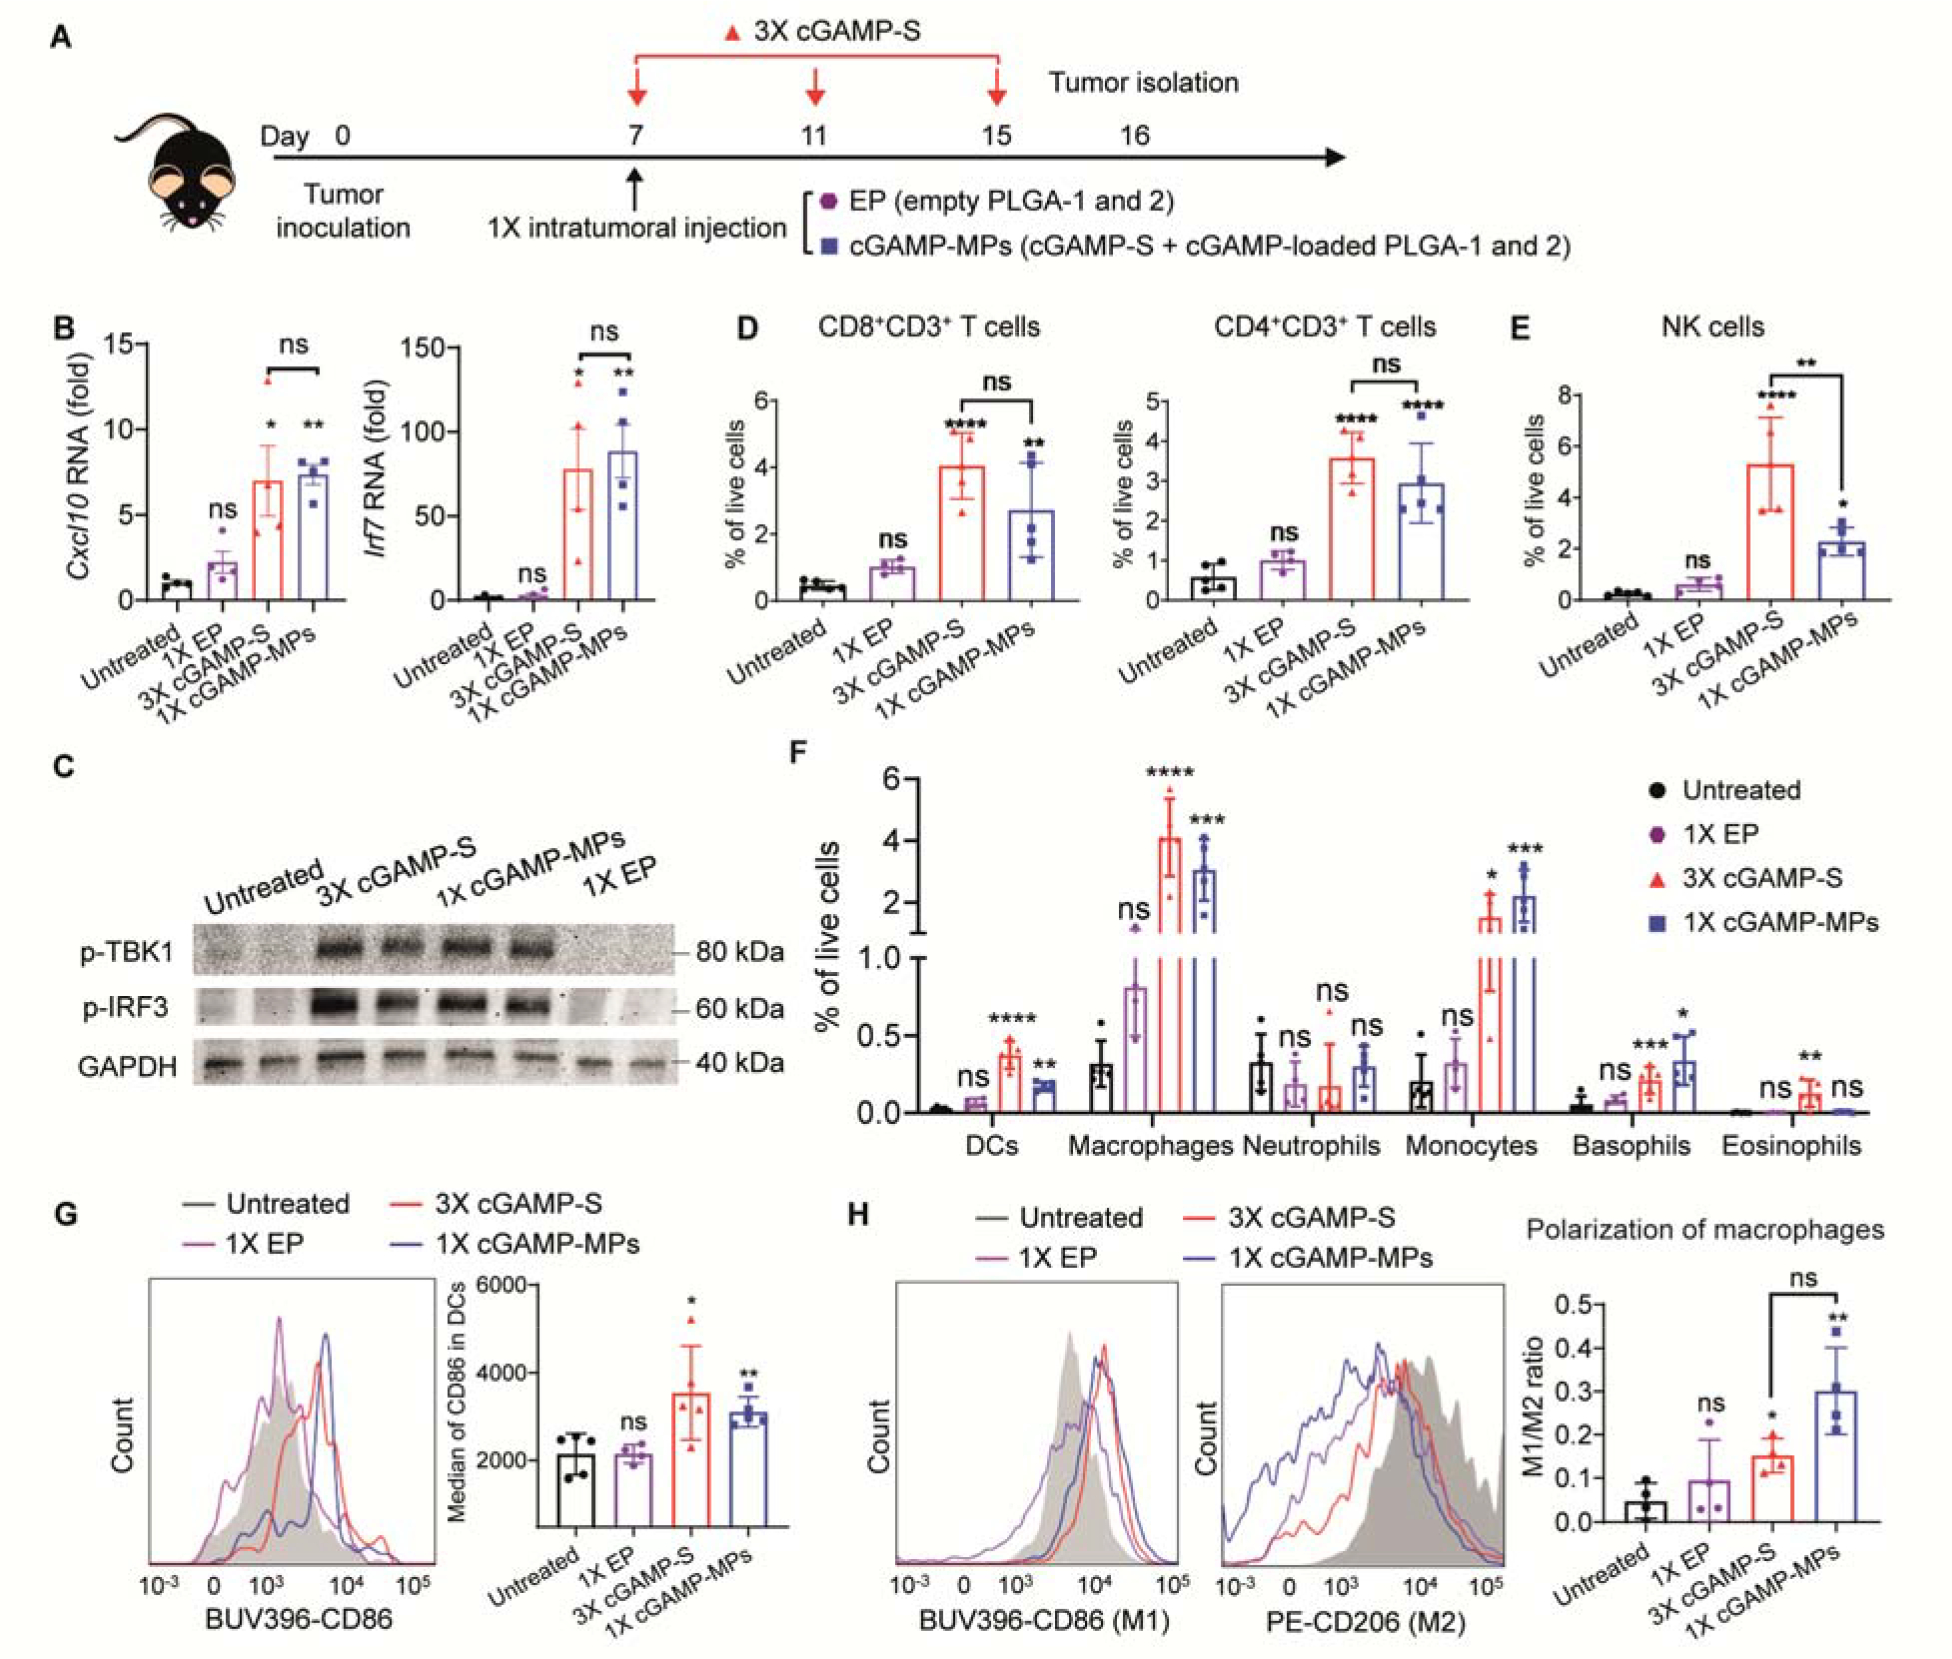
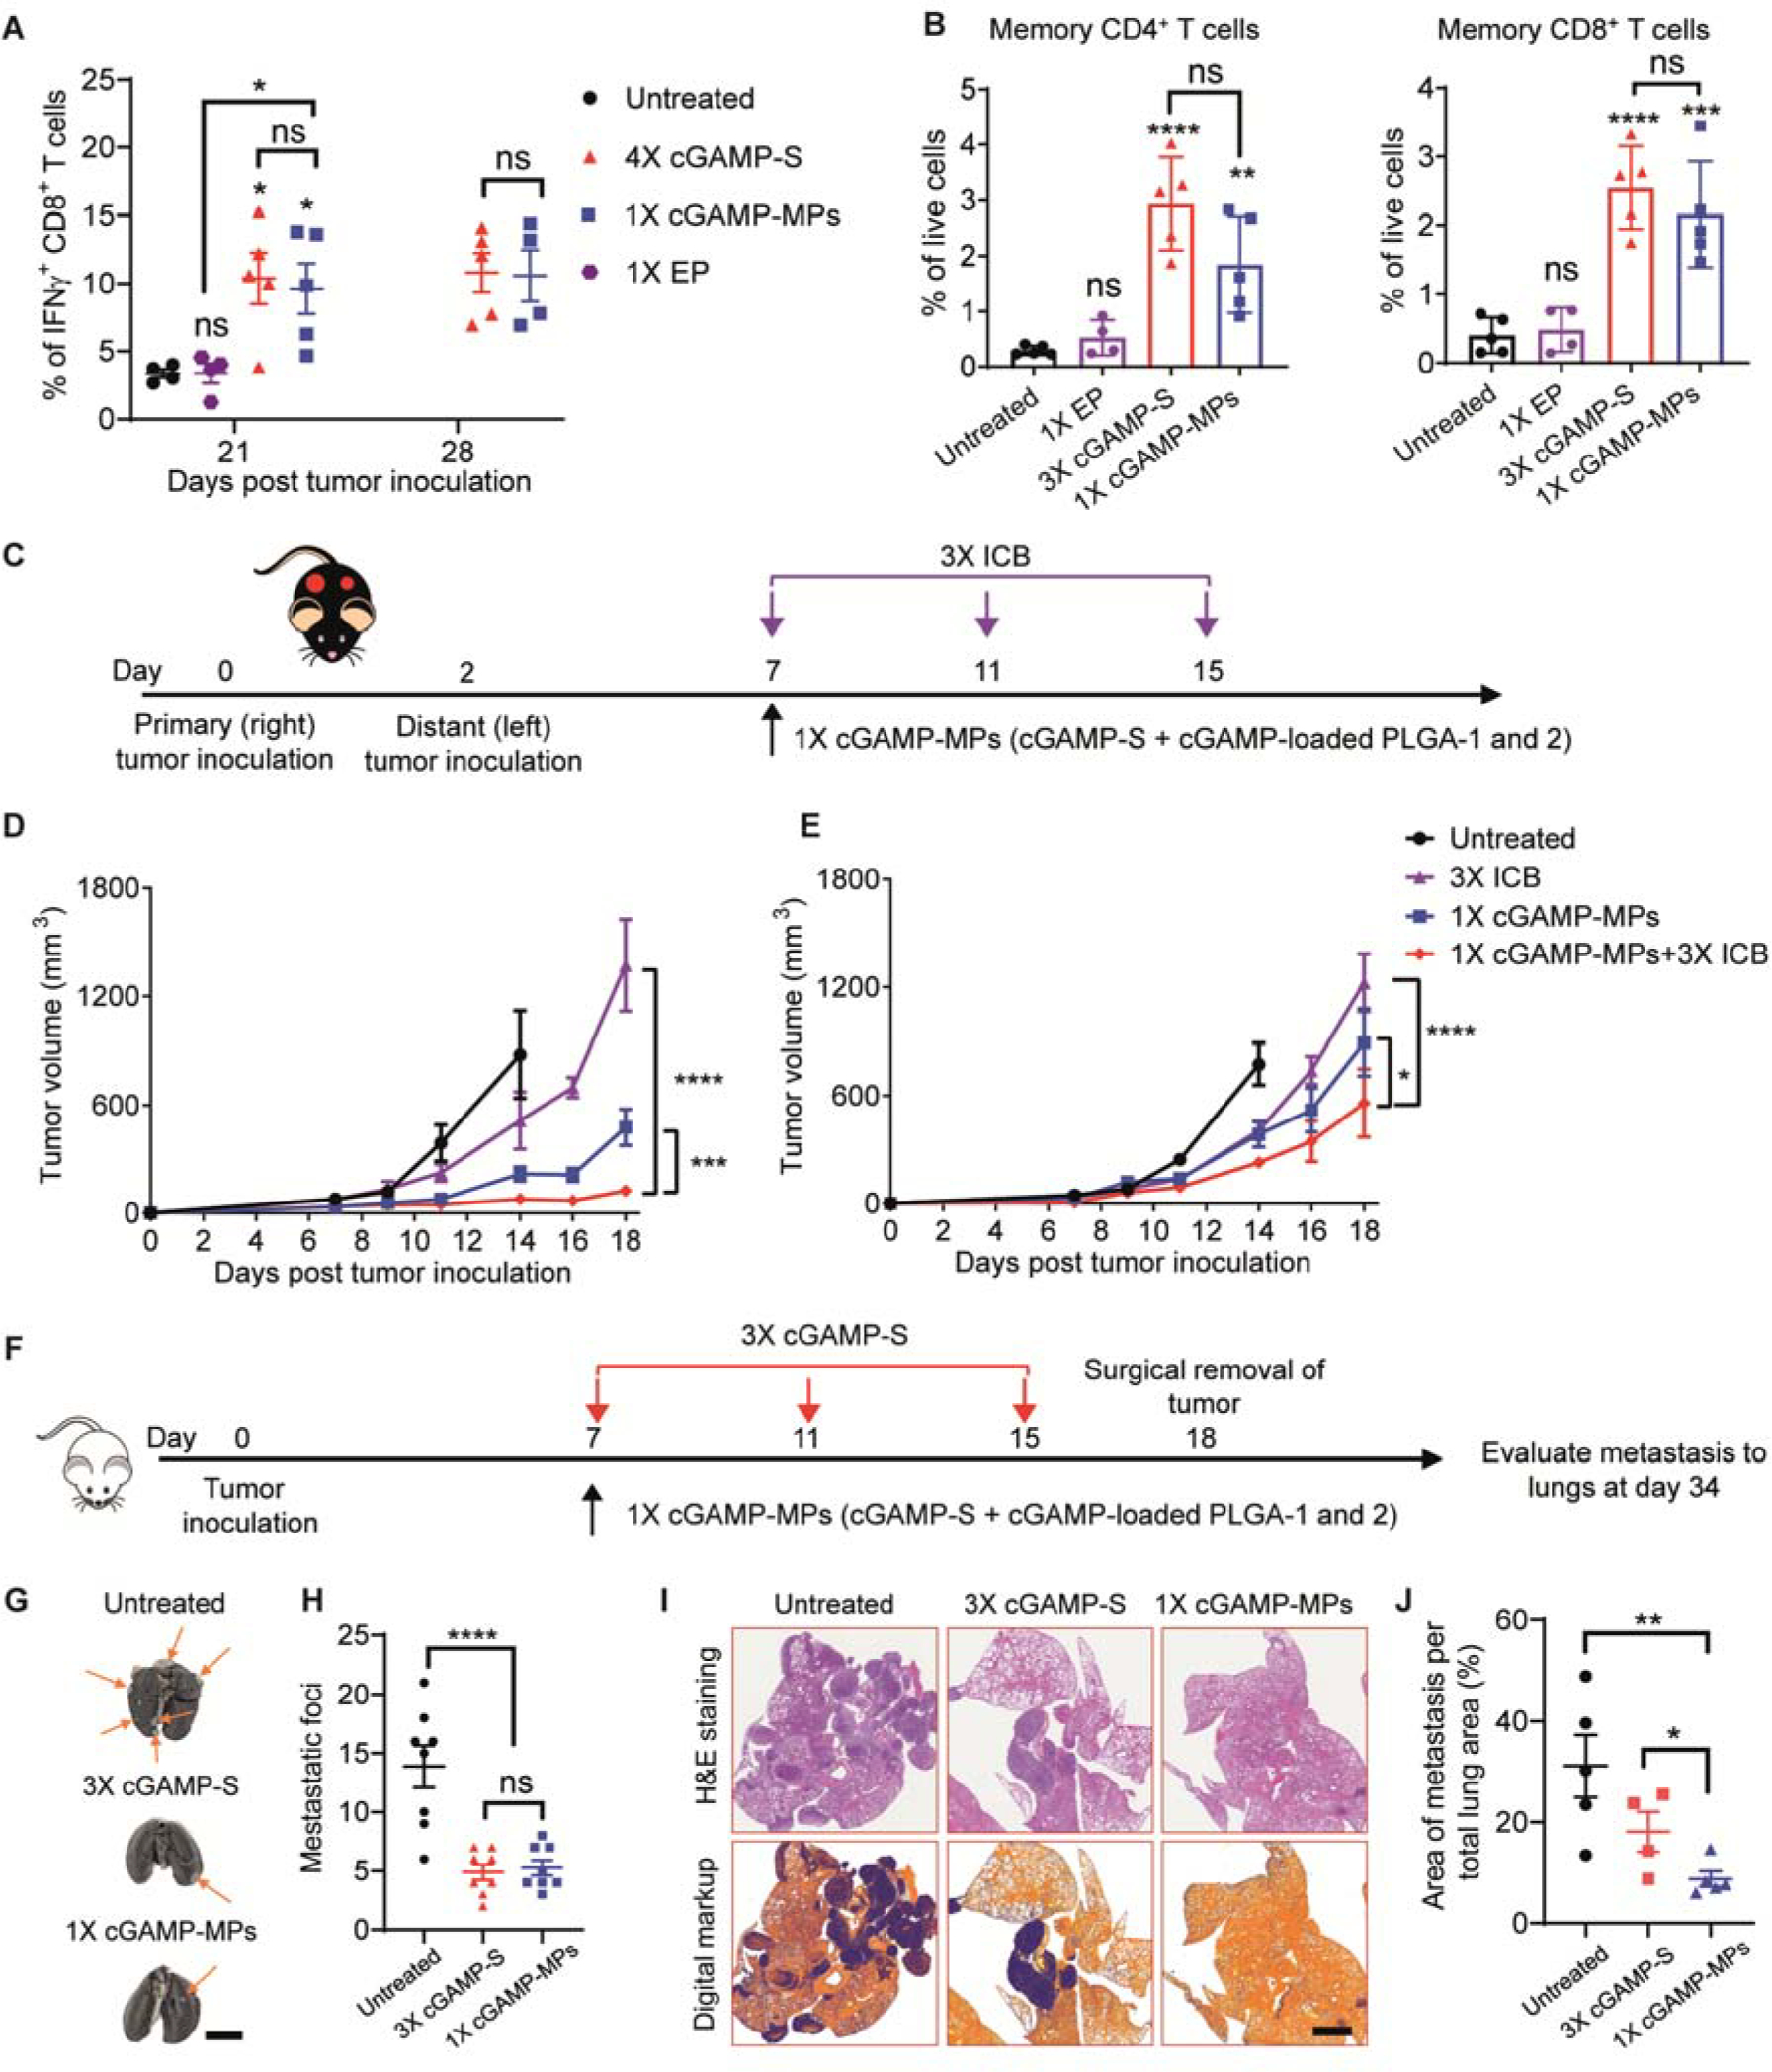
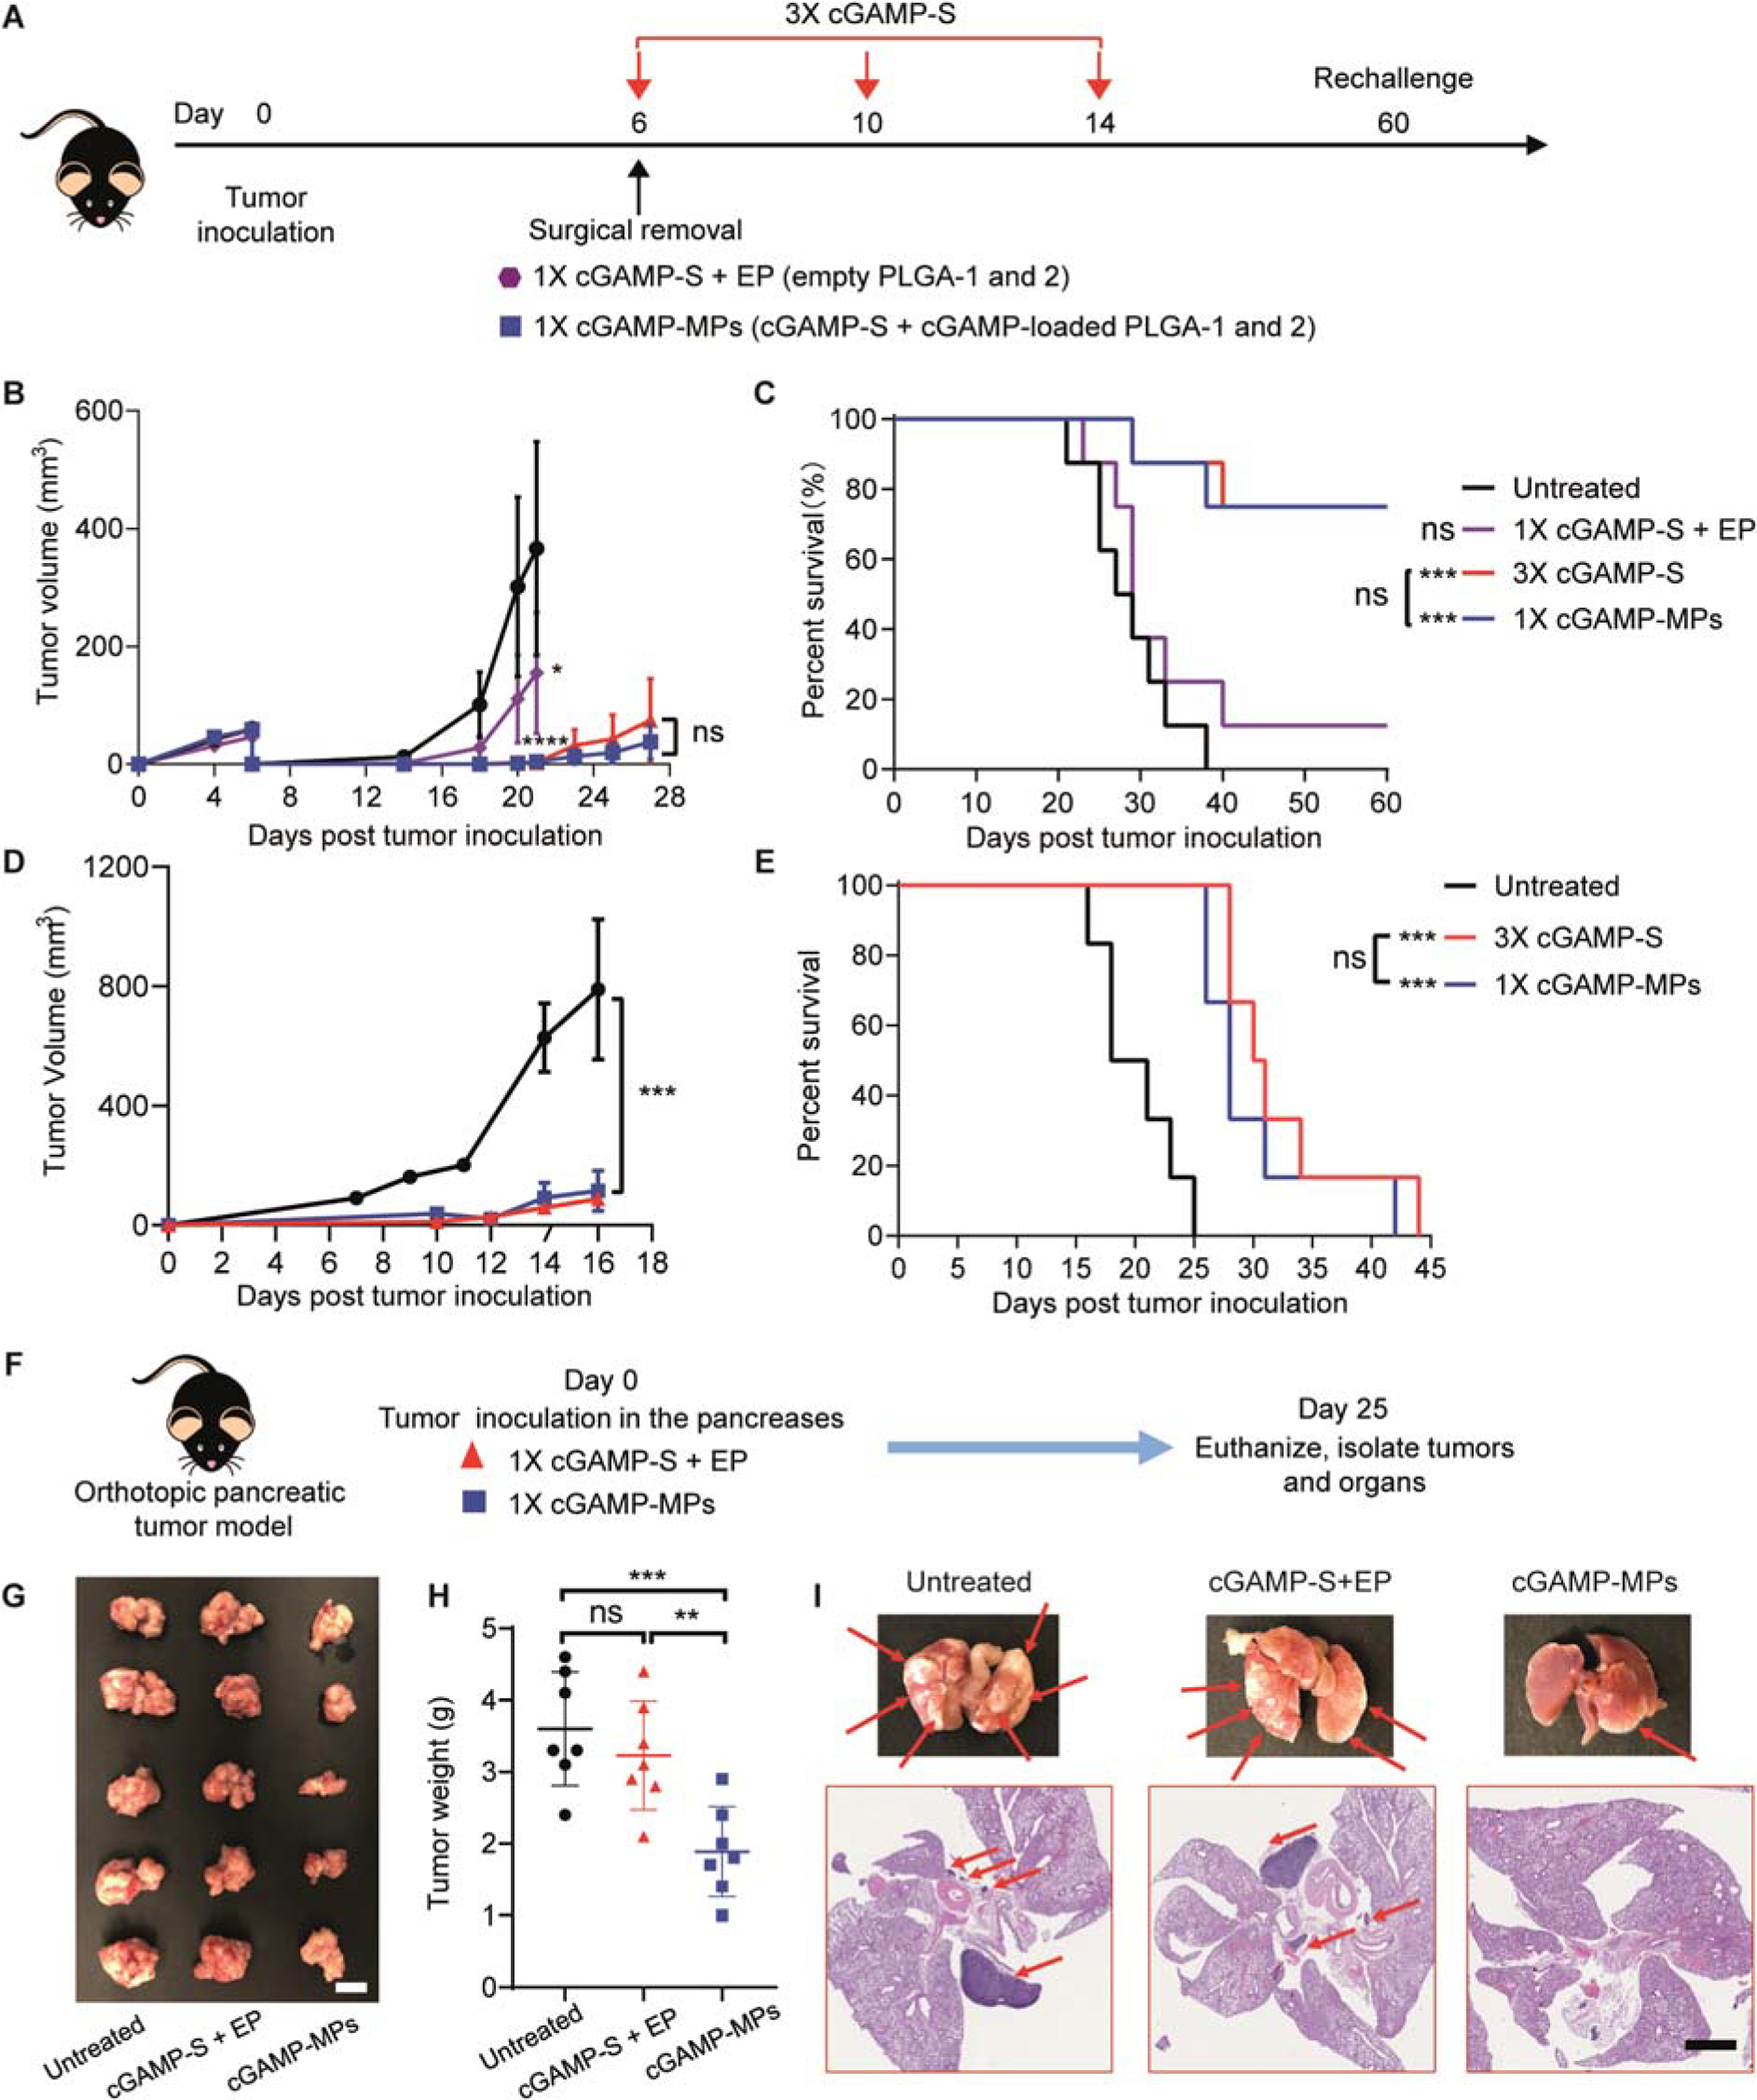
Activation of the stimulator of interferon gene (STING) pathway within the tumor microenvironment has been shown to generate a strong antitumor response. Although local administration of STING agonists has promise for cancer immunotherapy, the dosing regimen needed to achieve efficacy requires frequent intratumoral injections over months. Frequent dosing for cancer treatment is associated with poor patient adherence, with as high as 48% of patients failing to comply. Multiple intratumoral injections also disrupt the tumor microenvironment and vascular networks and therefore increase the risk of metastasis. Here, we developed microfabricated polylactic-co-glycolic acid (PLGA) particles that remain at the site of injection and release encapsulated STING agonist as a programmable sequence of pulses at predetermined time points that mimic multiple injections over days to weeks. A single intratumoral injection of STING agonist-loaded microparticles triggered potent local and systemic antitumor immune responses, inhibited tumor growth, and prolonged survival as effectively as multiple soluble doses, but with reduced metastasis in several mouse tumor models. STING agonist-loaded microparticles improved the response to immune checkpoint blockade therapy and substantially decreased the tumor recurrence rate from 100 to 25% in mouse models of melanoma when administered during surgical resection. In addition, we demonstrated the therapeutic efficacy of STING microparticles on an orthotopic pancreatic cancer model in mice that does not allow multiple intratumoral injections. These findings could directly benefit current STING agonist therapy by decreasing the number of injections, reducing risk of metastasis, and expanding its applicability to hard-to-reach cancers.


Conflict of interest statement

Competing interests: D.G.A. is a consultant with Translate Bio, Sigilon Therapeutics, and Verseau Therapeutics. X. L., R. L., and A. J. are inventors on patent application (Micromolded particles for cancer treatment, 21543) held by Massachusetts Institute of Technology that covers the use of core-shell technology for treating cancer. K. M., A. J., and R. L. are inventors on patent applications (US 62/558,172 and US 14/572,631) submitted by Massachusetts Institute of Technology that cover the core-shell particle fabrication technology. For a list of entities with which R.L. is involved, compensated or uncompensated, see www.dropbox.com/s/yc3xqb5s8s94v7x/Rev%20Langer%20COI.pdf?dl=0. All other authors declare that they have no competing interests.

Figures

Figure 1.
Figure 1.. Design and fabrication of PLGA-MPs.
A. Schematics of single injection drug delivery platform for cancer immunotherapy. Different PLGA microparticles reside in the tumor after a single intratumoral injection, release encapsulated STING agonist in pulses at discrete time points, and promote infiltration of tumor-infiltrating lymphocytes (TILs). B. Schematics of the fabrication process of PLGA-MPs, which are prepared by filling cargo of interest into particle bases and then sealing the bases with corresponding particle caps by briefly applying heat. C, D, E. Representative scanning electron microscopy images of empty particle bases (C) and sealed array of particles (D) or an individual particle (E). Scale bars are 500 μm in C and D, and 100 μm in E. F. Representative high resolution X-ray computed tomography image of sealed particle encapsulating 3’3’-cGAMP. Red color represents dried 3’3’-cGAMP. Scale bar is 100 μm. G. Representative optical image of an array of sealed particles encapsulating Alexa Fluor 647-labeled dextran. Scale bar is 1 mm.
Figure 2.
Figure 2.. Release kinetics of PLGA-MPs.
A, B. Cumulative in vitro (A) and in vivo (B) release kinetics of AF647-dextran from PLGA-1, 2, and 3. PLGA-MPs were administered subcutaneously (n = 6–8). Data are shown as mean ± SEM. C, D. Cumulative in vivo release kinetics (C) and representative fluorescence images (D) of AF647-dextran-loaded PLGA-2 that were administered subcutaneously in SKH1E hairless mice (n = 8) or intratumorally in B16F10 melanoma model (n = 4) and 4T1 breast cancer model (n = 4). Data are shown as mean ± SEM. Scale bars represent radiant efficiency. E. MicroCT image of the B16F10 tumor, which was isolated from mice 1 h after injection of 5% phosphotungstic acid-doped PLGA-1. Scale bar is 2 mm. F. Treatment and sampling schedule of B16F10 tumor-bearing mice after intratumoral injection of AF647-loaded PLGA-1. G. Cumulative in vivo release of AF647 from PLGA-1 in B16F10 tumors (n = 4). H. AF647 concentration in serum after intratumoral injection of AF647-loaded PLGA-1 (n = 4). Data are shown as mean ± SEM.
Figure 3.
Figure 3.. Single injection of cGAMP-MPs inhibited tumor growth and prolonged animal survival.
A. Cumulative in vitro release of 3’3’-cGAMP from PLGA-1, 2, and 3 (n = 6–8). Data are shown as mean ± SEM. B. Mass spectrum of 3’3’-cGAMP released from PLGA-2 on day 8 showed molecular ions [M+H]+ = 675.11, [M+Na]+ = 697.09, [M+2Na]+ = 719.07. Particles were incubated at 37 °C in PBS. C. Response of encapsulated cGAMP in PLGA-2 after sealing or released cGAMP from PLGA-2 (incubated at 37 °C in PBS for 8 days) on an interferon regulatory factor (IRF) reporter cell line (n = 6). Stock solution of cGAMP was used as a positive control. Data are shown as mean ± SD. Statistical significance was calculated using one-way analysis of variance (ANOVA). D. Treatment scheme of B16F10 melanoma and orthotopic 4T1 breast tumor models. Tumor-bearing mice were treated with a single intratumoral injection of EP, cGAMP-S+EP (40 μg cGAMP), cGAMP-collagen (40 μg cGAMP), or cGAMP-MPs (40 μg cGAMP: 10 μg in each of cGAMP-S, PLGA-1, 2, and 3) at day 7, or four intratumoral injections of soluble cGAMP at days 7, 11, 15, and 18 (4×cGAMP-S, 10 μg per injection) after tumor inoculation. E, F. Average tumor growth (E) and Kaplan-Meier survival curves (F) of B16F10 melanoma-bearing mice treated with different therapeutic combinations (n = 8 biologically independent samples). G, H. Average tumor growth curve (G) and survival analysis (H) of mice bearing orthotopic 4T1 breast tumors (n = 8 biologically independent samples). Statistical significance was calculated by two-way ANOVA and Tukey’s multiple comparisons test: *P < 0.05, **P < 0.01, ***P < 0.001, ****P < 0.0001. Data are shown as mean ± SEM.
Figure 4.
Figure 4.. A single injection of cGAMP-MPs activates STING pathway and stimulates an immunogenic TME.
A. Treatment scheme of B16F10 tumor-bearing mice receiving a single intratumoral injection of EP or cGAMP-MPs (30 μg cGAMP: 10 μg in each of cGAMP-S, PLGA-1, and PLGA-2) at day 7, or three intratumoral injections of soluble cGAMP at days 7, 11, and 15 (3×cGAMP-S, 10 μg per injection) after tumor inoculation. Tumors were isolated on day 16. B. qPCR analysis of Cxcl10 and Irf7 mRNA expression in tumors (n = 4). Data are shown as mean ± SEM. C. Western blot analysis of p-TBK1 and p-IRF3. GAPDH is used as an internal reference (n = 2). D, E, F. Percentages of infiltrating lymphocytes (D, CD8+CD3+ T cells and CD4+CD3+ T cells; E, NK1.1+CD3 NK cells), CD11bCD11c+ dendritic cells (DCs, F), and myeloid cells (F, CD11b+F4/80+ macrophages, CD11b+F4/80Ly6c+Ly6g+ neutrophils, CD11b+F4/80Ly6c+Ly6g monocytes, CD11b+Gr-1CD200R3+ basophils, and CD11b+Gr-1CD170+ eosinophils) in TME among all live cells (n = 4 to 5). Data are shown as mean ± SD. G. Representative flow cytometry measurements of activated DCs (CD86+CD11c+CD11b) in tumors treated with different therapeutic combinations (n = 4 to 5). Quantitative analysis was shown on the right. BUV396 and PE represent BD Horizon Brilliant Ultraviolet 396 and phycoerythrin, respectively. Data are shown as mean ± SD. H. Representative flow cytometry measurements of M1 (CD86+CD11b+F4/80+) and M2 (CD206+ CD11b+F4/80+) macrophages in tumors treated with different therapeutic combinations. The ratio of M1/M2 macrophages was calculated and presented on the right (n = 4). Data are shown as mean ± SD. Statistical significance was calculated by one-way ANOVA or Student’s t test when comparing multiple or two groups, respectively. Data were compared with untreated group unless indicated otherwise. *P < 0.05, **P < 0.01, ***P < 0.001, ****P < 0.0001.
Figure 5.
Figure 5.. Single injection of cGAMP-MPs induced systemic antitumor immunity and inhibited metastasis.
A. Quantitative analysis of IFNγ+CD8+ T cells in the serum collected at days 21 and 28 (n = 4 to 5, treatment scheme shown in Fig. 3D). Untreated and 1×EP-treated mice did not survive to day 28. Data are shown as mean ± SEM. B. Numbers of effective memory CL62LCD44+CD4+CD3+ and CL62LCD44+CD8+CD3+ T cells in the TME (treatment scheme shown in Fig. 4A). C. Schematic of treatment regimen on a contralateral B16F10 model. Tumors were inoculated on the right (primary) and left (distant) rear flanks of mice at days 0 and 2, respectively. The mice were treated with a single intratumoral injection of cGAMP-MPs (30 μg cGAMP: 10 μg cGAMP in each of cGAMP-S, PLGA-1, PLGA-2) on the primary tumor, three intraperitoneal injections of anti-PD-1 (3×ICB, 100 μg per injection), or the combination of both cGAMP-MPs and 3×ICB. The distant tumor did not receive any treatments. D, E. Average tumor growth curves of treated (D) and distant tumors (E, n = 8). Data are shown as mean ± SEM. F. Schematic of treatment regimen on a metastatic 4T1 model. Mice were treated with a single intratumoral injection of cGAMP-MPs (30 μg cGAMP: 10 μg cGAMP in each of cGAMP-S, PLGA-1, PLGA-2) or three intratumoral injections of cGAMP-S (3×cGAMP-S). G, H. Representative lung photographs (G) and number of metastatic foci (H) on lung surfaces after treatments (n = 8). Arrows point to metastatic tumors. Scale bar is 0.5 cm. I. Representative H&E stained lung sections and digitally processed images used for quantifying metastatic tumor cells. Scale bar is 2 mm. J. Percentage of tumor area within total lung area after treatments (n = 4 to 5). Statistical significance was calculated by Student’s t test or two-way ANOVA: *P < 0.05, **P < 0.01, ***P < 0.001, ****P < 0.0001.
Figure 6.
Figure 6.. cGAMP-MPs prevented tumor recurrence after surgery and inhibited growth of hard-to-reach tumors
A. Schematic of treatment regimen in a surgical removal B16F10 model. Approximately 99% of the tumor mass was surgically removed at day 6 after tumor inoculation. cGAMP-MPs (30 μg cGAMP: 10 μg cGAMP in each of cGAMP-S, PLGA-1, PLGA-2) or 1×cGAMP-S+EP (10 μg cGAMP with empty PLGA-1 and 2) were directly deposited at the surgical bed. For 3×cGAMP-S treatment, cGAMP-S was administered intratumorally at days 6, 10, and 14 (10 μg per injection). B, C. Average tumor growth curve (B) and survival analysis (C) of treated mice (n = 8). Numbers of tumor-free mice out of treated mice for each group are indicated in C. D, E. Tumor-free mice after cGAMP-MPs and 3×cGAMP-S treatments were rechallenged with B16F10 cells at day 60 after tumor inoculation. Naïve mice were challenged as negative controls. Tumor growth (D) and survival (E) were monitored over time (n = 6). Data are shown as means ± SEM. F. Schematic of treatment regimen on an orthotopic pancreatic tumor model. cGAMP-MPs or 1×cGAMP-S+EP were injected into the pancreases immediately after tumor inoculation (n = 7). G, H. Representative images (G) and weights (H) of isolated pancreatic tumors. Scale bar is 1 cm. I. Representative photographs of lungs and H&E stained lung sections. Red arrows point to metastatic tumors. Scale bar is 2 mm. Statistical significance was calculated by one way or two-way ANOVA and Tukey’s multiple comparisons test: *P < 0.05, **P < 0.01, ***P < 0.001, ****P < 0.0001.

Similar articles

Cited by

References

    1. Postow MA, Callahan MK, Wolchok JD, Immune checkpoint blockade in cancer therapy, J. Clin. Oncol. 33, 1974–1982 (2015). - PMC - PubMed
    1. Sharma P, Allison JP, The future of immune checkpoint therapy, Science (80-. ). 348, 56–51 (2014). - PubMed
    1. Harlin H, Meng Y, Peterson AC, Zha Y, Tretiakova M, Slingluff C, McKee M, Gajewski TF, Chemokine Expression in Melanoma Metastases Associated with CD8+ T-Cell Recruitment, Cancer Res. 69, 3077–3085 (2009). - PMC - PubMed
    1. Gajewski TF, Woo S-R, Zha Y, Spaapen R, Zheng Y, Corrales L, Spranger S, Cancer immunotherapy strategies based on overcoming barriers within the tumor microenvironment, Curr. Opin. Immunol. 25, 268–276 (2013). - PubMed
    1. Galon J, Pagès F, Marincola FM, Angell HK, Thurin M, Lugli A, Zlobec I, Berger A, Bifulco C, Botti G, Tatangelo F, Britten CM, Kreiter S, Chouchane L, Delrio P, Arndt H, Asslaber M, Maio M, V Masucci G, Mihm M, Vidal-Vanaclocha F, Allison JP, Gnjatic S, Hakansson L, Huber C, Singh-Jasuja H, Ottensmeier C, Zwierzina H, Laghi L, Grizzi F, Ohashi PS, Shaw PA, Clarke BA, Wouters BG, Kawakami Y, Hazama S, Okuno K, Wang E, O’Donnell-Tormey J, Lagorce C, Pawelec G, Nishimura MI, Hawkins R, Lapointe R, Lundqvist A, Khleif SN, Ogino S, Gibbs P, Waring P, Sato N, Torigoe T, Itoh K, Patel PS, Shukla SN, Palmqvist R, Nagtegaal ID, Wang Y, D’Arrigo C, Kopetz S, Sinicrope FA, Trinchieri G, Gajewski TF, Ascierto PA, Fox BA, Cancer classification using the Immunoscore: a worldwide task force, J. Transl. Med. 10, 205 (2012). - PMC - PubMed

Publication types