. 2020 Aug 15;11(8):635.
doi: 10.1038/s41419-020-02878-z.

Triggering a switch from basal- to luminal-like breast cancer subtype by the small-molecule diptoindonesin G via induction of GABARAPL1

Affiliations

Triggering a switch from basal- to luminal-like breast cancer subtype by the small-molecule diptoindonesin G via induction of GABARAPL1

Minmin Fan et al. Cell Death Dis. .

Abstract

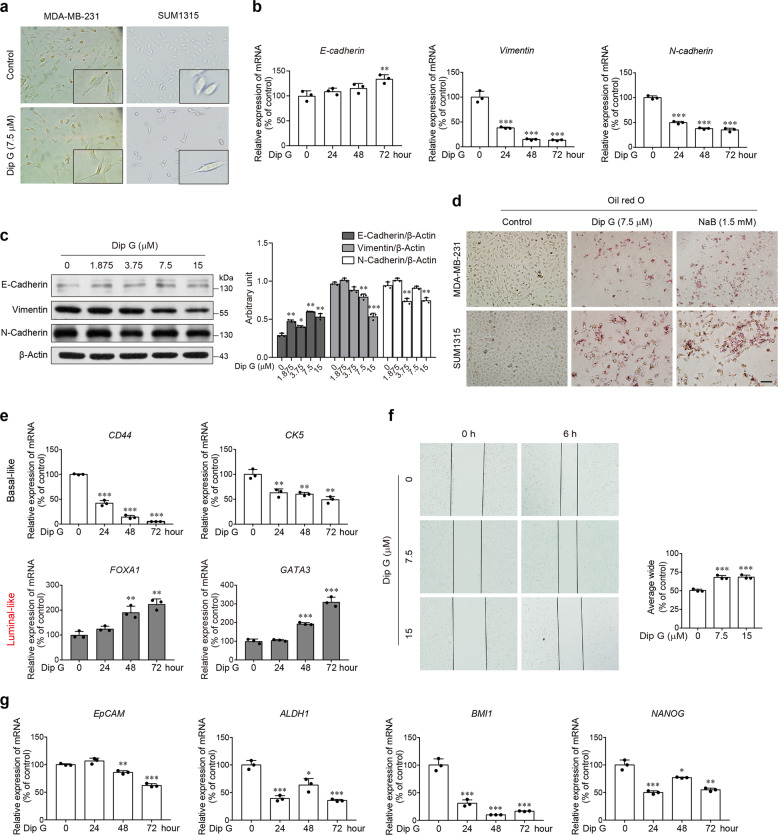
Breast cancer is a heterogeneous disease that includes different molecular subtypes. The basal-like subtype has a poor prognosis and a high recurrence rate, whereas the luminal-like subtype confers a more favorable patient prognosis partially due to anti-hormone therapy responsiveness. Here, we demonstrate that diptoindonesin G (Dip G), a natural product, exhibits robust differentiation-inducing activity in basal-like breast cancer cell lines and animal models. Specifically, Dip G treatment caused a partial transcriptome shift from basal to luminal gene expression signatures and prompted sensitization of basal-like breast tumors to tamoxifen therapy. Dip G upregulated the expression of both GABARAPL1 (GABAA receptor-associated protein-like 1) and ERβ. We revealed a previously unappreciated role of GABARAPL1 as a regulator in the specification of breast cancer subtypes that is dependent on ERβ levels. Our findings shed light on new therapeutic opportunities for basal-like breast cancer via a phenotype switch and indicate that Dip G may serve as a leading compound for the therapy of basal-like breast cancer.


Conflict of interest statement

The authors declare that they have no conflict of interest.

Figures

Fig. 1
Fig. 1. Differentiation-inducing activity of Dip G in basal-like breast cancer cell lines.
a Cellular morphology in cells treated with Dip G (7.5 μM) for 72 h. Representative images are shown. Zoom-in factor: 4. b MDA-MB-231 cells were treated with Dip G (7.5 μM) for the indicated times. The mRNA levels of E-cadherin, vimentin and N-cadherin were determined by real-time RT-PCR. β-Actin was used as an internal control. c MDA-MB-231 cells were treated with various concentrations of Dip G for 24 h. The protein levels of E-cadherin, vimentin and N-cadherin were determined by western blot. β-Actin was used as a loading control. The densitometry of the immunoblots was performed with image J software and is presented in the histograms. The data are shown as the mean ± SD of three independent experiments. d Cells were treated with Dip G or NaB for 72 h. Neutral fat contents were stained using the Oil Red O staining protocol. Scale bar: 50 μm. e Expression of basal CD44 and CK5 and luminal FOXA1 and GATA3 genes in MDA-MB-231 cells treated with Dip G (7.5 μM) for the indicated times. f Wound-healing assay for the assessment of migration in cells treated with various concentrations of Dip G for 6 h. Right panel: Representative photomicrograph. Left panel: Calculated wound-healing areas. g Expression of stemness-associated genes EpCAM, ALDH1, BMI1, and NANOG in MDA-MB-231 cells treated with Dip G (7.5 μM) for the indicated times. Data are shown as the mean ± S.D. of three independent experiments. *P < 0.05, **P < 0.01, ***P < 0.001 versus the control group without Dip G treatment.
Fig. 2
Fig. 2. Induction of a partial transcriptome shift from basal to luminal gene signatures by Dip G in basal-like breast cancer cells.
MDA-MB-231 cells were treated with or without Dip G (15 μM) for 24 h. mRNA expression was detected using RNA sequencing. a, b Heat maps depicting expression changes of the marker genes classified as basal B (a) and luminal (b) by Neve et al. (RN). A propensity of blue or red is indicative of a directional shift in the global expression of the marker gene. c GSEA enrichment plots utilizing a subset of the basal B and luminal differentiating gene sets determined by Neve et al. (RN). Vertical lines represent individual genes of the respective classifier that contribute to the enrichment scores. d Quantitation of gene expression changes for a panel of differentially expressed basal B and luminal marker genes performed using real-time RT-PCR. Data are shown as the mean ± S.D. of three independent experiments. *P < 0.05, **P < 0.01, ***P < 0.001.
Fig. 3
Fig. 3. Upregulation of GABARAPL1 expression by Dip G in basal-like breast cancer cells.
a Overlap of the common differentially regulated genes in Dip G-treated HL-60 and MDA-MB-231 cells. GABARAPL1 is included in the common upregulated genes. b, c Cells were treated with various concentrations of Dip G for 72 h (b) or in the presence of Dip G (7.5 μM) for the indicated times (c). The mRNA levels of GABARAPL1 were determined by real-time RT-PCR. β-Actin was used as an internal control. e, f Cells were treated with various concentrations of Dip G for 24 h (e) or in the presence of Dip G (7.5 μM) for the indicated times (f). The protein levels of GABARAPL1 were determined by western blot. β-Actin was used as a loading control. Data are shown as the mean ± S.D. of three independent experiments. **P < 0.01, ***P < 0.001 versus the control group without Dip G treatment.
Fig. 4
Fig. 4. Knockdown of GABARAPL1 attenuates Dip G-induced cell differentiation.
SUM1315 cells were transfected with NC-siRNA or siRNA targeting GABARAPL1 for 24 h and then treated with Dip G (7.5 μM) for 72 h. a The mRNA and protein levels of GABARAPL1 upon knockdown with siRNA. b Cell viability was tested by a trypan blue exclusion assay. c Oil Red O staining for neutral fat contents. Scale bar: 50 μm. d Expression of basal CD44 and CK5 and luminal FOXA1 and GATA3 genes. e Expression of stemness-associated genes EpCAM, ALDH1, BMI1, and NANOG. Data are shown as the mean ± S.D. of three independent experiments. *P < 0.05, **P < 0.01, ***P < 0.001.
Fig. 5
Fig. 5. Upregulation of GABARAPL1 expression by Dip G is dependent on ERβ.
a Cells were treated with various concentrations of Dip G for 72 h. The mRNA levels of ESR1 and ESR2 were determined by real-time RT-PCR. β-Actin was used as an internal control. **P < 0.01, ***P < 0.001 versus the control group without Dip G treatment. b Cells were treated with various concentrations of Dip G for 24 h. The protein levels of ERα and ERβ were determined by western blot. β-Actin was used as a loading control. c SUM1315 cells were transfected with NC-siRNA or siRNA targeting GABARAPL1 for 24 h and then treated with Dip G (7.5 μM) for 72 h. The mRNA levels of ESR2 were determined. d, e SUM1315 cells were transfected with NC-siRNA or siRNA targeting ERβ for 24 h and then treated with Dip G (7.5 μM) for 24 h. The mRNA (d) and protein (e) levels of GABARAPL1 were determined. f Diagram of the location of ERE in the human GABARAPL1 gene promoter region. ERE: Estrogen Responsive Element; INR: transcription initiator element; ATG: translation initiation codon. g MDA-MB-231 cells were treated with Dip G (7.5 μM) for 24 h. ChIP assays were performed using an antibody against ERβ, followed by real-time RT-PCR with primers designed for the ERE in the GABARAPL1 promoter region. (h) MDA-MB-231 cells were pretreated with various concentrations of Dip G for 72 h and then treated with tamoxifen for another 48 h. Cell viability was determined by MTT assay. Data are shown as the mean ± S.D. of three independent experiments. **P < 0.01, ***P < 0.001.
Fig. 6
Fig. 6. In vivo therapeutic efficacy of Dip G by triggering basal-like breast tumor differentiation.
MDA-MB-231 cells (2 × 106) were inoculated into the mammary fat pads of female nude mice. After 10 days, mice (n = 6) were treated with vehicle control (olive oil), Dip G (7.5 or 15 mg/kg/day) or PTX (10 mg/kg/7 days) intraperitoneally for an additional 14 days. a Tumor growth curves. Left panel: representative images of the tumors at the end of the experiments. b Tumor weight on day 15. c Representative images of lung sections stained with H&E. The lung tissues were excised on day 15. Black arrow, metastatic foci in the lungs. Scale bar, 100 μm. d The proportion of mice with lung metastasis in each group. e Tumor sections were stained with antibodies against ERβ and GABARAPL1. Upper, enlarged images of rectangles. Scale bar, 100 μm. f The mRNA levels of the indicated genes in tumors excised on day 15. β-Actin was used as an internal control. gj The mice carrying orthotopically transplanted MDA-MB-231 tumors were treated with Dip G (7.5 mg/kg/day, intraperitoneally), tamoxifen (50 mg/kg/day, orally) or a combination of the two. g Tumor growth curves. h Tumor weight. i Representative images of lung sections stained with H&E. Scale bar, 100 μm. j The proportion of mice with lung metastasis in each group. *P < 0.05, **P < 0.01, ***P < 0.001.

References

    1. Neve RM, et al. A collection of breast cancer cell lines for the study of functionally distinct cancer subtypes. Cancer Cell. 2006;10:515–527. - PMC - PubMed
    1. Perou CM, et al. Molecular portraits of human breast tumours. Nature. 2000;406:747–752. - PubMed
    1. Sorlie T, et al. Gene expression patterns of breast carcinomas distinguish tumor subclasses with clinical implications. Proc. Natl Acad. Sci. USA. 2001;98:10869–10874. - PMC - PubMed
    1. Early Breast Cancer Trialists’ Collaborative, G. Effects of chemotherapy and hormonal therapy for early breast cancer on recurrence and 15-year survival: an overview of the randomised trials. Lancet. 2005;365:1687–1717. - PubMed
    1. Voduc KD, et al. Breast cancer subtypes and the risk of local and regional relapse. J. Clin. Oncol. 2010;28:1684–1691. - PubMed

Publication types

MeSH terms