

Hospital variation in admissions to neonatal intensive care units by diagnosis severity and category
- PMID: 32801351
- PMCID: PMC7427695
- DOI: 10.1038/s41372-020-00775-z
Hospital variation in admissions to neonatal intensive care units by diagnosis severity and category
Abstract
Objective: To examine interhospital variation in admissions to neonatal intensive care units (NICU) and reasons for the variation.
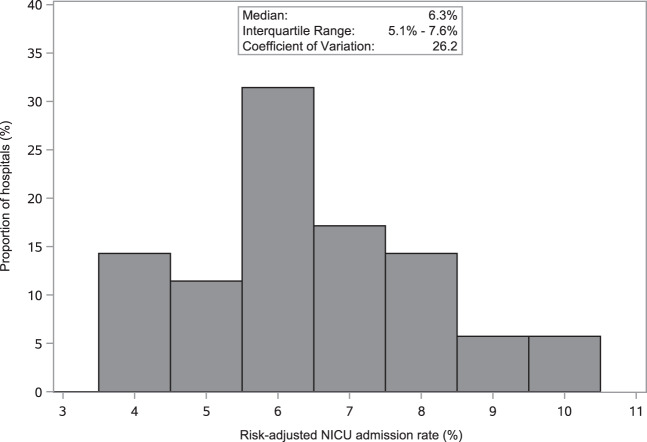
Study design: 2010-2012 linked birth certificate and hospital discharge data from 35 hospitals in California on live births at 35-42 weeks gestation and ≥1500 g birth weight were used. Hospital variation in NICU admission rates was assessed by coefficient of variation. Patient/hospital characteristics associated with NICU admissions were identified by multivariable regression.
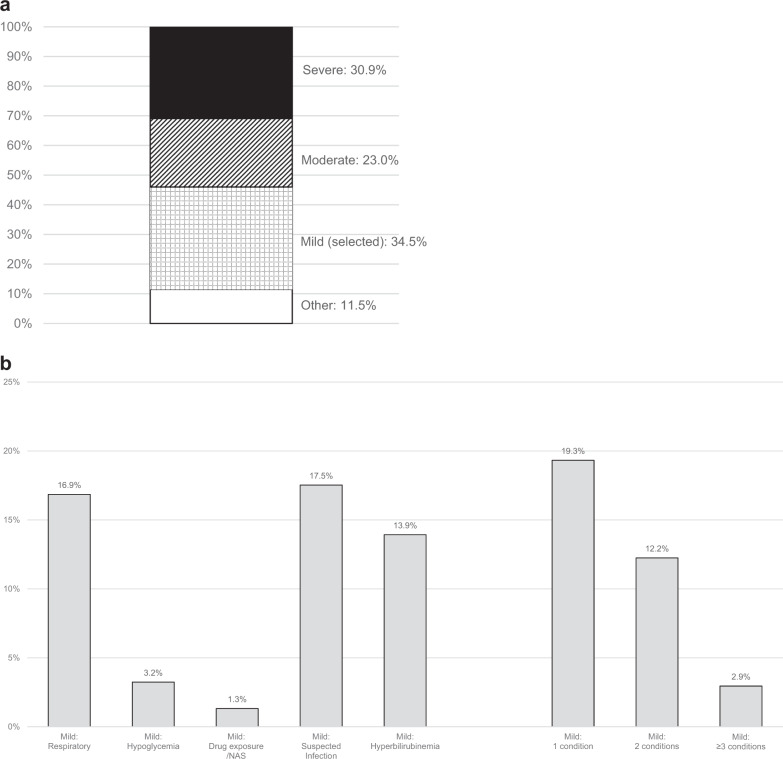
Results: Among 276,489 newborns, 6.3% were admitted to NICU with 34.5% of them having mild diagnoses. There was high interhospital variation in overall risk-adjusted rate of NICU admission (coefficient of variation = 26.2) and NICU admission rates for mild diagnoses (coefficient of variation: 46.4-74.0), but lower variation for moderate/severe diagnoses (coefficient of variation: 8.8-14.1). Births at hospitals with more NICU beds had a higher likelihood of NICU admission.
Conclusion: Interhospital variation in NICU admissions is mostly driven by admissions for mild diagnoses, suggesting potential overuse.
Conflict of interest statement
The authors declare that they have no conflict of interest.
Figures
References
-
- Harrison W, Goodman D. Epidemiologic trends in neonatal intensive care, 2007–12. JAMA Pediatr. 2015;169:855–62. - PubMed
-
- Goodman DC, Little GA, Harrison WN, Moen A, Mowitz ME, Ganduglia Cazaban C, et al. (eds.) The Dartmouth Atlas of Neonatal Intensive Care. Lebanon, NH: The Dartmouth Institute of Health Policy & Clinical Practice, Geisel School of Medicine at Dartmouth; 2019. - PubMed
Publication types
MeSH terms
Grants and funding
LinkOut - more resources
Full Text Sources
