

Neonatal Survival in Sub-Sahara: A Review of Kenya and South Africa
- PMID: 32801733
- PMCID: PMC7398680
- DOI: 10.2147/JMDH.S260058
Neonatal Survival in Sub-Sahara: A Review of Kenya and South Africa
Abstract
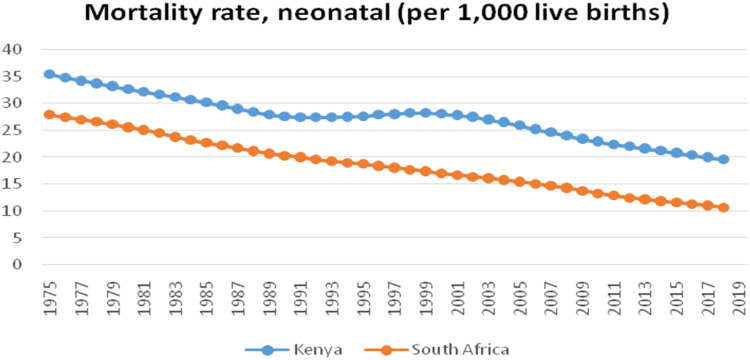
Introduction: The majority (99%) of the children who die during the first 4 weeks of life do so in the poorer parts of the world, especially in sub-Saharan Africa and South Asia. In 2018, sub-Saharan Africa had a neonatal mortality rate of 28 deaths per 1000 live births. The purpose of the review was to explore and describe the trends of neonatal mortality within the two sub-Saharan countries.
Methods: We did a literature search in biomedical databases of data published, in English, between Jan 1, 1975, and November 30, 2019. The databases included Scopus, Web of Science, Science Direct, Cochrane Library, PUBMED, OVID and Google scholar. The keywords used in the search: "Neonatal Survival", "Sub-Sahara", "Kenya" and "South Africa".
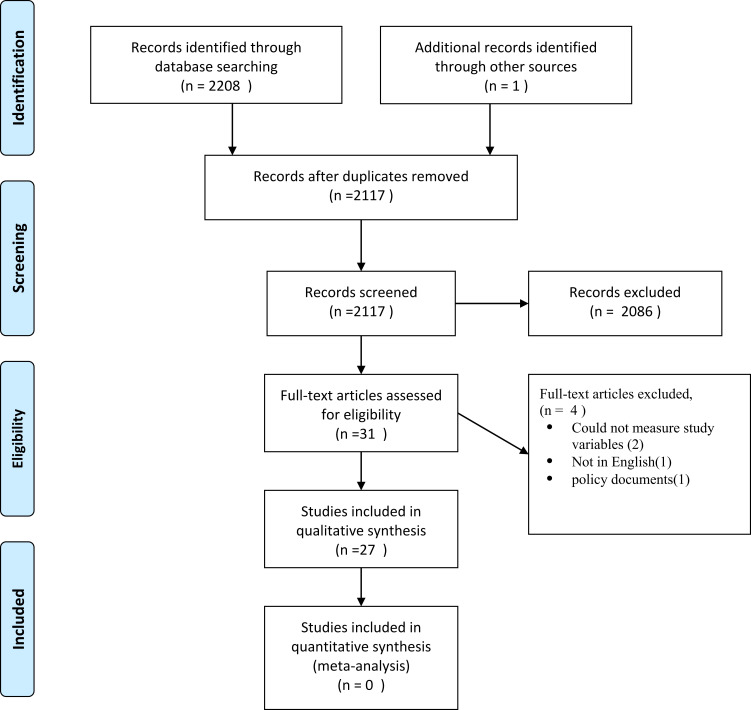
Results: The search generated 2209 articles of which only 27 met the inclusion criteria. The present study qualitatively analysed data. Data were presented and organized under two thematic domains: 1) trends of national neonatal mortality rates in South Africa and Kenya and 2) causes of neonatal mortality.
Conclusion: The current review results noted that in 2018, the neonatal mortality rate for Kenya was 19.6 deaths per 1000 live births. The neonatal mortality rate has fallen gradually from 35.4 deaths per 1000 live births in 1975. On the other hand, South Africa has had its neonatal mortality rate fall from 27.9 deaths per 1000 live births in 1975 to 10.7 deaths per 1000 live births in 2018. Most neonatal deaths resulted in preterm birth complications followed by intrapartum-related events for the two countries. Within the sub-Saharan region, disparities exist as neonates born in South Africa are more likely to survive during the neonatal period compared to Kenya.
Keywords: Africa; Kenya; South Africa; infant; mortality; newborn.
© 2020 Masaba and Mmusi-Phetoe.
Conflict of interest statement
The authors have declared that no conflicts of interest exist.
Figures
References
-
- WHO. Newborn for Africa. Geneva: WHO; 2019.
-
- WHO. Newborns Reducing Mortality. Geneva: World Health Organization; 2020.
-
- WHO. Neonatal Mortality. Geneva: World Health Organization; 2016.
Publication types
LinkOut - more resources
Full Text Sources
Miscellaneous
