

Socioeconomic Inequalities in Colorectal Cancer Survival in Southern Spain: A Multilevel Population-Based Cohort Study
- PMID: 32801917
- PMCID: PMC7383045
- DOI: 10.2147/CLEP.S261355
Socioeconomic Inequalities in Colorectal Cancer Survival in Southern Spain: A Multilevel Population-Based Cohort Study
Abstract
Background: Colorectal cancer (CRC) is the most frequently diagnosed cancer in Spain. Socioeconomic inequalities in cancer survival are not documented in Spain. We aim to study the association of socioeconomic inequalities with overall mortality and survival among CRC patients in southern Spain.
Methods: We conducted a multilevel population-based cohort study, including CRC cases for the period 2011-2013. The study time-to-event outcome was death, and the primary exposure was CRC patients' socioeconomic status assessed by the Spanish deprivation index at the census tract level. We used a mixed-effects flexible hazard model, including census tract as a random intercept, to derive overall survival estimates by deprivation.
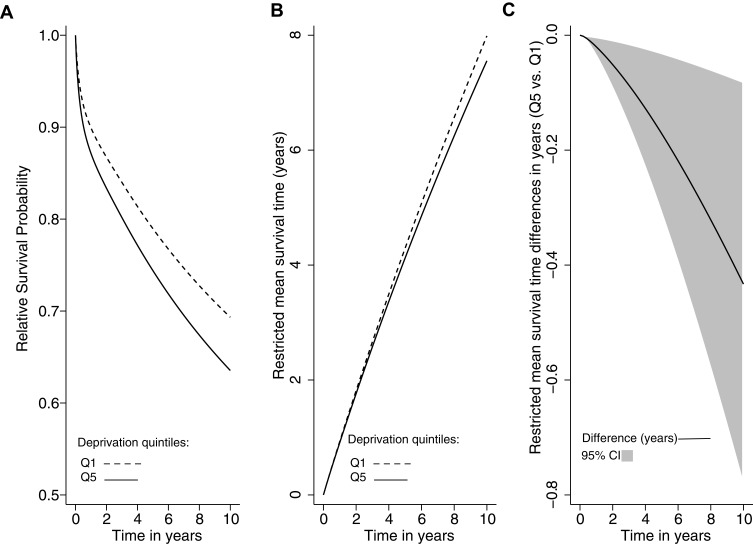
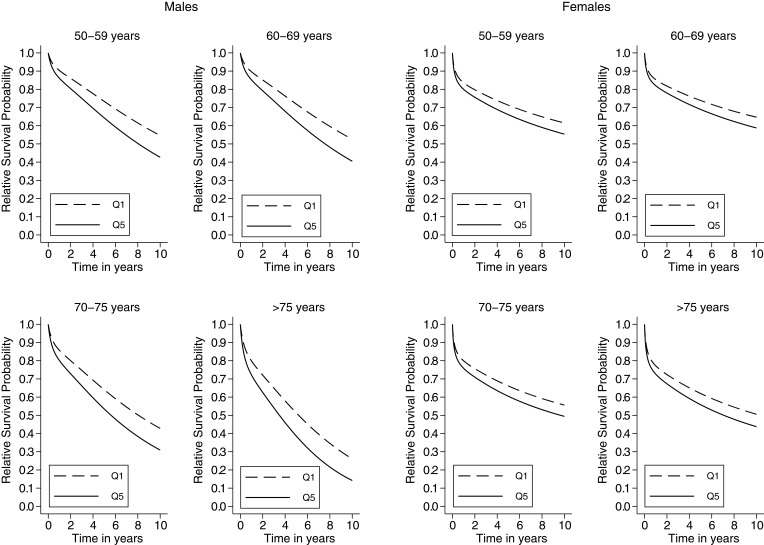
Results: Among 3589 CRC patients and 12,148 person-years at risk (pyr), 964 patients died before the end of the follow-up. Mortality by deprivation showed the highest mortality rate for the most deprived group (96.2 per 1000 pyr, 95% CI: 84.0-110.2). After adjusting for sex, age, cancer stage, and the area of residence, the most deprived had a 60% higher excess mortality risk than the less deprived group (excess mortality risk ratio: 1.6, 95% CI: 1.1-2.3).
Conclusions: We found a consistent association between deprivation and CRC excess mortality and survival. The reasons behind these inequalities need further investigation in order to improve equality cancer outcomes in all social groups.
Keywords: colorectal cancer; epidemiological methods; multilevel; population-based epidemiology; socioeconomic inequalities; survival.
© 2020 Luque-Fernandez et al.
Conflict of interest statement
The authors have declared that no competing interests exist.
Figures
Similar articles
-
Deprivation gap in colorectal cancer survival attributable to stage at diagnosis: A population-based study in Spain.Cancer Epidemiol. 2020 Oct;68:101794. doi: 10.1016/j.canep.2020.101794. Epub 2020 Aug 11. Cancer Epidemiol. 2020. PMID: 32795946
-
Lung, Breast and Colorectal Cancer Incidence by Socioeconomic Status in Spain: A Population-Based Multilevel Study.Cancers (Basel). 2021 Jun 5;13(11):2820. doi: 10.3390/cancers13112820. Cancers (Basel). 2021. PMID: 34198798 Free PMC article.
-
Socio-economic inequalities in lung cancer mortality in Spain: a nation-wide study using area-based deprivation.Int J Equity Health. 2023 Aug 2;22(1):145. doi: 10.1186/s12939-023-01970-y. Int J Equity Health. 2023. PMID: 37533035 Free PMC article.
-
[SENTIERI - Epidemiological Study of Residents in National Priority Contaminated Sites. Sixth Report].Epidemiol Prev. 2023 Jan-Apr;47(1-2 Suppl 1):1-286. doi: 10.19191/EP23.1-2-S1.003. Epidemiol Prev. 2023. PMID: 36825373 Italian.
-
Social inequalities in health: How do they influence the natural history of colorectal cancer?J Visc Surg. 2023 Jun;160(3):203-213. doi: 10.1016/j.jviscsurg.2023.02.002. Epub 2023 Apr 14. J Visc Surg. 2023. PMID: 37062638 Review.
Cited by
-
Sex differences in the diagnosis, treatment and prognosis of cancer: the rationale for an individualised approach.Clin Transl Oncol. 2023 Jul;25(7):2069-2076. doi: 10.1007/s12094-023-03112-w. Epub 2023 Feb 18. Clin Transl Oncol. 2023. PMID: 36802013 Free PMC article.
-
The Influence of Sex and/or Gender on the Occurrence of Colorectal Cancer in the General Population in Developed Countries: A Scoping Review.Int J Public Health. 2024 Apr 10;69:1606736. doi: 10.3389/ijph.2024.1606736. eCollection 2024. Int J Public Health. 2024. PMID: 38660497 Free PMC article.
-
Gender and sex differences in colorectal cancer screening, diagnosis and treatment.Clin Transl Oncol. 2025 Jul;27(7):2825-2837. doi: 10.1007/s12094-024-03801-0. Epub 2025 Jan 17. Clin Transl Oncol. 2025. PMID: 39821481 Free PMC article. Review.
-
Impact of the COVID-19 pandemic on the diagnosis and treatment of onco-hematologic patients: a discussion paper.Rev Esp Quimioter. 2023 Feb;36(1):1-25. doi: 10.37201/req/087.2022. Epub 2022 Nov 2. Rev Esp Quimioter. 2023. PMID: 36322133 Free PMC article. Review.
-
Prognostic nomogram to predict the overall survival of patients with early-onset colorectal cancer: a population-based analysis.Int J Colorectal Dis. 2021 Sep;36(9):1981-1993. doi: 10.1007/s00384-021-03992-w. Epub 2021 Jul 29. Int J Colorectal Dis. 2021. PMID: 34322745 Free PMC article. Clinical Trial.
References
-
- Ferlay J, Ervik M, Lam F, et al. Global Cancer Observatory: Cancer Today. Lyon; 2018.
-
- World Bank. The Impact of Aging on Economic Growth. South East Europe Regular Economic Report No. 8S. Washington, DC: W.B.G.h.; 2015.
-
- Coleman MP, Forman D, Bryant H, et al. Cancer survival in Australia, Canada, Denmark, Norway, Sweden, and the UK, 1995-2007 (the international cancer benchmarking partnership): an analysis of population-based cancer registry data. Lancet. 2011;377(9760):127–138. doi:10.1016/S0140-6736(10)62231-3 - DOI - PMC - PubMed
-
- Department for Communities and Local Government. The English Indices of Deprivation 2015. 2015.
