. 2020 Jul 23;10(20):9230-9248.
doi: 10.7150/thno.45253. eCollection 2020.

Epigenetic repression of miR-17 contributed to di(2-ethylhexyl) phthalate-triggered insulin resistance by targeting Keap1-Nrf2/miR-200a axis in skeletal muscle

Affiliations

Epigenetic repression of miR-17 contributed to di(2-ethylhexyl) phthalate-triggered insulin resistance by targeting Keap1-Nrf2/miR-200a axis in skeletal muscle

Jie Wei et al. Theranostics. .

Abstract

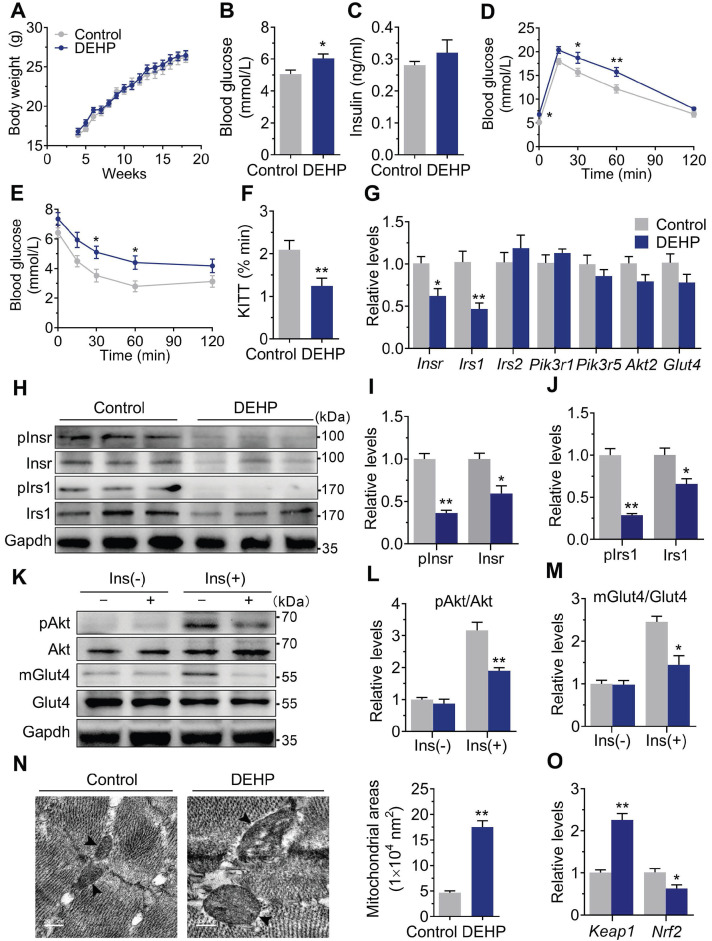
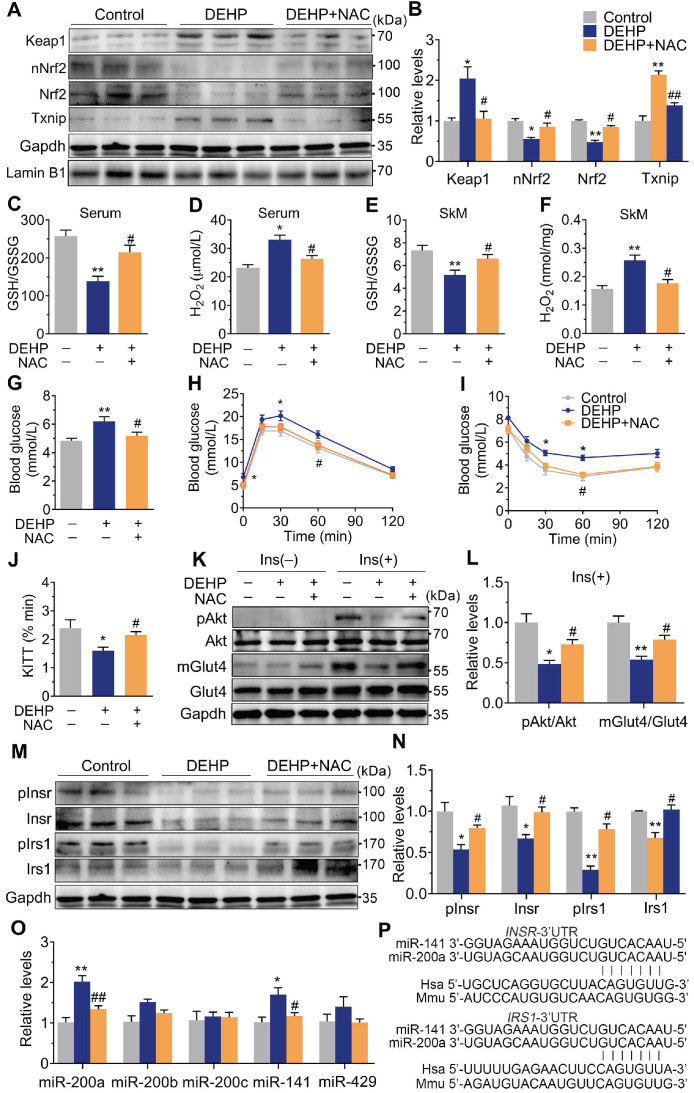
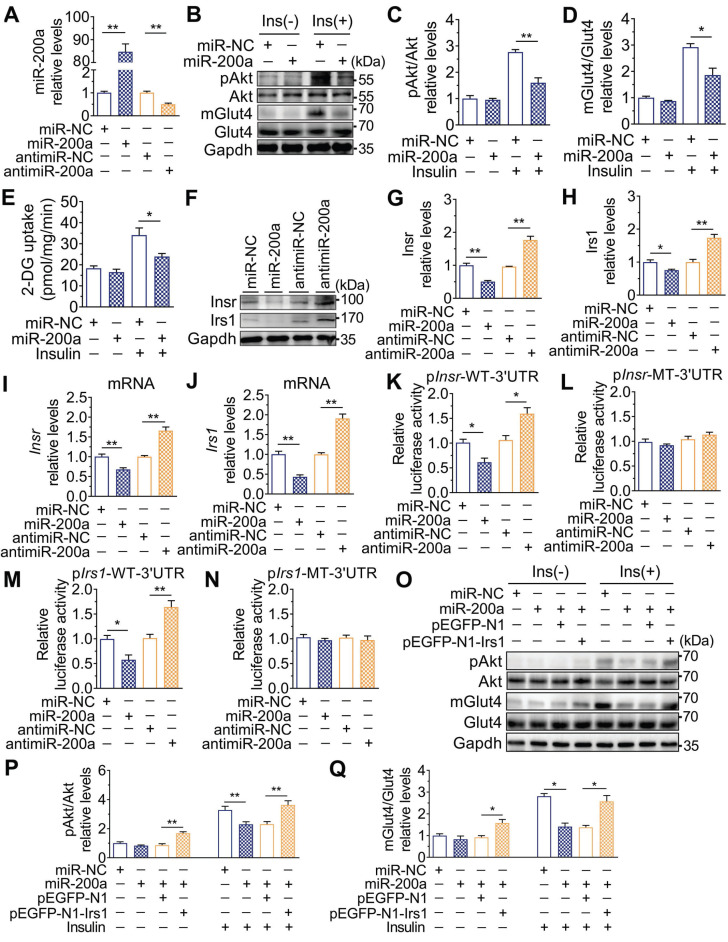
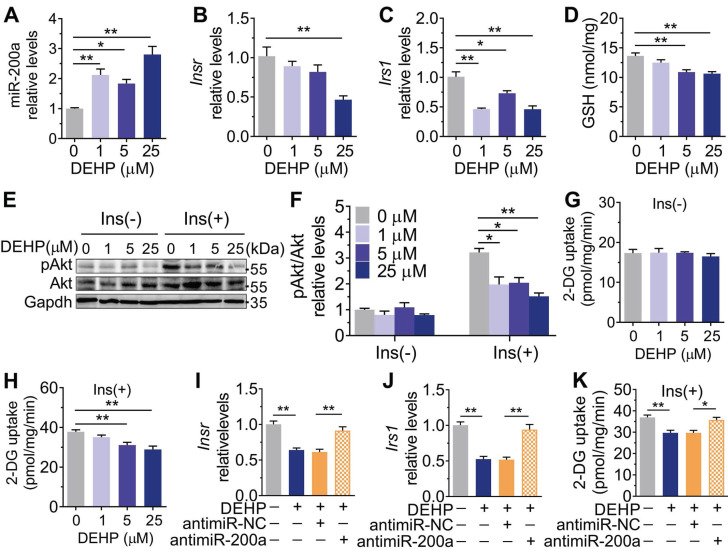
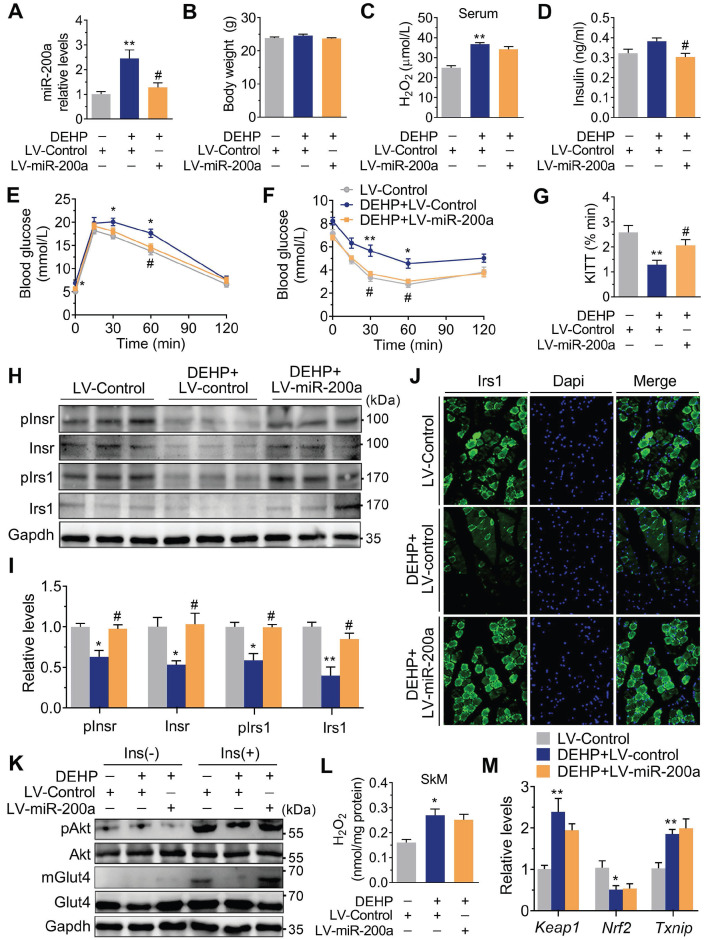
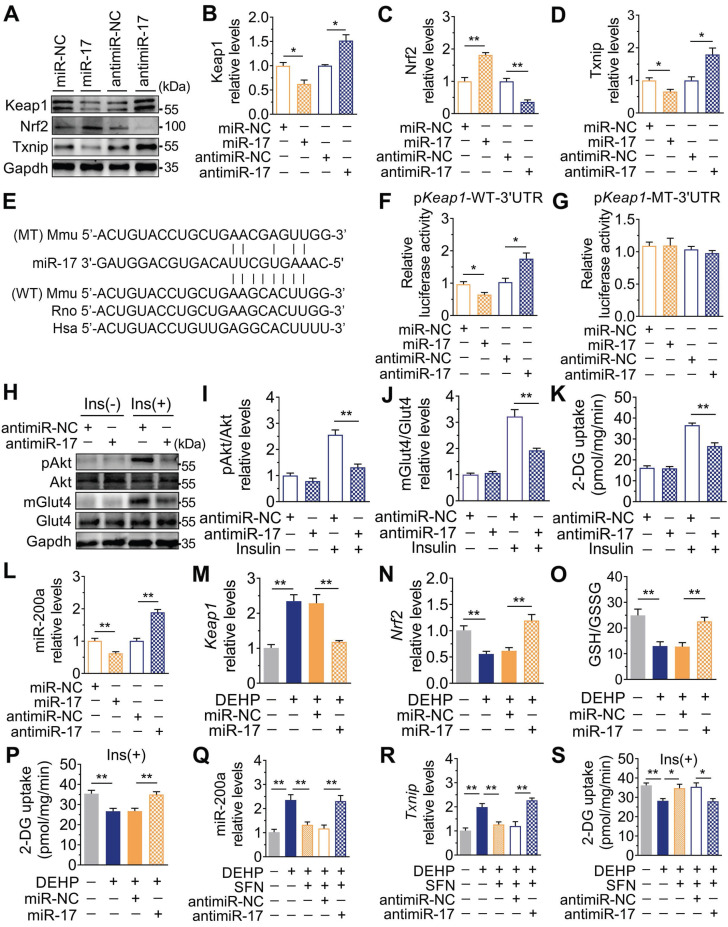
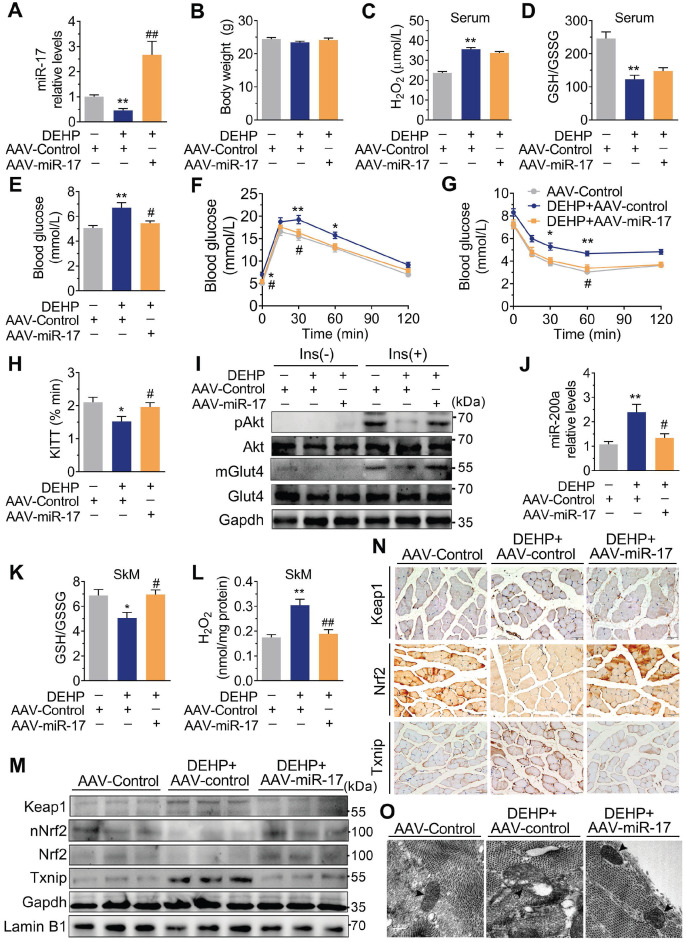
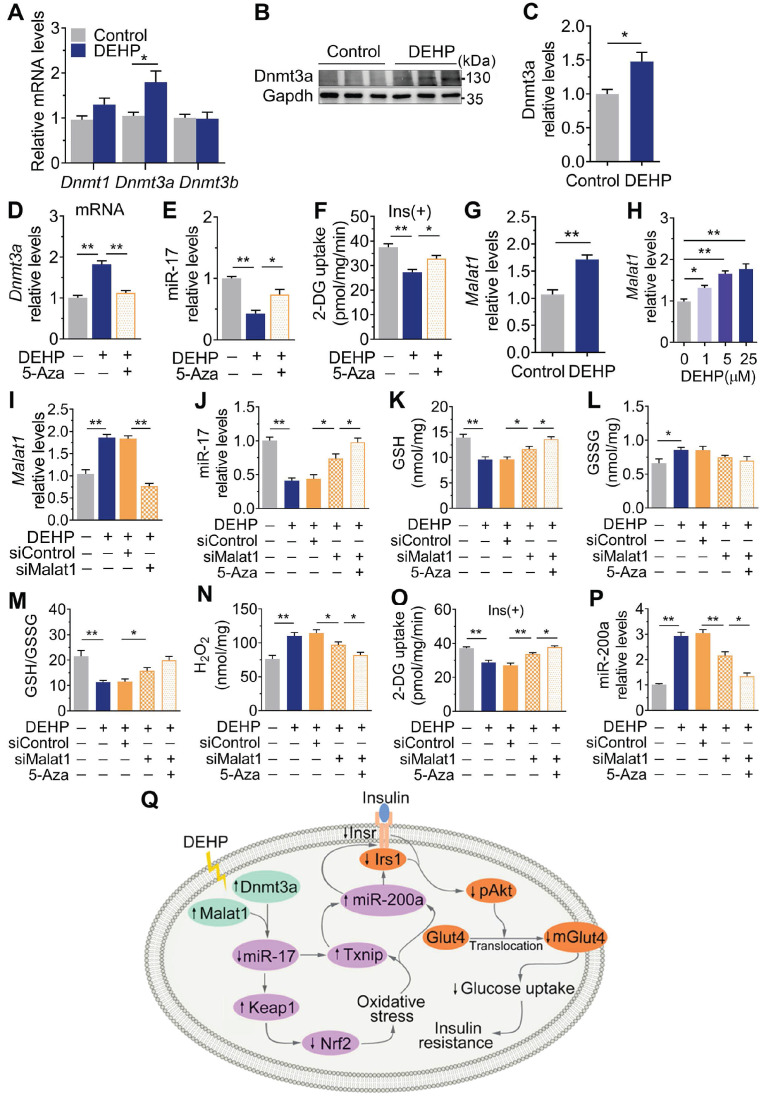
Rationale: Skeletal muscle insulin resistance is detectable before type 2 diabetes is diagnosed. Exposure to di(2-ethylhexyl) phthalate (DEHP), a typical environmental endocrine-disrupting chemical, is a novel risk factor for insulin resistance and type 2 diabetes. This study aimed to explore insulin signaling regulatory pathway in skeletal muscle of the DEHP-induced insulin-resistant mice and to investigate potential therapeutic strategies for treating insulin resistance. Methods: C57BL/6J male mice were exposed to 2 mg/kg/day DEHP for 15 weeks. Whole-body glucose homeostasis, oxidative stress and deregulated miRNA-mediated molecular transduction in skeletal muscle were examined. microRNA (miRNA) interventions based on lentiviruses and adeno-associated viruses 9 (AAV9) were performed. Results: Dnmt3a-dependent promoter methylation and lncRNA Malat1-related sponge functions cooperatively downregulated miR-17 in DEHP-exposed skeletal muscle cells. DEHP suppressed miR-17 to disrupt the Keap1-Nrf2 redox system and to activate oxidative stress-responsive Txnip in skeletal muscle. Oxidative stress upregulated miR-200a, which directly targets the 3'UTR of Insr and Irs1, leading to hindered insulin signaling and impaired insulin-dependent glucose uptake in skeletal muscle, ultimately promoting the development of insulin resistance. AAV9-induced overexpression of miR-17 and lentivirus-mediated silencing of miR-200a in skeletal muscle ameliorated whole-body insulin resistance in DEHP-exposed mice. Conclusions: The miR-17/Keap1-Nrf2/miR-200a axis contributed to DEHP-induced insulin resistance. miR-17 is a positive regulator, whereas miR-200a is a negative regulator of insulin signaling in skeletal muscle, and both miRNAs have the potential to become therapeutic targets for preventing and treating insulin resistance or type 2 diabetes.

Keywords: Environmental endocrine-disrupting chemical; Insulin resistance; Oxidative stress; Skeletal muscle; microRNA.


Conflict of interest statement

Competing Interests: The authors have declared that no competing interest exists.

Figures

Figure 1
Figure 1
Exposure to DEHP induced IR. A. The weekly body weight (n = 10 mice per group). B. The fasting blood glucose (n = 10 mice per group). C. The fasting serum insulin (n = 10 mice per group). D. The dynamics of blood glucose curve during intraperitoneal glucose tolerance test (IPGTT, 2 g/kg bw, n = 5 mice per group). The quantification of total area under the curve (AUC) for IPGTT were shown in Figure S1C. E. The insulin sensitivity assessed by insulin tolerance test (ITT, 0.75 U/kg, n = 5 mice per group). F. The calculated constant rate for glucose disappearance (KITT) from 0 to 30 min of ITT. G. The mRNA expression of genes related to insulin signaling pathway in SkM (n = 4 mice per group). Gapdh was used as the loading control. H-J. The protein expression and phosphorylation of Insr and Irs1 in SkM (n = 3 mice per group). Gapdh was used as the loading control. K-M. The representative western blot images (K) and quantification (L-M) of insulin-stimulated phosphorylation of Akt (pAkt, ser473) and Glut4 translocation in SkM (n = 3 mice per group). mGlut4: Glut4 in plasma membrane, Glut4: Glut4 in total homogenate. All quantitative results were normalized by Gapdh. N. The representative TEM images and quantification of mitochondrial areas in SkM. Mitochondria were indicated by black arrowheads. The average mitochondrial area was determined by manually circling 15 mitochondria within the SkM per mice (n = 3 mice per group, Scale bar = 200nm). O. The mRNA expression of Keap1 and Nrf2 in SkM (n = 4 mice per group). Expression level were normalized to Gapdh. All data were presented as the mean ± SEM. *P < 0.05 control mice vs. DEHP-exposed mice, **P < 0.01 control mice vs. DEHP-exposed mice.
Figure 2
Figure 2
NAC Prevented DEHP-induced IR. A-B. The representative western blot images and quantification of oxidative stress-related genes (n = 3 mice per group). The total protein was normalized by Gapdh and the protein expression of Nrf2 in nuclear were normalized by Lamin B1. C. The calculated GSH/GSSG ratio in serum (n = 5 mice per group). The serum levels of reduced glutathione (GSH) and oxidized glutathione (GSSG) were shown in Figure S2C-D. D. The serum level of H2O2 (n = 5 mice per group). E. The calculated GSH/GSSG ratio in SkM (n = 5 mice per group). The levels of GSH and GSSG in SkM were shown in Figure S2E-F. F. The content of H2O2 normalized to protein content in SkM (n = 5 mice per group). G. The fasting blood glucose (n = 10 mice per group). H. The IPGTT (n = 5 mice per group). The AUC of the IPGTT were shown in Figure S2G. I. ITT (n = 5 mice per group). J. The KITT obtained in ITT (0-30min). K-L. The representative western blot images (K) and quantification (L) of insulin-stimulated pAkt and the Glut4 translocation in SkM (n = 3 mice per group). The basal levels (without insulin stimulation) of pAkt and mGlut4 was shown in Figure S2H. M-N. The expression and phosphorylation of Insr and Irs1 in SkM. Quantitative results were normalized by Gapdh (n = 3 mice per group). O. The expression of miR-200 family in SkM of mice (n = 4 mice per group). U6 was used to normalized miRNA expression. P. The putative sequence interactions between miR-200a (miR-141) and 3'UTR of Insr and Irs1, respectively. Mmu, mouse; Hsa, human. All data were presented as the mean ± SEM. *P < 0.05 control mice vs. DEHP-exposed mice, **P < 0.01 control mice vs. DEHP-exposed mice. #P < 0.05 DEHP-exposed mice vs. DEHP-exposed mice co-treated with NAC, ##P < 0.01 DEHP-exposed mice vs. DEHP-exposed mice co-treated with NAC.
Figure 3
Figure 3
Upregulation of miR-200a impaired insulin sensitivity by targeting Insr and Irs1 in SkM cells. C2C12 myotubes were transfected with 50 nM agomiR-200a or 200 nM antagomir-200a for 48 h. A. The expression of miR-200a normalized by U6 (n = 4 independent experiments). B-D. The insulin-stimulated pAkt and the Glut4 translocation in miR-200a-overexpressing and miR-200a-inhibiting C2C12 myotubes (n = 3 independent experiments). Gapdh was used as the loading control. E. The 2-deoxyglucose (2-DG) uptake in miR-200a-overexpressing and miR-200a-inhibiting C2C12 myotubes (n = 3 independent experiments). F-J. The protein (F-H) and mRNA (I-J) expression of Insr and Irs1. Gapdh was used as the loading control (n = 3 independent experiments). K and M. The relative luciferase activity in C2C12 myoblasts transfected with reporter vector containing the wild Insr (H) or Irs1 (J) 3'UTR together with agomiR-200a, antagomiR-200a or corresponding control (n = 4 independent experiments). The location of the miR-200a binding sites were shown in Figure 2P. L and N. The relative luciferase activity in the C2C12 myoblasts transfected with reporter vector containing the mutant Insr (I) or Irs1 (K) 3'UTR together with agomiR-200a, antagomiR-200a or corresponding control (n = 4 independent experiments). Mutated miR-26a binding site was shown in Table S1. O-Q. The insulin stimulated Akt phosphorylation and Glut4 translocation in C2C12 myotubes cotransfected with agomiR-200a and transfected with pEGFP-N1-Irs1 plasmid (n = 3 independent experiments). Gapdh was used as the loading control. All data were presented as the mean ± SEM. *P < 0.05, **P < 0.01 vs. corresponding control as indicated.
Figure 4
Figure 4
The role of DEHP exposure in C2C12 myotubes. A-G. C2C12 myotubes were treated with serial concentrations of DEHP for 48 h (n = 3 independent experiments). A. The expression of miR-200a normalized by U6. B-C. The mRNA expression of Insr (B) and Irs1(C) normalized by Gapdh. D. The content of GSH normalized to protein content in DEHP-exposed C2C12 myotubes. E-F. The representative western blot images (E) and quantification (F) of pAkt in DEHP-exposed C2C12 myotubes. Gapdh was used as the loading control. G-H. The basal (G) and insulin-stimulated (H) 2-DG uptake in DEHP-exposed C2C12 myotubes. I-J. The mRNA expression of Insr (I) and Irs1 (J) in C2C12 myotubes transfected with 200 nM antagomir-200a and treated with 25 µM DEHP (n = 3 independent experiments). Gapdh was used as the loading control. K. The insulin-stimulated 2-DG uptake in C2C12 myotubes transfected with 200 nM antagomir-200a and treated with 25 µM DEHP (n = 3 independent experiments). All data were presented as the mean ± SEM. *P < 0.05, **P < 0.01 vs. corresponding control as indicated.
Figure 5
Figure 5
Inhibition of miR-200a improved DEHP-induced IR. DEHP-exposed mice were infected with control lentivirus (LV-Control) or anti-miR-200a lentivirus (LV-miR-200a) (n = 6 mice per group). A. The expression of miR-200a in SkM. U6 was used to normalized miR-200a expression (n = 3 mice per group). B. The body weight (n = 6 mice per group). C. The serum level of H2O2 (n = 6 mice per group). D. The fasting serum insulin (n = 6 per group). E. The IPGTT (n = 5 mice per group). The calculated AUC of the IPGTT were shown in Figure S4B. F. The ITT (n = 5 mice per group). G. The KITT obtained in the ITT (0-30min). H-I. The expression and phosphorylation of Insr and Irs1 in SkM. Quantitative results (I) were normalized by Gapdh (n = 3 mice per group). J. The immunofluorescent detection of Irs1 in SkM (400×, n = 3 mice per group). Nucleus was stained with Dapi (blue) and Irs1 was probed with a primary anti-Irs1 antibody (green). K. The insulin stimulated pAkt and mGlut4 in SkM. Quantitative results were normalized by Gapdh and shown in Figure S4C (n = 3 mice per group). L. The H2O2 content normalized to protein content in SkM (n = 3 mice per group). M. The mRNA expression of genes related to oxidative stress. Gapdh was used as the loading control (n = 3 mice per group). All data were presented as the mean ± SEM. *P < 0.05 DEHP-exposed mice infected with LV-Control vs. control mice infected with LV-Control, **P < 0.01 DEHP-exposed mice infected with LV-Control vs. control mice infected with LV-Control. #P < 0.05 DEHP-exposed mice infected with LV-Control vs. DEHP-exposed mice infected with LV-miR-200a.
Figure 6
Figure 6
Downregulation of miR-17 impaired glucose uptake by promoting oxidative stress via targeting keap1. A-D. The representative western blot images (A) and quantification (B-D) of genes related to oxidative stress. Gapdh was used as the loading control. C2C12 myotubes were transfected with 50 nM agomiR-17 or 200 nM antagomir-17 for 48 h (n = 3 independent experiments). E. The miR-17 target regions in 3'UTR of Keap1. Mmu, mouse; Rno, rat; Hsa, human. WT: a truncated Keap1-3'UTR with wild-type miR-17 binding site; MT: a truncated Keap1-3'UTR with mutated miR-17 binding site. F-G. The relative luciferase activity in C2C12 myoblasts transfected with reporter vector containing the wild-type (F) or mutated (G) Keap1 3'UTR together with agomiR-17, antagomiR-17 or corresponding controls (n = 4 independent experiments). H-J. The representative western blot images (H) and quantification (I-J) of pAkt and mGlut4 in C2C12 myotubes treated with antagomiR-17 (n = 3 independent experiments). Gapdh was used as the loading control. K. The insulin-stimulated 2-DG uptake in C2C12 myotubes treated with antagomiR-17 (n = 3 independent experiments). L. The expression of miR-200a in C2C12 myotubes transfected with agomiR-17 and antagomiR-17 (n = 3 independent experiments). U6 was used to normalized miR-200a expression. M-P. C2C12 myotubes were transfected with 50 nM agomiR-17 and treated with 25 µM DEHP (n = 3 independent experiments). M-N. The mRNA expression of Keap1 and Nrf2. Gapdh was used as the loading control. O. The calculated GSH/GSSG ratio. The levels of GSH and GSSG were shown in Figure S8C-D. P. The insulin-stimulated 2-DG uptake. Q-S. C2C12 myotubes were co-treated with 25 µM DEHP, antagomir-17, SFN or corresponding controls (n = 3 independent experiments). Q. The expression of miR-200a normalized by U6. R. The mRNA expression of Txnip. Gapdh was used as the loading control. S. The insulin-stimulated 2-DG uptake. All data were presented as the mean ± SEM. *P < 0.05, **P < 0.01 vs. corresponding control as indicated.
Figure 7
Figure 7
Overexpression of miR-17 in SkM was resistant to DEHP-induced oxidative stress and IR. The miR-17 was overexpressed in SkM of DEHP-exposed mice using recombinant adeno-associated virus 9 (AAV9) delivery method (n = 6 mice per group). A. The expression of miR-17 in SkM. U6 was used to normalized miR-17 expression (n = 3 mice per group). B. The Body weight (n = 6 mice per group). C. The serum level of H2O2 (n = 5 mice per group). D. The GSH/GSSG ratio calculated by the serum levels of GSH (Figure S9B) and GSSG (Figure S9C) (n = 5 mice per group). E. The fasting blood glucose level (n = 6 mice per group). F. The IPGTT (n = 5 mice per group). The calculated AUC of the IPGTT were shown in Figure S9D. G. The ITT (n = 5 mice per group). H. The KITT obtained in the ITT (0-30min). I. The representative western blot images of pAkt and mGlut4 in SkM (n = 3 mice per group). Gapdh was used as the loading control and the quantification data were shown in Figure S9E-F. J. The expression of miR-200a in SkM. U6 was used to normalized miR-200a expression (n = 3 mice per group). K. The GSH/GSSG ratio in SkM (n = 3 mice per group). Levels of GSH and GSSG were shown in Figure S9G-H, respectively. L. The H2O2 content in SkM (n = 3 mice per group). M. The representative western blot images of genes related to oxidative stress (n = 3 mice per group). The total protein was normalized by Gapdh and the protein expression of Nrf2 in nuclear were normalized by Lamin B1. The quantification data were shown in Figure S9I. N. The representative images of immunohistochemical staining of genes related to oxidative stress. (Scale bar = 50 µm). O. The representative TEM images of SkM (Scale bar = 200nm, n = 3 mice per group). Mitochondria were indicated by black arrowheads. Calculation of mitochondrial area was shown in the Figure S9J. All data were presented as the mean ± SEM. *P < 0.05 control mice infected with AAV-Control vs. DEHP-exposed mice infected with AAV-Control, **P < 0.01 control mice infected with AAV-Control vs. DEHP-exposed mice infected with AAV-Control. #P < 0.05 DEHP-exposed mice infected with AAV-Control vs. DEHP-exposed mice infected with AAV-miR-17, ##P < 0.01 DEHP-exposed mice infected with AAV-Control vs. DEHP-exposed mice infected with AAV-miR-17.
Figure 8
Figure 8
Dnmt3a and lncRNA Malat1 cooperatively suppressed miR-17 in SkM. A-C. The mRNA (A) and protein (B-C) levels of DNA methyltransferase in SkM of DEHP-exposed mice (n = 4 mice per group qRT-PCR analysis and n = 3 mice per group for western blot). Gapdh was used as the loading control. D. The mRNA expression of Dnmt3a in DEHP-exposed C2C12 myotubes co-treated with 5-Aza (n = 3 independent experiments). Gapdh was used as the loading control. E. The expression of miR-17 in DEHP-exposed C2C12 myotubes co-treated with 5-Aza (n = 3 independent experiments). U6 was used to normalized miR-17 expression. F. The insulin-stimulated 2-DG uptake in DEHP-exposed C2C12 myotubes co-treated with 5-Aza (n = 3 independent experiments). G-H. The expression of lncRNA Malat1 in SkM of DEHP-exposed mice (G, n = 4 mice per group) and DEHP-treated C2C12 myotubes (H, n = 3 independent experiments). Gapdh was used as the loading control. I. The expression of lncRNA Malat1 in C2C12 myotubes transfected with lncRNA Malat1 siRNAs and treated with 25 µM DEHP (n = 3 independent experiments). Gapdh was used as the loading control. J-O. C2C12 myotubes were co-treated with 25 µM DEHP, 5-Aza, Txnip siRNAs or corresponding control (n = 3 independent experiments). J. The expression of miR-17 normalized by U6. K. The GSH content normalized to protein content in C2C12 myotubes. L. The GSSG content normalized to protein content in C2C12 myotubes. M. The calculated GSH/GSSG ratio. N. The H2O2 content. O. The insulin-stimulated 2-DG uptake. P. The expression of miR-200a normalized by U6. Q. The proposed signaling pathway involved in DEHP-induced IR. All data were presented as the mean ± SEM. *P < 0.05, **P < 0.01 vs. corresponding control as indicated.

Similar articles

Cited by

References

    1. Lind PM, Lind L. Endocrine-disrupting chemicals and risk of diabetes: an evidence-based review. Diabetologia. 2018;61:1495–502. - PMC - PubMed
    1. Dales RE, Kauri LM, Cakmak S. The associations between phthalate exposure and insulin resistance, beta-cell function and blood glucose control in a population-based sample. Sci Total Environ. 2018;612:1287–92. - PubMed
    1. Attina TM, Trasande L. Association of Exposure to Di-2-Ethylhexylphthalate Replacements With Increased Insulin Resistance in Adolescents From NHANES 2009-2012. J Clin Endocrinol Metab. 2015;100:2640–50. - PMC - PubMed
    1. Trasande L, Spanier AJ, Sathyanarayana S, Attina TM, Blustein J. Urinary phthalates and increased insulin resistance in adolescents. Pediatrics. 2013;132:e646–55. - PMC - PubMed
    1. Stahlhut RW, van Wijngaarden E, Dye TD, Cook S, Swan SH. Concentrations of urinary phthalate metabolites are associated with increased waist circumference and insulin resistance in adult U.S. males. Environ Health Perspect. 2007;115:876–82. - PMC - PubMed

Publication types

MeSH terms