. 2020 Jul 23;10(20):9280-9302.
doi: 10.7150/thno.46566. eCollection 2020.

TFE3, a potential therapeutic target for Spinal Cord Injury via augmenting autophagy flux and alleviating ER stress

Affiliations

TFE3, a potential therapeutic target for Spinal Cord Injury via augmenting autophagy flux and alleviating ER stress

Kailiang Zhou et al. Theranostics. .

Abstract

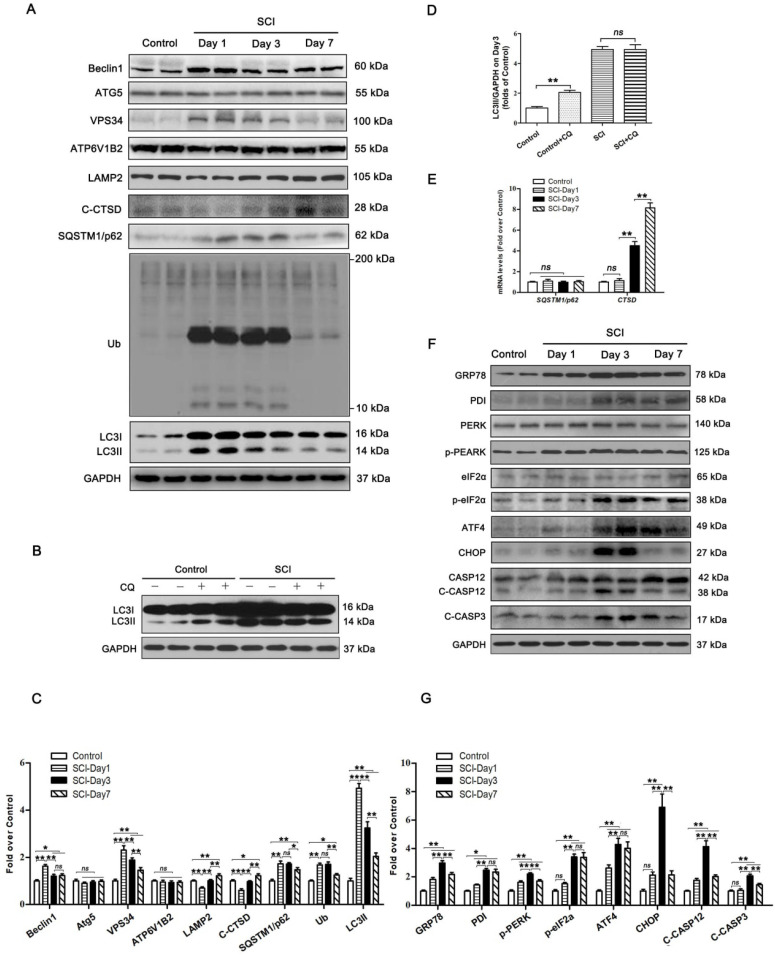
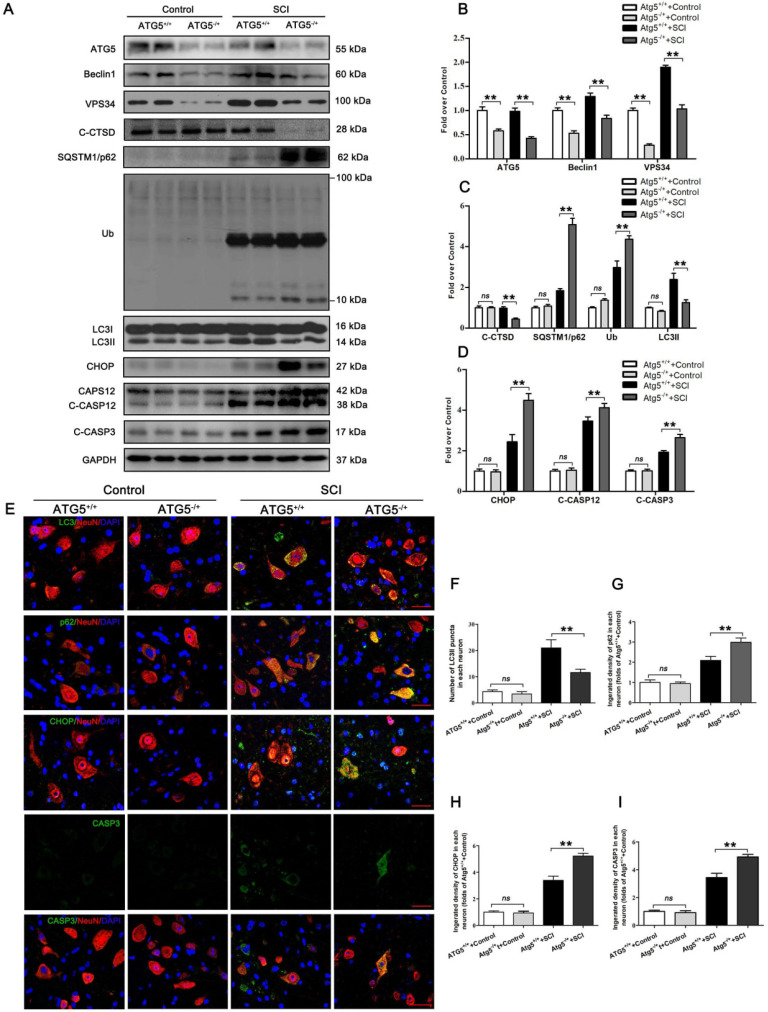
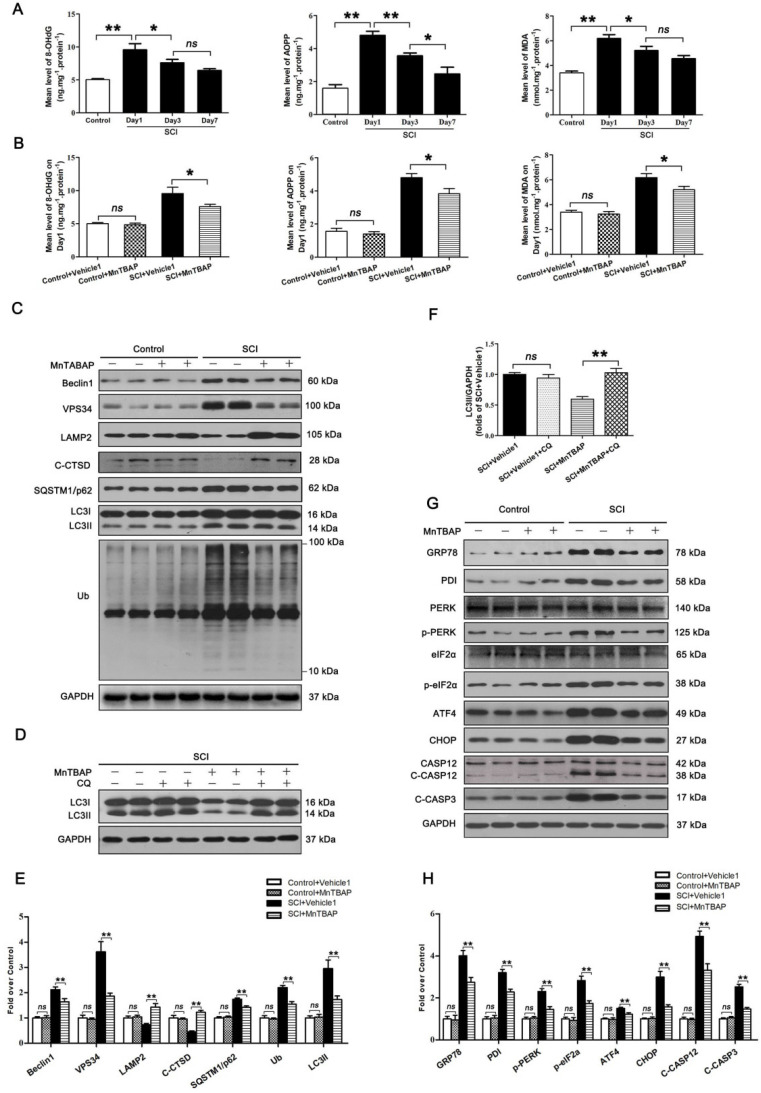
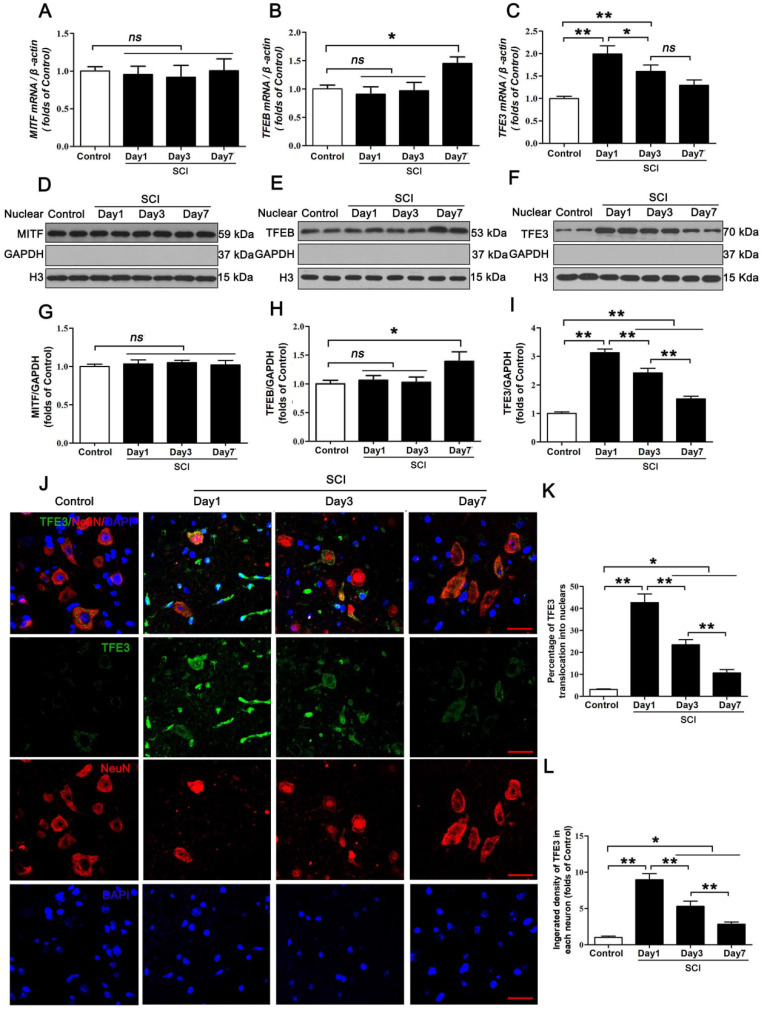
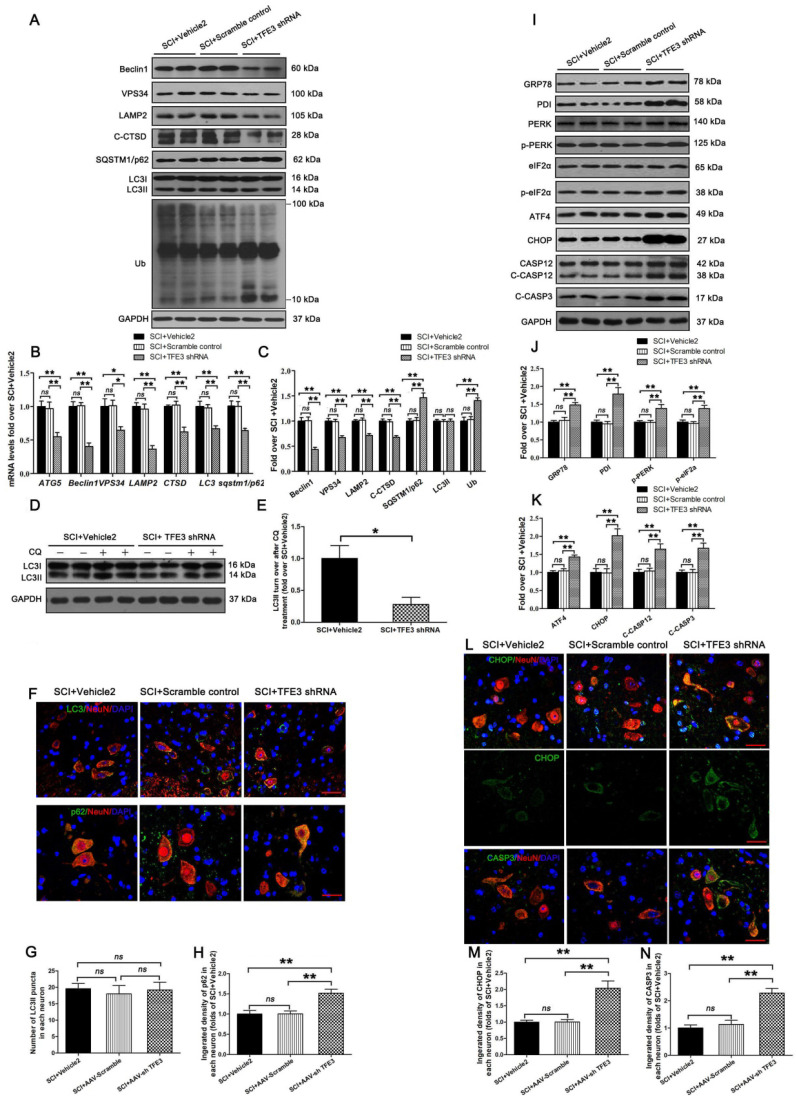
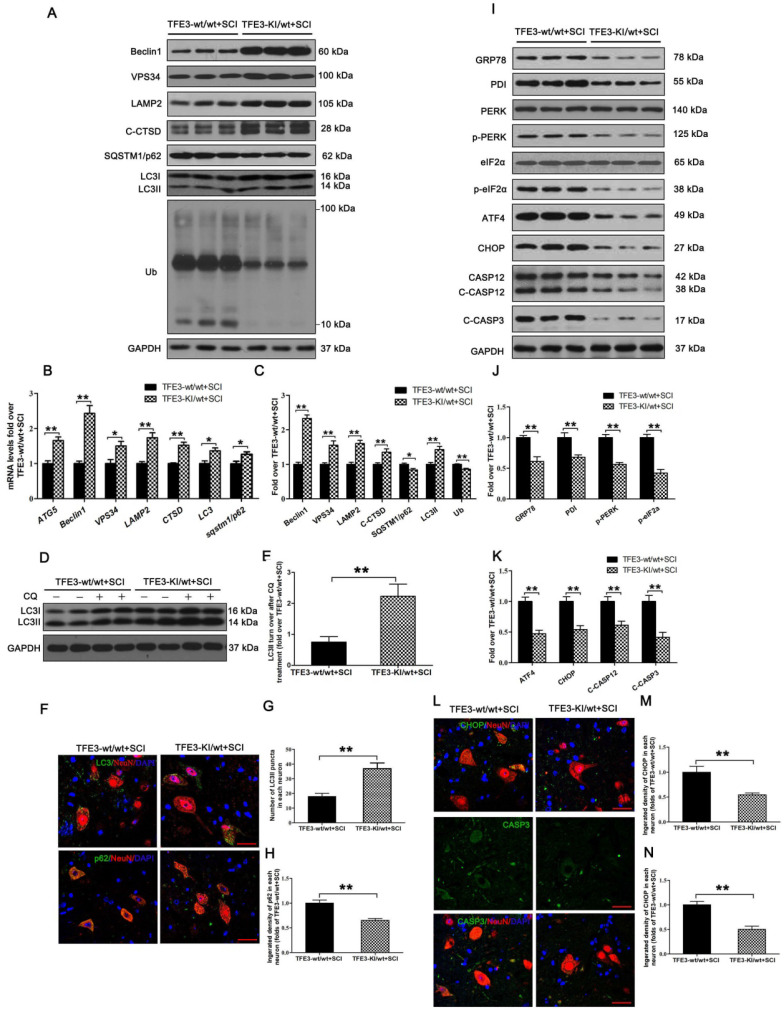
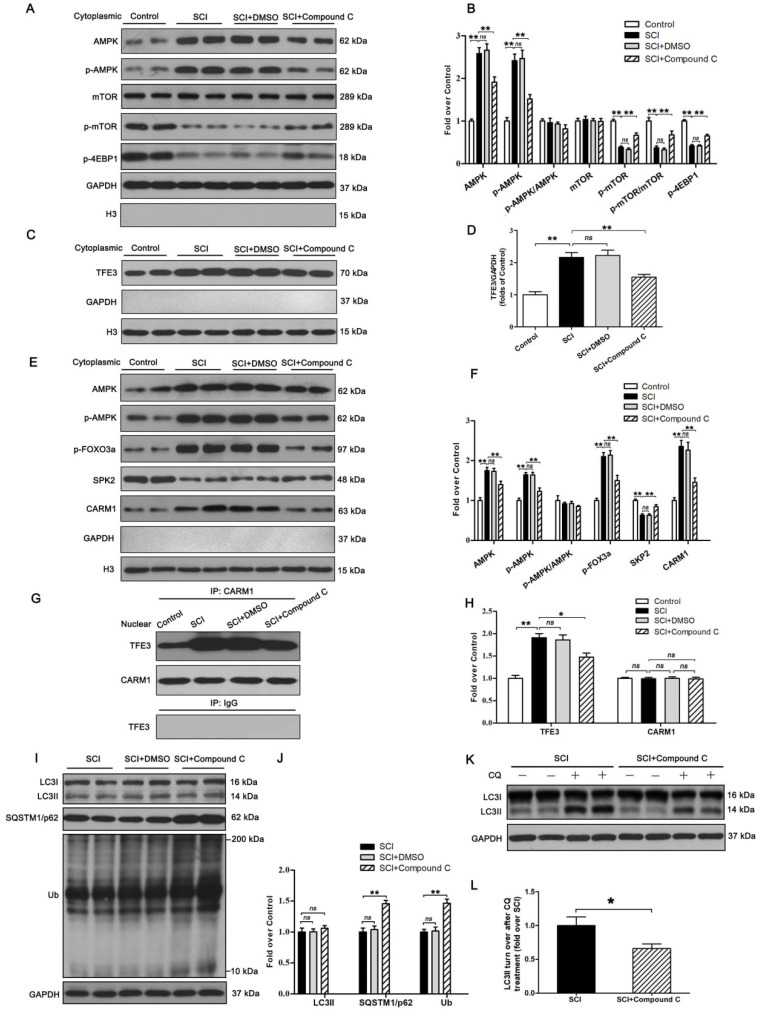
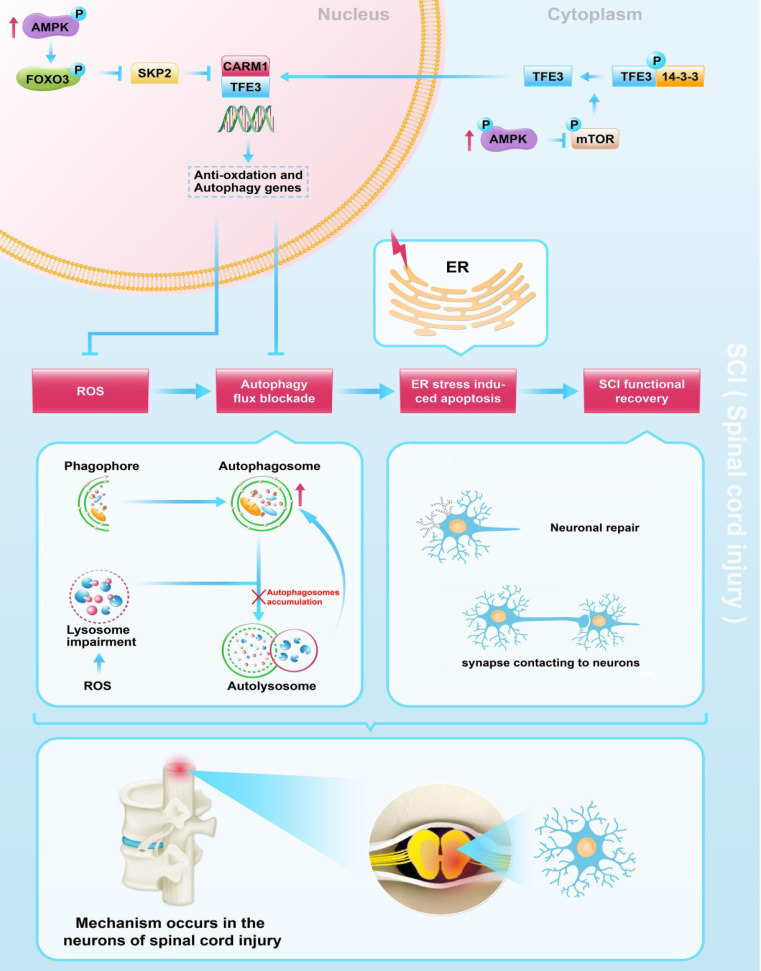
Background and Aim: Increasing evidence suggests that spinal cord injury (SCI)-induced defects in autophagic flux may contribute to an impaired ability for neurological repair following injury. Transcription factor E3 (TFE3) plays a crucial role in oxidative metabolism, lysosomal homeostasis, and autophagy induction. Here, we investigated the role of TFE3 in modulating autophagy following SCI and explored its impact on neurological recovery. Methods: Histological analysis via HE, Nissl and Mason staining, survival rate analysis, and behavioral testing via BMS and footprint analysis were used to determine functional recovery after SCI. Quantitative real-time polymerase chain reaction, Western blotting, immunofluorescence, TUNEL staining, enzyme-linked immunosorbent assays, and immunoprecipitation were applied to examine levels of autophagy flux, ER-stress-induced apoptosis, oxidative stress, and AMPK related signaling pathways. In vitro studies using PC12 cells were performed to discern the relationship between ROS accumulation and autophagy flux blockade. Results: Our results showed that in SCI, defects in autophagy flux contributes to ER stress, leading to neuronal death. Furthermore, SCI enhances the production of reactive oxygen species (ROS) that induce lysosomal dysfunction to impair autophagy flux. We also showed that TFE3 levels are inversely correlated with ROS levels, and increased TFE3 levels can lead to improved outcomes. Finally, we showed that activation of TFE3 after SCI is partly regulated by AMPK-mTOR and AMPK-SKP2-CARM1 signaling pathways. Conclusions: TFE3 is an important regulator in ROS-mediated autophagy dysfunction following SCI, and TFE3 may serve as a promising target for developing treatments for SCI.

Keywords: AMPK signaling pathways; Autophagy; ER stress-induced apoptosis; Spinal cord injury; TFE3.


Conflict of interest statement

Competing Interests: The authors have declared that no competing interest exists.

Figures

Figure 1
Figure 1
SCI leads to autophagy flux blockade and ER stress-induced apoptosis. (A) Western blotting of autophagy flux markers, Beclin1, ATG5, VPS34, ATP6V1B2, LAMP2, C-CTSD, SQSTM1/p62, UB and LC3 in spinal cord tissue from Control and SCI mice at the indicated time points. (B) Representative Western blotting of LC3 in Control and SCI (Day1) spinal cord slides cultured in the presence or absence of CQ. (C) Densitometric analysis of Beclin1, ATG5, VPS34, ATP6V1B2, LAMP2, C-CTSD, SQSTM1/p62, UB and LC3II data from (A) normalized to loading control GAPDH. (D) Densitometric analysis of LC3II from (C) normalized to the loading control GAPDH. (E) Relative mRNA level of Sqstm1/p62 and Ctsd in the spinal cord from Control an SCI mice normalized to control β-actin at the indicated time points. (F) Western blot analysis of ER stress-induced apoptosis markers, GRP78, PDI, PERK, p-PERK, eIF2α, p-eIF2α, ATF4, CHOP, CASP12, C-CASP12, CASP3 and C-CASP3 in Control and SCI groups. (G) Densitometric analysis of GRP78, PDI, p-PERK, p-eIF2α, ATF4, CHOP, C-CASP12 and C-CASP3 from (F) normalized to loading control GAPDH. n=6, ns stands for not significant, *P<0.05, **P<0.01.
Figure 2
Figure 2
Inhibition of autophagy activity aggravates ER stress-induced apoptosis after SCI. (A) Western blot analysis of autophagy flux markers (ATG5, Beclin1, VPS34, C-CTSD, SQSTM1/p62, UB and LC3) and ER stress-induced apoptosis markers (CHOP, CASP12, C-CASP12, C-CASP3) in spinal cord lesions from ATG5-/+ mice and ATG5+/+ mice with and without SCI, at Day3 after SCI. (B, C) The levels of the autophagy flux makers from (A) normalized to loading control GAPDH. (D) The expressions of ER stress-induced apoptosis markers from (A) normalized to loading control GAPDH. (E) Image (30×) of spinal cord sections from the indicated groups at Day 3 stained with antibodies against LC3II/NeuN, p62/NeuN, CHOP/NeuN,and CASP3/NeuN, respectively. Scale bar: 25 µm. (F) Quantification of immunofluorescence data from (E) showing the mean number of LC3II in motor neurons at the spinal cord. (G-I) Quantification of immunofluorescence data from (E) showing the mean optical density of p62, CHOP, and CASP3, respectively, in motor neurons of spinal cord. n=6, ns stands for not significant, *P<0.05, **P<0.01.
Figure 3
Figure 3
ROS-induced lysosomal dysfuntion initiates autophagy flux blockade and ER stress-induced apoptosis after SCI. (A) ELISA of oxidation products 8-OHdG, AOPP, and MDA in spinal cord lesions from Control and SCI mice at the indicated time points. (B) ELISA of 8-OHdG, AOPP, and MDA in spinal cord lesions from mice grouped as indicated at Day1 after SCI. (C) Western blotting of Beclin1, VPS34, C-CTSD, SQSTM1/p62, UB and LC3 in spinal cord from non-SCI (Control) mice and SCI mice treated with MnTBAP or Vehicle1 at Day1 after SCI. (D) Western blot analysis of LC3 in SCI+Vehicle1, and SCI treated with MnTBAP spinal cord slides at Day1 cultured in the presence or absence of CQ. (E) Densitometric analysis of Beclin1, VPS34, ATP6V1B2, LAMP2, C-CTSD, SQSTM1/p62, UB and LC3II from (C) normalized to loading control GAPDH. (F) Densitometric analysis of LC3II from (D) normalized to the loading control GAPDH. (G) Western blot analysis of GRP78, PDI, PERK, p-PERK, eIF2α, p-eIF2α, ATF4, CHOP, CASP12, C-CASP12, and C-CASP3 in spinal cord lesions from the grouped mice on Day3. (H) Densitometric analysis of GRP78, PDI, p-PERK, p-eIF2α, ATF4, CHOP, C-CASP12 and C-CASP3 from (G) normalized to loading control GAPDH. n=6, ns stands for not significant, *P<0.05, **P<0.01.
Figure 4
Figure 4
Expressions of the MiTF/TFE family of transcription factors in neurons following SCI. (A-C) Relative mRNA level of MiTF/TFE family of transcription factors, including Mitf, Tfeb and Tfe3, in the spinal cord lesions of non-injury (Control) and SCI mice normalized to control β-actin at the indicated time points. (D-F) Representative Western blotting of MITF, TFEB and TFE3 in Control and SCI mice normalized to loading control GAPDH at specified time points. (G-I) Densitometric analysis of MITF, TFEB and TFE3 data from (D-F) normalized to loading control GAPDH. (J) Image (30×) of spinal cord sections from the indicated groups stained with antibodies against TFE3/NeuN. Scale bar: 25 µm. (K-L) Quantification of immunofluorescence data from (J) showing the percentage of TFE3 nuclear translocation and the mean optical density of TFE3 in spinal cord motor neurons. n=6, ns stands for not significant, *P<0.05, **P<0.01.
Figure 5
Figure 5
Reduced expression of TFE3 abates autophagy flux and subsequently aggravates ER stress-induced apoptosis after SCI. (A) Western blot analysis of autophagy flux markers as indicated in spinal cord lesions from SCI+Vehicle2 mice, and mice injected with AAV-Scramble or AAV-shTFE3, then subjected with SCI, at Day 3. (B) Relative mRNA level of Atg5, Beclin1, Vps34, Lamp2, Ctsd, Lc3 and Sqstm1/p62 in the lesions of the indicated groups normalized to control β-actin at Day 3. (C) Corresponding densitometric analysis of the bands from (A) normalized to the loading control GAPDH. (D) Western blotting of LC3II in SCI+Vehicle2 and SCI+AAV-shTFE3 spinal cord slides cultured in the presence or absence of CQ at Day 3. (E) Densitometric analysis of LC3II from (D) with respect to the loading control GAPDH. (F) Image (30×) of spinal cord sections from the indicated groups at Day3 stained with antibodies against LC3/NeuN and p62/NeuN; scale bar: 25 µm. (G-H) Quantification of immunofluorescence data from (F) showing the mean number of LC3II and optical density of p62 in motor neurons at the spinal cord. (I) Western blot analysis of ER stress-induced apoptosis markers as indicated in the grouped mice at Day 3 after SCI. (J, K) Corresponding densitometric analysis of the bands from (I) normalized to the loading control GAPDH. (L) Image (30×) of spinal cord sections from the indicated groups at Day 3 stained with antibodies against CHOP/NeuN and CASP3/NeuN; scale bar: 25 µm. (M, N) Quantification of immunofluorescence data from (L) showing the mean optical density of CHOP and CASP3 in motor neurons at the lesion. n=6, ns stands for not significant, *P<0.05, **P<0.01.
Figure 6
Figure 6
Overexpression of TFE3 augments autophagy flux and subsequently ameliorates ER stress-induced apoptosis after SCI. (A) Western blot analysis of autophagy flux markers as indicated in the spinal cord lesion from TFE3-KI/wt mice and TFE3-wt/wt mice at Day 3 after SCI. (B) Relative mRNA level of Atg5, Beclin1, Vps34, Lamp2, Ctsd, Lc3 and Sqstm1/p62 in the lesions of both groups normalized to control β-actin at Day 3. (C) Densitometric analysis of band data from (A) with normalized to the loading control GAPDH. (D) Western blotting of LC3II in the indicated mice spinal cord slides cultured in the presence or absence of CQ at Day 3. (E) Densitometric analysis of LC3II from (D) with respect to the loading control GAPDH. (F) Image (30×) of spinal cord sections from the indicated groups at Day 3 stained with antibodies against LC3/NeuN and p62/NeuN; scale bar: 25 µm. (G-H) Quantification of immunofluorescence from (F) showing the mean number of LC3II and optical density of p62 in motor neurons at the spinal cord. (I) Representative Western blotting for ER stress-induced apoptosis markers as indicated in the both groups, at Day3 after SCI. (J, K) Densitometric analysis of the data from (I) normalized to loading control GAPDH. (L) Image (30×) of spinal cord sections from the both groups stained with antibodies against CHOP/NeuN and CASP3/NeuN; scale bar: 25 µm. (M, N) Quantification of data from (L) indicating the mean optical density of CHOP and CASP3 in motor neurons at the lesion. n=6, *P<0.05, **P<0.01.
Figure 7
Figure 7
The activity of TFE3 after SCI is regulated by AMPK-mTOR and AMPK-SKP2-CARM1 signaling pathways. (A) Western blot analysis of AMPK-mTOR signal pathway in the cytoplasm in spinal cords from the control mice, SCI mice, and SCI mice treated with DMSO or Compound C, at Day3. (B) Densitometric analysis of the AMPK, p-AMPK, p-mTOR and p-4EBP1 data from (A), normalized to the loading control GAPDH. (C) Western blotting of TFE3 nuclear translocation at the lesion for each group. (D) Corresponding densitometric analysis of the TFE3 bands in (C) normalized to the loading control H3. (E) Western blots of the AMPK-SKP2-CARM1 signaling pathway in the nucleus of the indicated groups at Day3 after SCI. (F) Densitometric analysis of AMPK, p-AMPK, p-FOXO3a, SKP2 and CARM1 bands from (E) normalized to control H3. (G) Nuclear CARM1-TFE3 complex was detected by IP in indicated groups at Day3 after SCI. (H) Densitometric analysis of TFE3 and CARM1 data from (G) normalized to loading control H3. (I) Western blot analysis of LC3, SQSTM1/p62 and UB in the spinal cord lesion of each group at Day3 after SCI. (J) Densitometric analysis of band data from (I) normalized to the loading control GAPDH. (K) Western blotting of LC3II in the indicated mice spinal cord slides cultured in the presence or absence of CQ at Day3. (L) Densitometric analysis of LC3II from (K) normalized to the loading control GAPDH. n=6, ns stands for not significant, *P<0.05, **P<0.01.
Figure 8
Figure 8
Schematic illustration of the proposed molecular mechanism highlighting the role of TFE3, ROS, and autophagy in the pathophysiology of SCI and subsequent neurological recovery.

Similar articles

Cited by

References

    1. Badhiwala JH, Wilson JR, Fehlings MG. Global burden of traumatic brain and spinal cord injury. Lancet Neurol. 2019;18:24–25. - PubMed
    1. Lipinski MM, Wu J, Faden AI, Sarkar C. Function and Mechanisms of Autophagy in Brain and Spinal Cord Trauma. Antioxid Redox Signal. 2015;23:565–77. - PMC - PubMed
    1. Liu S, Sarkar C, Dinizo M, Faden AI, Koh EY, Lipinski MM. et al. Disrupted autophagy after spinal cord injury is associated with ER stress and neuronal cell death. Cell Death Dis. 2015;6:e1582. - PMC - PubMed
    1. Beattie MS, Hermann GE, Rogers RC, Bresnahan JC. Cell death in models of spinal cord injury. Prog Brain Res. 2002;137:37–47. - PubMed
    1. Tator CH. Experimental and clinical studies of the pathophysiology and management of acute spinal cord injury. J Spinal Cord Med. 1996;19:206–14. - PubMed

Publication types

MeSH terms

Substances