. 2020 Jul 30:2020:6125638.
doi: 10.1155/2020/6125638. eCollection 2020.

Olive Leaf Polyphenols Attenuate the Clinical Course of Experimental Autoimmune Encephalomyelitis and Provide Neuroprotection by Reducing Oxidative Stress, Regulating Microglia and SIRT1, and Preserving Myelin Integrity

Affiliations

Olive Leaf Polyphenols Attenuate the Clinical Course of Experimental Autoimmune Encephalomyelitis and Provide Neuroprotection by Reducing Oxidative Stress, Regulating Microglia and SIRT1, and Preserving Myelin Integrity

Jasminka Giacometti et al. Oxid Med Cell Longev. .

Abstract

Numerous evidences suggest that plant polyphenols may have therapeutic benefits in regulating oxidative stress and providing neuroprotection in many neurodegenerative diseases, including multiple sclerosis (MS). However, these mechanisms are not yet completely understood. In this study, we investigated the effect of olive leaf polyphenols on oxidative stress through oxidation marker level and activity (TBARS, SOD, and GPX) and their protein expression (SOD1, SOD2, and GPX1), as well as the protein expression of Sirtuin 1 (SIRT1) and microglia markers (Iba-1, CD206, and iNOS) and myelin integrity (proteolipid protein expression) in the brain of rats with induced experimental autoimmune encephalomyelitis (EAE) and subjected to olive leaf therapy. Experiments were performed in male EAE DA rats, which were randomly divided into 2 main groups: EAE groups treated with the therapy of olive leaf (EAE+TOL) and untreated EAE control groups. The EAE treated groups consumed olive leaf tea instead of drinking water (ad libitum) from the beginning to the end of the experiment. In addition, olive leaf extract was injected intraperitoneally (i.p.) for the 10 continuous days and started on the 8th day after EAE induction. The clinical course was monitored in both groups until the 30th day after EAE induction. Our results demonstrated that TOL attenuated the clinical course of EAE; reduced the oxidative stress (by decreasing the concentration of MDA); upregulated antioxidant enzymes (SOD1, SOD2, and GPX1), SIRT1 (overall and microglial), and anti-inflammatory M2 microglia; downregulated proinflammatory M1 type; and preserved myelin integrity. These data support the idea that TOL may be an effective therapeutic approach for treating MS and other neurodegenerative diseases.


Conflict of interest statement

The authors have declared no conflict of interest.

Figures

Figure 1
Figure 1
Clinical course and death frequency in the EAE and EAE+TOL groups. (a) The clinical course in the EAE (n = 16) and EAE+TOL (n = 16) rat groups. Values are presented as mean ± SD (Mann–Whitney U test) using EAE scores of each animal for every day. (b) Death/survival frequency during 30 days after EAE induction. Values are presented as a number of animals per group (Fisher's exact test); p < 0.05.
Figure 2
Figure 2
Biochemical assays in the rat brain. (a) The concentration of MDA (nM/mg protein), (b) the activity of SOD (U/mg protein), and (c) the activity of GPX (U/mg protein) in the healthy untreated group (control), in the groups induced EAE after 20 days (EAE 20d) and 30 days (EAE 30d) postimmunization and EAE groups with olive leaf therapy (EAE+TOL 20d and EAE+TOL 30d). For each group, values are presented as the mean ± SD of five rats per group. One-way ANOVA followed by the post hoc Scheffé test was used for the statistical analysis: ∗p < 0.05, ∗∗p < 0.01, and ∗∗∗p < 0.001.
Figure 3
Figure 3
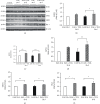
Immunoblot of SOD1, SOD2, GPX1, SIRT1, and Iba-1 in the isolated rat brain proteins. Cell lysate proteins (50 μg) were immunoblotted using β-actin as the loading control. (a) Representative western blot images of the target proteins. The expression of (b) SOD1, (c) SOD2, (d) GPX1, (e) SIRT1, and (f) Iba-1 is shown at the normalized expression level of EAE. For each group, values are presented as the mean ± SD of five rats per group. One-way ANOVA followed by the post hoc Scheffé test was used for the statistical analysis: p < 0.05, ∗∗p < 0.01, and ∗∗∗p < 0.001.
Figure 4
Figure 4
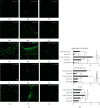
Polyphenols from olive leaf extract induce the upregulation of SIRT1 in different brain regions (hippocampus, ependyma, subventricular zone (SVZ), and cortex). (a) Representative immunofluorescent pictures show staining with anti-SIRT1 antibody in paraffin-embedded sections of the brain tissue obtained from DA rats: (A–C) untreated, (D–F) with induced EAE and the second attack (on the 20th day postinduction), (G–I) with induced EAE and treated with the olive leaf therapy (TOL) till the 20th day postinduction, (J–L) with induced EAE and the second remission (on the 30th day postinduction), and (M–O) with induced EAE and treated with TOL on the 30th day postinduction. (b) SIRT1 immunoreactivity in different brain regions. The immunofluorescent staining quantification was performed using Cell F v3.1 software analysis (12 ROI/4 μm slice × 3 slices/rat × 5 rats/group). Values are expressed as mean gray value ± SD. One-way ANOVA followed by the post hoc Scheffé test: p < 0.05, ∗∗p < 0.01, and ∗∗∗p < 0.001. Scale bars indicate 50 μm.
Figure 5
Figure 5
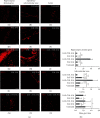
Polyphenols from olive leaf induce the upregulation of Iba-1 in different brain regions (hippocampus, ependyma, subventricular zone (SVZ), and cortex). (a) Representative immunofluorescent pictures show staining with anti-Iba-1 antibody in paraffin-embedded sections of the brain tissue obtained from DA rats: (A–C) untreated, (D–F) with induced EAE and second attack (on the 20th day postinduction), (G–I) with induced EAE and treated with the therapy of olive leaf (TOL) till the 20th day postinduction, (J–L) with induced EAE and the second remission (on the 30th day postinduction), and (M–O) with induced EAE and treated with TOL on the 30th day postinduction. (b) Iba-1 immunoreactivity in different brain regions. The immunofluorescent staining quantification was performed using Cell F v3.1 software analysis (12 ROI/4 μm slice and 3 slices/rat × 5 rats/group). Values are expressed as mean gray value ± SD. One-way ANOVA followed by the post hoc Scheffé test: p < 0.05, ∗∗p < 0.01, and ∗∗∗p < 0.001. Scale bars indicate 50 μm.
Figure 6
Figure 6
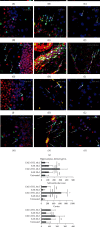
In the cerebral hippocampus, subventricular zone (SVZ), and cortex of rats treated with the therapy of olive leaf (TOL), microglia cells that abundantly express SIRT1 are present. (a) Representative immunofluorescent pictures show the relationship between SIRT1+ and Iba-1+ microglia cells in DA rats: (A–C) untreated, (D–F) with induced EAE and the second attack (on the 20th day postinduction), (G–I) with induced EAE and treated with TOL till the 20th day postinduction, (J–L) with induced EAE and the second remission (on the 30th day postinduction), and (M–O) with induced EAE and treated with TOL on the 30th day postinduction. (b) A number of Iba-1+ SIRT1+ cells were manually counted in the area of interest (0.014 mm2/4 μm slice × 3 slices/rat × 5 rats/group). Values are expressed as mean gray value ± SD of a number of cells per mm2. One-way ANOVA followed by the post hoc Scheffé test: p < 0.05, ∗∗p < 0.01, and ∗∗∗p < 0.001. Scale bars indicate 20 μm.
Figure 7
Figure 7
Polyphenols from olive leaf extract induce the upregulation of PLP in different brain regions (hippocampus, cortex, and white matter). (a) Representative immunohistochemical pictures show staining with anti-PLP antibody in paraffin-embedded sections of the brain tissue obtained from DA rats: (A–C) untreated, (D–F) with induced EAE and the second attack (on the 20th day postinduction), (G–I) with induced EAE and treated with polyphenols till the 20th day postinduction, (J–L) with induced EAE and the second remission (on the 30th day postinduction), and (M–O) with induced EAE and treated with polyphenols on the 30th day postinduction. (b) PLP immunoreactivity in different brain regions. The immunohistochemical staining quantification was performed using Cell F v3.1 software analysis (12 ROI/4 μm slice × 3 slices/rat × 5 rats/group) of representative cortex photomicrographs (C, G, K, O, T). Values are expressed as mean gray value ± SE. One-way ANOVA followed by the post hoc Scheffé test: ∗∗∗p < 0.001. Scale bars in horizontal order indicate 500 μm (for the hippocampus), 200 μm (for the cortex), 50 μm (for the cortex), and 50 μm (for the white matter).
Figure 8
Figure 8
(a) Representative immunofluorescent pictures show the relationship between iNOS+ and Iba-1+ (M1) microglia cells in the subventricular zone: untreated, with induced EAE and the second attack (on the 20th day postinduction), with induced EAE and treated with TOL till the 20th day postinduction, with induced EAE and the second remission (on the 30th day postinduction), and with induced EAE and treated with TOL on the 30th day postinduction. (b) The number of Iba-1+ iNOS+ was manually counted in the area of interest (0.053 mm2/4 μm slice × 3 slices/rat × 5 rats/group). Values are expressed as mean gray value ± SD of a number of cells per mm2. One-way ANOVA followed by the post hoc Scheffé test: ∗∗∗p < 0.001. Scale bars indicate 50 μm and 20 μm (insets).
Figure 9
Figure 9
(a) Representative immunofluorescent pictures show the relationship between CD206+ and Iba-1+ (M2) microglia cells in the subventricular zone: untreated, with induced EAE and the second attack (on the 20th day postinduction), with induced EAE and treated with TOL till the 20th day postinduction, with induced EAE and the second remission (on the 30th day postinduction), and with induced EAE and treated with TOL on the 30th day postinduction. (b) The number of Iba-1+ CD206+ cells was manually counted in the area of interest (0.053 mm2/4 μm slice × 3 slices/rat × 5 rats/group). Values are expressed as mean gray value ± SD of a number of cells per mm2. One-way ANOVA followed by the post hoc Scheffé test: ∗p < 0.05, ∗∗p < 0.01, and ∗∗∗p < 0.001. Scale bars indicate 50 μm and 20 μm (insets).

Similar articles

Cited by

References

    1. Adamczyk B., Niedziela N., Adamczyk-Sowa M. Novel approaches of oxidative stress mechanisms in the multiple sclerosis pathophysiology and therapy. In: Zagon I. S., McLaughlin P. J., editors. Multiple Sclerosis: Perspectives in Treatment and Pathogenesis. Brisbane, Australia: Codon Publications; 2017. pp. 155–171. - DOI - PubMed
    1. Ohl K., Tenbrock K., Kipp M. Oxidative stress in multiple sclerosis: central and peripheral mode of action. Experimental Neurology. 2016;277:58–67. doi: 10.1016/j.expneurol.2015.11.010. - DOI - PMC - PubMed
    1. Miller E., Wachowicz B., Majsterek I. Advances in antioxidative therapy of multiple sclerosis. Current Medicinal Chemistry. 2013;20(37):4720–4730. doi: 10.2174/09298673113209990156. - DOI - PubMed
    1. Gray E., Thomas T. L., Betmouni S., Scolding N., Love S. Elevated myeloperoxidase activity in white matter in multiple sclerosis. Neuroscience Letters. 2008;444(2):195–198. doi: 10.1016/j.neulet.2008.08.035. - DOI - PubMed
    1. Liu J. S., Zhao M., Brosnan C. F., Lee S. C. Expression of inducible nitric oxide synthase and nitrotyrosine in multiple sclerosis lesions. The American Journal of Pathology. 2001;158(6):2057–2066. doi: 10.1016/S0002-9440(10)64677-9. - DOI - PMC - PubMed

LinkOut - more resources