. 2016 Feb 16;121(3):1278-1305.
doi: 10.1002/2015JD023986. Epub 2016 Jan 11.

High-resolution NU-WRF simulations of a deep convective-precipitation system during MC3E: Further improvements and comparisons between Goddard microphysics schemes and observations

Affiliations

High-resolution NU-WRF simulations of a deep convective-precipitation system during MC3E: Further improvements and comparisons between Goddard microphysics schemes and observations

Wei-Kuo Tao et al. J Geophys Res Atmos. .

Abstract

The Goddard microphysics was recently improved by adding a fourth ice class (frozen drops/hail). This new 4ICE scheme was developed and tested in the Goddard Cumulus Ensemble (GCE) model for an intense continental squall line and a moderate, less organized continental case. Simulated peak radar reflectivity profiles were improved in intensity and shape for both cases, as were the overall reflectivity probability distributions versus observations. In this study, the new Goddard 4ICE scheme is implemented into the regional-scale NASA Unified-Weather Research and Forecasting (NU-WRF) model, modified and evaluated for the same intense squall line, which occurred during the Midlatitude Continental Convective Clouds Experiment (MC3E). NU-WRF simulated radar reflectivities, total rainfall, propagation, and convective system structures using the 4ICE scheme modified herein agree as well as or significantly better with observations than the original 4ICE and two previous 3ICE (graupel or hail) versions of the Goddard microphysics. With the modified 4ICE, the bin microphysics-based rain evaporation correction improves propagation and in conjunction with eliminating the unrealistic dry collection of ice/snow by hail can replicate the erect, narrow, and intense convective cores. Revisions to the ice supersaturation, ice number concentration formula, and snow size mapping, including a new snow breakup effect, allow the modified 4ICE to produce a stronger, better organized system, more snow, and mimic the strong aggregation signature in the radar distributions. NU-WRF original 4ICE simulated radar reflectivity distributions are consistent with and generally superior to those using the GCE due to the less restrictive domain and lateral boundaries.


Figures
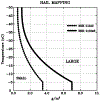
Figure 1.
Figure 1.
Hail mapping size thresholds as a function of (horizontal axis) hail mixing ratio and local in (vertical axis) cloud temperature. Hail mixing ratios less than the dashed line use a larger intercept (i.e., 0.240 cm−4) representative of smaller hail, while those greater than the solid line use a smaller intercept (i.e., 0.0048 cm−4) representative of larger hail at each given temperature. Intercept values are interpolated for mixing ratios between the two thresholds.
Figure 2.
Figure 2.
NU-WRF grid configuration. The outer domain (labeled 1 at the center) has a horizontal resolution of 9 km. The middle domain (labeled 2) has a horizontal resolution of 3 km, and the inner domain (labeled 3) has a horizontal resolution of 1 km and covers the southern Plains.
Figure 3.
Figure 3.
Composited radar reflectivity from (a) NEXRAD observations and NU-WRF simulations with the (b) Graupel, (c) Hail, (d) original 4ICE, (e) modified 4ICE, and (f) modified 4ICE with no rain evaporation correction at 10 UTC on 20 May 2011. The precipitation analysis area is indicated by the red boundary. Longitude and latitude values are shown along the horizontal and vertical edges, respectively.
Figure 4.
Figure 4.
Vertical cross sections of (a) NEXRAD-observed radar reflectivity and NU-WRF-simulated reflectivity from the (b) Graupel, (c) Hail, (d) original 4ICE, (e) modified 4ICE, and (f) modified 4ICE with no rain evaporation correction simulations at 10 UTC on 20 May 2011. Positions of the cross sections are shown by the lines in Figure 3 for the radar observations and WRF simulations, respectively. The vertical axes show height in kilometers and the horizontal axes the horizontal distance in kilometers along the cross section.
Figure 5.
Figure 5.
Surface perturbation potential temperature (color shade) overlaid with 45 dBZ radar reflectivity contours from the model simulations (black) and NEXRAD (red). Longitude and latitude values are shown along the horizontal and vertical edges, respectively.
Figure 6.
Figure 6.
Maximum radar reflectivities for (a) NEXRAD and NU-WRF with the (b) Graupel, (c) Hail, (d) original 4ICE, and (e) modified 4ICE microphysics schemes. Vertical axes are heights in kilometers; horizontal axes indicate time from 06 to 12 UTC on 20 May 2011.
Figure 7.
Figure 7.
Radar reflectivity CFADs from (a) NEXRAD observations and NU-WRF simulations with the (b) Graupel, (c) Hail, (d) original 4ICE, and (e) modified 4ICE microphysics schemes from 06 to 12 UTC on 20 May 2011. Horizontal dashed lines in red indicate the level of the 0°C environmental temperature. The thicker solid black lines are overlays of the observed 0.001% and 2.0% frequency contours; the thinner black lines highlight the simulated 2.0 frequency contours.
Figure 8.
Figure 8.
Contribution to the modified 4ICE radar reflectivity CFAD shown in Figure 7e from (a) rain, (b) snow, (c) graupel, and (d) hail as a percentage of the power in each bin.
Figure 9.
Figure 9.
PDF matching scores for the CFADs in Figure 7. The score indicates the amount of overlap between the simulated and observed PDF at each level.
Figure 10.
Figure 10.
Vertical velocity CFADs of in-cloud updrafts and downdrafts in the (a) total, (b) convective, and (c) stratiform regions from 06 to 12 UTC on 20 May 2011. Solid lines indicate 0.005% frequencies and dashed lines 1.0% frequencies.
Figure 11.
Figure 11.
Surface 1 h accumulated rainfall from (a) NMQ Q2 Stage IV bias-corrected radar rain estimates and the NU-WRF simulations with the (b) Graupel, (c) Hail, (d) original 4ICE and (e) modified 4ICE schemes ending at 10 UTC on 20 May 2011. The precipitation analysis area is indicated by the red boundary shown in Figure 11a. Longitude and latitude values are shown along the horizontal and vertical edges, respectively.
Figure 12.
Figure 12.
PDFs of NMQ-observed and NU-WRF-simulated rainfall intensity in millimeters per hour from four different variations of the Goddard microphysical schemes for the (a) total region using a logarithmic scale and (b) total, (c) convective, and (d) stratiform regions using a linear scale. The observed rain rates are estimated from the Stage IV bias-corrected Q2 radar estimates. PDFs were calculated every 10 min from both the observed and simulated data sets from 06 to 12 UTC on 20 May 2011 within the analysis domain shown in Figure 3.
Figure 13.
Figure 13.
Domain- and time-averaged hydrometeor profiles from the (a) Graupel, (b) Hail, (c) original 4ICE, and (d) modified 4ICE schemes from 06 to 12 UTC on 20 May 2011. The horizontal axes show mixing ratio in grams per kilograms.
Figure 14.
Figure 14.
Same as Figure 13 except for the convective regions.
Figure 15.
Figure 15.
Same as Figure 13 except for the stratiform regions.

References

    1. Adams-Selin RD, van den Heever SC, and Johnson RH (2013a), Impact of graupel parameterization schemes on idealized bow echo simulations, Mon. Weather Rev, 141, 1241–1262.
    1. Adams-Selin RD, van den Heever SC, and Johnson RH (2013b), Quantitative evaluation of bow echo microphysical sensitivity, Weather Forecasting, 28, 1188–1209.
    1. Brandes EA, Ikeda K, Zhang G, Schönhuber M, and Rasmussen RM (2007), A statistical and physical description of hydrometeor distributions in Colorado snowstorms using a video disdrometer, J. Appl. Meteorol. Climatol, 46, 634–650, doi:10.1175/JAM2489.1. - DOI
    1. Bryan GH, and Morrison H (2012), Sensitivity of a simulated squall line to horizontal resolution and parameterization of microphysics, Mon. Weather Rev, 140, 202–225.
    1. Chern J-D, Tao W-K, Lang SE, Matsui T, Li J-LF, Mohr KI, Skofronick-Jackson GM, and Peters-Lidard CD (2016), Performance of the Goddard multiscale modeling framework with Goddard ice microphysical schemes, J. Adv. Model. Earth Syst, 7, doi:10.1002/2015MS000469. - DOI

LinkOut - more resources