Clinical Trial
. 2020 Jul 27:2020:8748934.
doi: 10.1155/2020/8748934. eCollection 2020.

Blood Monocyte Phenotype Fingerprint of Stable Coronary Artery Disease: A Cross-Sectional Substudy of SMARTool Clinical Trial

Affiliations
Clinical Trial

Blood Monocyte Phenotype Fingerprint of Stable Coronary Artery Disease: A Cross-Sectional Substudy of SMARTool Clinical Trial

Silverio Sbrana et al. Biomed Res Int. .

Abstract

Background and aims: Atherosclerosis is an inflammatory disease with long-lasting activation of innate immunity and monocytes are the main blood cellular effectors. We aimed to investigate monocyte phenotype (subset fraction and marker expression) at different stages of coronary atherosclerosis in stable coronary artery disease (CAD) patients.

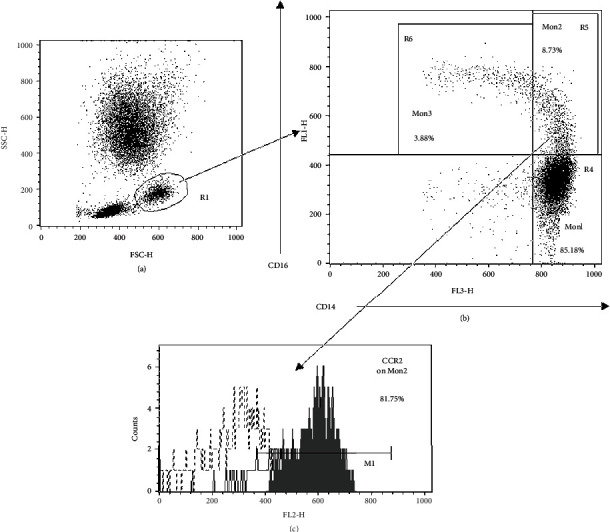
Methods: 73 patients with chronic coronary syndrome were evaluated by CT coronary angiography (CTCA) and classified by maximal diameter stenosis of major vessels into three groups of CAD severity: CAD1 (no CAD/minimal CAD, n° = 30), CAD2 (non-obstructive CAD, n° = 21), and CAD3 (obstructive CAD, n° = 22). Flow cytometry for CD14, CD16, and CCR2 was used to quantify Mon1, Mon2, and Mon3 subsets. Expression of CD14, CD16, CD18, CD11b, HLA-DR, CD163, CCR2, CCR5, CX3CR1, and CXCR4 was also measured. Adhesion molecules and cytokines were quantified by ELISA.

Results: Total cell count and fraction of Mon2 were higher in CAD2 and CAD3 compared to CAD1. By multivariate regression analysis, Mon2 cell fraction and Mon2 expression of CX3CR1, CD18, and CD16 showed a statistically significant and independent increase, parallel to stenosis severity, from CAD1 to CAD2 and CAD3 groups. A similar trend was also present for CX3CR1 and HLA-DR expressions on total monocyte population. A less calcified plaque composition was associated to a higher Mon2 expression of CD16 and higher TNF-α levels. IL-10 levels were lower at greater stenosis severity, while the IFN-γ/IL-10 ratio, a marker of a systemic pro-inflammatory imbalance, was directly correlated to stenosis degree and number of noncalcified plaques.

Conclusions: The results of this study suggest that a specific pattern of inflammation-correlated monocyte marker expression is associated to higher stenosis severity and less calcified lesions in stable CAD. The clinical trial Identifier is NCT04448691.


Conflict of interest statement

The authors declare that there is no conflict of interest regarding the publication of this paper.

Figures

Figure 1
Figure 1
Representative example of the flow cytometry analysis for monocyte subset quantification. (a) Total monocyte cluster identification based on its forward and side scatter morphological characteristics (region R1). (b) Selection of CD14++/+ events and preliminary monocyte subset quantification (as percentage) [(CD14++/CD16- (Mon1, R4), CD14++/CD16+ (Mon2, R5), and CD14+/CD16++ (Mon3, R6)] initially based on their differential expression of markers CD14 and CD16. (c) The measurement of the actual circulating fraction of subsets Mon1 and Mon2 is obtained by multiplying, and then dividing by one hundred, the percentages of events measured at the point b (regions R4 and R5) with their corresponding percentages of positivity of the distinctive marker CCR2 (grey subtraction histogram by the Overton technique). For the final quantification of the Mon3 fraction (region R6), the value of its CCR2 negative fraction is used.
Figure 2
Figure 2
Cumulative graphic representation (mean ± SEM) of IL-10 plasma levels (pg/ml) [(a); ANOVA P < 0.0001] and IFN-γ/IL-10 ratio [(b); ANOVA P = 0.0006] in the three CAD severity groups. CAD1: no CAD/minimal CAD; CAD2: non-obstructive CAD; CAD3: obstructive CAD.
Figure 3
Figure 3
Cumulative graphic representation (mean ± SEM) of Mon2 subset circulating fractions [(a); ANOVA P = 0.0695] and counts [(b); ANOVA P = 0.0177] in the three CAD severity groups. CAD1: no CAD/minimal CAD; CAD2: non-obstructive CAD; CAD3: obstructive CAD.
Figure 4
Figure 4
Linear correlations between the HLA-DR expression level (as RFI units) of all CD14++/+ monocytes and the circulating fractions (as percentages) of the Mon1 (a), Mon2 (b), and Mon3 (c) monocyte subsets.

References

    1. Galkina E., Ley K. Immune and inflammatory mechanisms of atherosclerosis. Annual Review of Immunology. 2009;27(1):165–197. doi: 10.1146/annurev.immunol.021908.132620. - DOI - PMC - PubMed
    1. Christ A., Bekkering S., Latz E., Riksen N. P. Long-term activation of the innate immune system in atherosclerosis. Seminars in Immunology. 2016;28(4):384–393. doi: 10.1016/j.smim.2016.04.004. - DOI - PubMed
    1. Woollard K. J., Geissmann F. Monocytes in atherosclerosis: subsets and functions. Nature Reviews Cardiology. 2010;7(2):77–86. doi: 10.1038/nrcardio.2009.228. - DOI - PMC - PubMed
    1. Hilgendorf I., Swirski F. K., Robbins C. S. Monocyte fate in atherosclerosis. Arteriosclerosis, Thrombosis, and Vascular Biology. 2015;35(2):272–279. doi: 10.1161/ATVBAHA.114.303565. - DOI - PubMed
    1. Passlick B., Flieger D., Ziegler-Heitbrock H. W. Identification and characterization of a novel monocyte subpopulation in human peripheral blood. Blood. 1989;74(7):2527–2534. doi: 10.1182/blood.V74.7.2527.2527. - DOI - PubMed

Publication types

Associated data