. 2020 Aug 13;6(1):e12060.
doi: 10.1002/trc2.12060. eCollection 2020.

Antihypertensive medications ameliorate Alzheimer's disease pathology by slowing its propagation

Affiliations

Antihypertensive medications ameliorate Alzheimer's disease pathology by slowing its propagation

Andrew J Affleck et al. Alzheimers Dement (N Y). .

Abstract

Introduction: Mounting evidence supports an association between antihypertensive medication use and reduced risk of Alzheimer's disease (AD). Consensus on possible pathological mechanisms remains elusive.

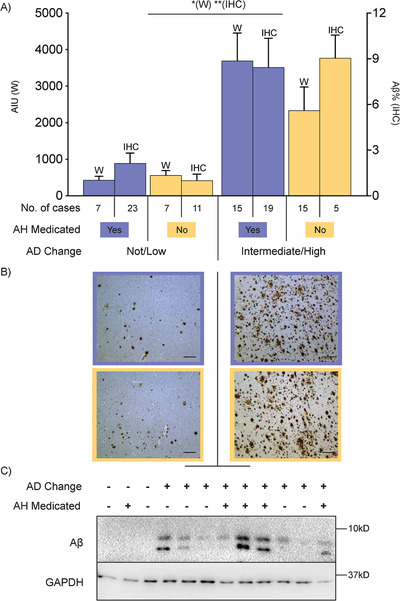
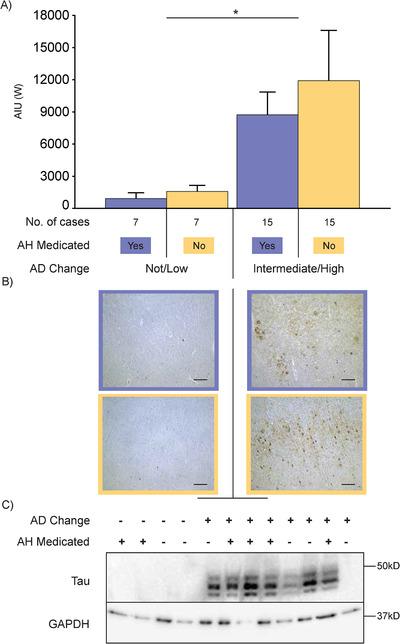
Methods: Human brain tissue from a cohort followed to autopsy that included 96 cases of AD (46 medicated for hypertension) and 53 pathological controls (33 also medicated) matched for cerebrovascular disease was available from the New South Wales Brain Banks. Quantified frontal cortex amyloid beta (Aβ) and tau proteins plus Alzheimer's neuropathologic change scores were analyzed.

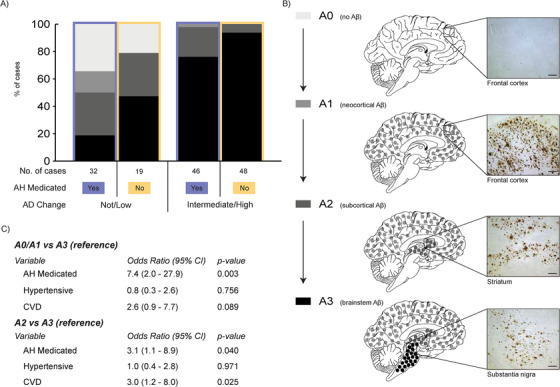
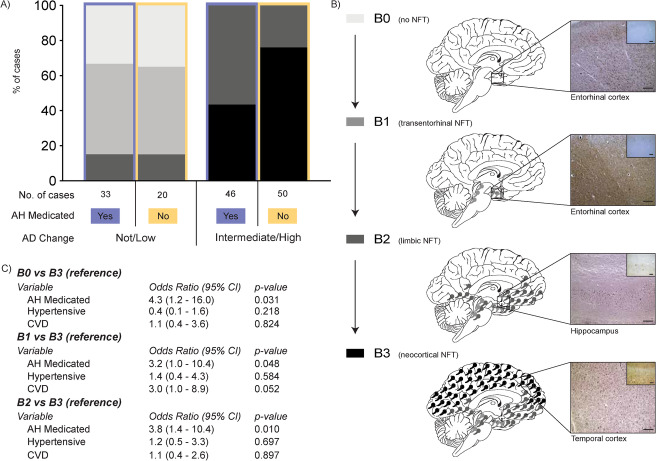
Results: Univariate analyses found no difference in amounts of AD proteins in the frontal cortex between medication users, but multivariate analyses showed that antihypertensive medication use was associated with a less extensive spread of AD proteins throughout the brain.

Discussion: The heterogeneous nature of the antihypertensive medications is consistent with downstream beneficial effects of blood pressure lowering and/or management being associated with the reduced spreading of AD pathology observed.

Keywords: Alzheimer's disease; amyloid; antihypertensive medication; neuropathology; tau.


Conflict of interest statement

AA is a recipient of UNSW Brain Sciences Collaborative PhD Grant. PS is supported by research grants from the National Health & Medical Research Council, the Australian Research Council, the National Institute of Aging, the NHMRC National Institute for Dementia Research, and several philanthropic foundations. He reports no conflicts of interest in relation to this work. JS is funded by a research grant from the National Institute on Alcohol Abuse and Alcoholism of the National Institutes of Health (AA012725). GH consults for the National Health and Medical Research Council of Australia (NHMRC); received travel funds from AAIC, Int Soc Neurochemistry, Int DLB Conference, AAN, Int MSA Conference, NHMRC National Institute for Dementia Research, Japanese Neurology Soc; is on the editorial boards of Acta Neuropathol, J Neural Transm, J Parkinson Dis, Transl Neurodegen, Neuropathol Appl Neurobiol, receives royalties from Academic press, Elsevier & Oxford University Press; receives research grant funding from NHMRC, MJ Fox Foundation, Shake‐it‐up Australia, Parkinson's NSW, University of Sydney (infrastructure & equipment); and holds stock in Cochlear (2004 on) & NIB Holdings (2007 on).

Figures

FIGURE 1
FIGURE 1
A, Bar graph showing amounts of amyloid beta (Aβ) in the frontal cortex of cases with a not/low or intermediate (int)/high level of Alzheimer's disease (AD) neuropathologic change that is further dichotomized into antihypertensive medication (AH Medicated) use (yes = “+” and orchid color, no = “−” and cantaloupe color) as measured in arbitrary intensity units (AIU, left axis) by western immunoblotting (w) or average percentage area of Aβ positivity by immunohistochemistry (IHC, right axis). Case types and number of cases illustrated in key underneath bar graph. Error bars = standard error of the mean. *P < .01 Western and **P < .001 IHC for difference between not/low AD and int/high AD. B, Representative micrographs of Aβ immunohistochemistry in the frontal cortex. Those on the left‐hand side are cases that have a not/low level of AD change while cases on the right‐hand side are those that have an int/high level of AD change. Micrographs with an orchid‐colored border denote cases that had taken antihypertensive medications while micrographs with a cantaloupe‐colored border denote cases that had not taken antihypertensive medications. Scale bars = 200 µm. C, Representative western immunoblots of the data presented in (A). Lanes denoted as AD Change “‐” indicate not/low level of AD change while those denoted as AD Change “+” indicate int/high level of AD change. Lanes denoted as AH Medicated “−” indicate cases that had not taken antihypertensive medications while those denoted as AH Medicated “+” indicate cases that had taken antihypertensive medications
FIGURE 2
FIGURE 2
A, Bar graph showing amounts of tau (Alz50) in the frontal cortex of cases with a not/low or intermediate (int)/high level of Alzheimer's disease (AD) neuropathologic change that is further dichotomized into antihypertensive medication (AH Medicated) use (yes = “+” and orchid color, no = “−” and cantaloupe color) as measured in arbitrary intensity units (AIU) by western immunoblotting. Case types and number of cases illustrated in key underneath the bar graph. Error bars = standard error of the mean. *P < .05 Western for not/low AD versus int/high AD. B, Representative immunomicrographs of tau (AT8) in the frontal cortex. Those on the left‐hand side are cases that have a not/low level of AD change while cases on the right‐hand side are those that have an int/high level of AD change. Micrographs with an orchid‐colored border denote cases that had taken antihypertensive medications while micrographs with a cantaloupe‐colored border denote cases that had not taken antihypertensive medications. Scale bars = 200 µm. C, Representative immunoblots of the western data presented in (A). Lanes denoted as AD Change “−” indicate not/low level of AD change while those denoted as AD Change “+” indicate int/high level of AD change. Lanes denoted as AH Medicated “‐” indicate cases that had not taken antihypertensive medications while those denoted as AH Medicated “+” indicate cases that had taken antihypertensive medications
FIGURE 3
FIGURE 3
A, Stacked bar chart representing the percentage distribution of A scores of cases with a not/low or intermediate (int)/high level of Alzheimer's disease (AD) neuropathologic change that is further dichotomized into antihypertensive medication (AH Medicated) use (yes = orchid color, no = cantaloupe color). Case types and number of cases illustrated in key underneath the stacked bar chart. B, Schematic illustrating the progression of amyloid beta (Aβ) through the four A score stages (A0 to A3). The left panel of (B) shows the key used for the percentage distributions depicted in (A) with descriptors of Aβ brain regional involvement. The middle panel of (B) presents a schematic of the brain at each A score with colored round circles representing the involvement of Aβ seen at each A score level. The right panel of (B) show representative immunomicrographs of Aβ normally seen at each A score level with the brain region noted under each. Scale bars = 200 µm. C, Pertinent results of the multinomial logistic regression carried out to assess the effect of variables of interest on likelihood of A score level membership using the most severe A score level (A3) as the reference group. For full details of these results please see Table S4
FIGURE 4
FIGURE 4
A, Stacked bar chart representing the percentage distribution of B scores of cases with a not/low or intermediate (int)/high level of Alzheimer's disease (AD) neuropathologic change that is further dichotomized into antihypertensive medication (AH Medicated) use (yes = orchid color, no = cantaloupe color). Case types and number of cases illustrated in key underneath the stacked bar chart. B, Schematic illustrating the progression of neurofibrillary tangles (NFT) through the four B score stages (B0 to B3). The left panel of (B) shows the key used for the percentage distributions depicted in (A) with descriptors of NFT brain regional involvement. The middle panel of (B) presents a schematic of the brain at each B score with colored NFT icons representing the involvement of NFTs seen at each B score level. The right panel of (B) shows representative micrographs of NFTs normally seen at each B score level with the brain region noted under each. The main micrograph is of modified Bielschowsky silver stain while the insert in the top right hand corner is of the same region immunostained for tau (AT8). Scale bars = 200 μm. C, Pertinent results of the multinomial logistic regression carried out to assess the effect of variables of interest on likelihood of B score level membership using the most severe B score level (B3) as the reference group. For full details of these results please see Table S4

References

    1. Hyman B, Phelps CH, Beach TG, et al. National Institute on Aging‐Alzheimer's Association guidelines for the neuropathologic assessment of Alzheimer's disease. Alzheimers Dement. 2012;8:1‐13. - PMC - PubMed
    1. Azarpazhooh MR, Avan A, Cipriano LE, Munoz DG, Sposato LA, Hachinski V. Concomitant vascular and neurodegenerative pathologies double the risk of dementia. Alzheimers Dement. 2018;14:148‐156. - PubMed
    1. Kapasi A, DeCarli C, Schneider JA. Impact of multiple pathologies on the threshold for clinically overt dementia. Acta Neuropathol. 2017;134:171‐286. - PMC - PubMed
    1. Faraco G, Iadecola C. Hypertension: a harbinger of stroke and dementia. Hypertension. 2013;62:810‐817. - PMC - PubMed
    1. Lennon MJ, Makkar SR, Crawford JD, Sachdev PS. Midlife hypertension and alzheimer's disease: a systematic review and meta‐analysis. J Alzheimers Dis. 2019;71(1):307‐316. - PubMed

LinkOut - more resources