The Role of GnRH Receptor Autoantibodies in Polycystic Ovary Syndrome
- PMID: 32803090
- PMCID: PMC7417878
- DOI: 10.1210/jendso/bvaa078
The Role of GnRH Receptor Autoantibodies in Polycystic Ovary Syndrome
Abstract
Objective: Is polycystic ovary syndrome (PCOS) associated with activating autoantibodies (AAb) to the second extracellular loop (ECL2) of gonadotropin-releasing hormone receptor (GnRHR)?
Design and methods: We retrospectively screened sera from 40 patients with PCOS and 14 normal controls (NCs) with regular menses using enzyme-linked immunosorbent assay (ELISA) for the presence of GnRHR-ECL2-AAb. We obtained similar data from 40 non-PCOS ovulatory but infertile patients as a control group (OIC) of interest. We analyzed GnRHR-ECL2-AAb activity in purified immunoglobulin (Ig)G using a cell-based GnRHR bioassay.
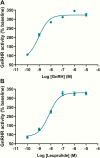
Results: The mean ELISA value in the PCOS group was markedly higher than the NC (P = .000036) and the OIC (P = .0028) groups. IgG from a sample of 5 PCOS subjects, in contrast to a sample of 5 OIC subjects, demonstrated a dose-dependent increase in GnRHR-stimulating activity qualitatively similar to the acute action of the natural ligand GnRH and the synthetic agonist leuprolide. The GnRHR antagonist cetrorelix significantly suppressed (P < .01) the elevated GnRHR activity induced by IgG from 7 PCOS patients while the IgG activity level from 7 OIC subjects was unchanged. Five other OIC subjects had relatively high ELISA values at or above the 95% confidence limits. On further study, 3 had normal or low activity while 2 had elevated IgG-induced GnRHR activity. One suppressed with cetrorelix while the other did not. The copresence of PCOS IgG increased the responsiveness to GnRH and shifted the dosage response curve to the left (P < .01).
Conclusions: GnRHR-ECL2-AAb are significantly elevated in patients with PCOS compared with NCs. Their presence raises important etiological, diagnostic, and therapeutic implications.
Keywords: GnRH receptor; autoantibodies; polycystic ovary syndrome.
© Endocrine Society 2020.
Figures


Similar articles
-
Elevated activity levels of activating autoantibodies to the GnRH receptor in patients with polycystic ovary syndrome.F S Rep. 2020 Oct 8;1(3):299-304. doi: 10.1016/j.xfre.2020.09.015. eCollection 2020 Dec. F S Rep. 2020. PMID: 34223260 Free PMC article.
-
Increased testosterone and proinflammatory cytokines in patients with polycystic ovary syndrome correlate with elevated GnRH receptor autoantibody activity assessed by a fluorescence resonance energy transfer-based bioassay.Endocrine. 2021 Oct;74(1):163-171. doi: 10.1007/s12020-021-02761-7. Epub 2021 May 20. Endocrine. 2021. PMID: 34013495 Free PMC article.
-
GnRH receptor-activating autoantibodies in polycystic ovary syndrome: identification of functional epitopes and development of epitope mimetic inhibitors.Endocrine. 2022 Mar;75(3):959-963. doi: 10.1007/s12020-021-02944-2. Epub 2021 Nov 22. Endocrine. 2022. PMID: 34807394 Free PMC article.
-
The role of gonadotropin-releasing hormone neurons in polycystic ovary syndrome.J Neuroendocrinol. 2022 May;34(5):e13093. doi: 10.1111/jne.13093. Epub 2022 Jan 26. J Neuroendocrinol. 2022. PMID: 35083794 Free PMC article. Review.
-
GnRH antagonist versus long agonist protocols in IVF: a systematic review and meta-analysis accounting for patient type.Hum Reprod Update. 2017 Sep 1;23(5):560-579. doi: 10.1093/humupd/dmx017. Hum Reprod Update. 2017. PMID: 28903472
Cited by
-
Elevated activity levels of activating autoantibodies to the GnRH receptor in patients with polycystic ovary syndrome.F S Rep. 2020 Oct 8;1(3):299-304. doi: 10.1016/j.xfre.2020.09.015. eCollection 2020 Dec. F S Rep. 2020. PMID: 34223260 Free PMC article.
-
Polycystic ovary syndrome.Nat Rev Dis Primers. 2024 Apr 18;10(1):27. doi: 10.1038/s41572-024-00511-3. Nat Rev Dis Primers. 2024. PMID: 38637590 Review.
-
Autoimmunity to the Follicle-Stimulating Hormone Receptor (FSHR) and Luteinizing Hormone Receptor (LHR) in Polycystic Ovarian Syndrome.Int J Mol Sci. 2021 Dec 20;22(24):13667. doi: 10.3390/ijms222413667. Int J Mol Sci. 2021. PMID: 34948471 Free PMC article.
-
Autoantibodies Targeting the Hypothalamic-Pituitary-Ovarian Axis in Polycystic Ovary Syndrome: Emerging Key Players in Pathogenesis?Int J Mol Sci. 2025 Apr 26;26(9):4121. doi: 10.3390/ijms26094121. Int J Mol Sci. 2025. PMID: 40362363 Free PMC article. Review.
-
Natural autoantibodies to the gonadotropin-releasing hormone receptor in polycystic ovarian syndrome.PLoS One. 2021 Apr 2;16(4):e0249639. doi: 10.1371/journal.pone.0249639. eCollection 2021. PLoS One. 2021. PMID: 33798258 Free PMC article.
References
-
- Lizneva D, Suturina L, Walker W, Brakta S, Gavrilova-Jordan L, Azziz R. Criteria, prevalence, and phenotypes of polycystic ovary syndrome. Fertil Steril. 2016;106(1):6-15. - PubMed
-
- Delitala AP, Capobianco G, Delitala G, Cherchi PL, Dessole S. Polycystic ovary syndrome, adipose tissue and metabolic syndrome. Arch Gynecol Obstet. 2017;296(3):405-419. - PubMed
Grants and funding
LinkOut - more resources
Full Text Sources
