Hyperpolarized 13C MRI of Tumor Metabolism Demonstrates Early Metabolic Response to Neoadjuvant Chemotherapy in Breast Cancer
- PMID: 32803167
- PMCID: PMC7398116
- DOI: 10.1148/rycan.2020200017
Hyperpolarized 13C MRI of Tumor Metabolism Demonstrates Early Metabolic Response to Neoadjuvant Chemotherapy in Breast Cancer
Abstract
Purpose: To compare hyperpolarized carbon 13 (13C) MRI with dynamic contrast material-enhanced (DCE) MRI in the detection of early treatment response in breast cancer.
Materials and methods: In this institutional review board-approved prospective study, a woman with triple-negative breast cancer (age, 49 years) underwent 13C MRI after injection of hyperpolarized [1-carbon 13 {13C}]-pyruvate and DCE MRI at 3 T at baseline and after one cycle of neoadjuvant therapy. The 13C-labeled lactate-to-pyruvate ratio derived from hyperpolarized 13C MRI and the pharmacokinetic parameters transfer constant (K trans) and washout parameter (k ep) derived from DCE MRI were compared before and after treatment.
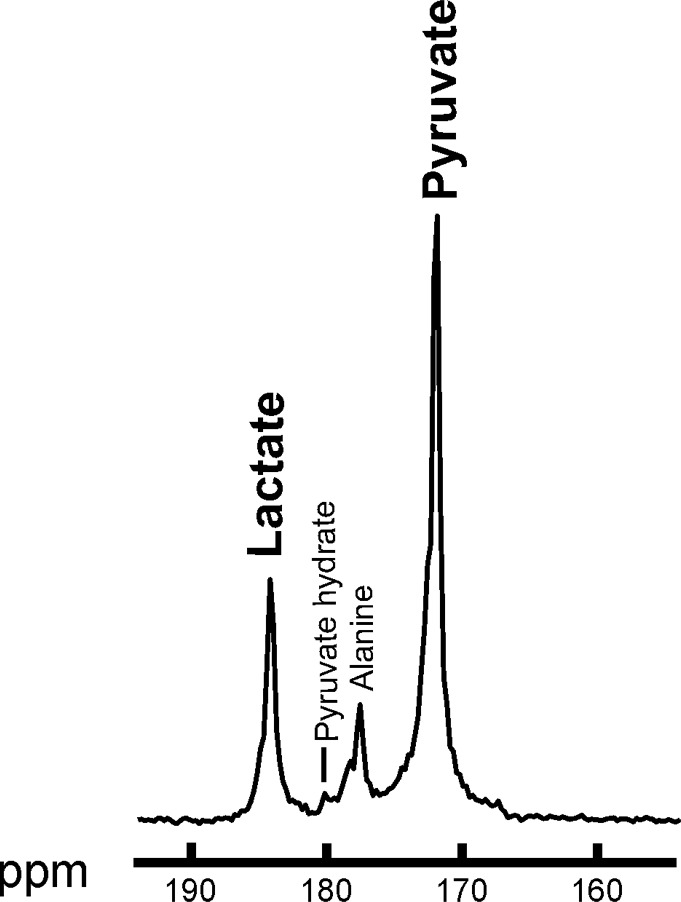
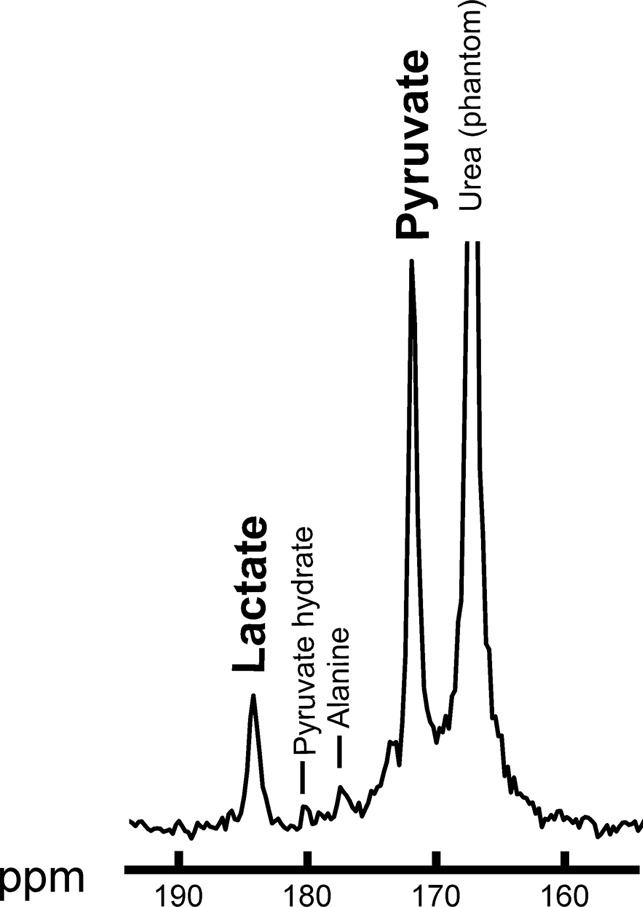
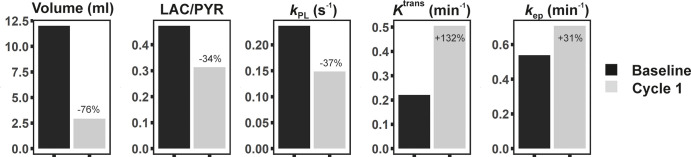
Results: Exchange of the 13C label between injected hyperpolarized [1-13C]-pyruvate and the endogenous lactate pool was observed, catalyzed by the enzyme lactate dehydrogenase. After one cycle of neoadjuvant chemotherapy, a 34% reduction in the 13C-labeled lactate-to-pyruvate ratio resulted in correct identification of the patient as a responder to therapy, which was subsequently confirmed via a complete pathologic response. However, DCE MRI showed an increase in mean K trans (132%) and mean k ep (31%), which could be incorrectly interpreted as a poor response to treatment.
Conclusion: Hyperpolarized 13C MRI enabled successful identification of breast cancer response after one cycle of neoadjuvant chemotherapy and may improve response prediction when used in conjunction with multiparametric proton MRI.Published under a CC BY 4.0 license.
2020 by the Radiological Society of North America, Inc.
Figures
![Multinuclear hydrogen 1 and 13C MR images of the right breast at baseline (top) and after one cycle of neoadjuvant chemotherapy (bottom). (a) Coronal summed hyperpolarized [1-13C]-pyruvate and (b) [1-13C]-lactate signal overlaid on unenhanced T1-weighted images. (c) Coronal dynamic contrast-enhanced MR image obtained 150 seconds after contrast agent injection and (d) overlaid transfer constant (Ktrans) map.](https://cdn.ncbi.nlm.nih.gov/pmc/blobs/f2ef/7983752/86b54628c62f/rycan.2020200017.fig1a.jpg)
![Multinuclear hydrogen 1 and 13C MR images of the right breast at baseline (top) and after one cycle of neoadjuvant chemotherapy (bottom). (a) Coronal summed hyperpolarized [1-13C]-pyruvate and (b) [1-13C]-lactate signal overlaid on unenhanced T1-weighted images. (c) Coronal dynamic contrast-enhanced MR image obtained 150 seconds after contrast agent injection and (d) overlaid transfer constant (Ktrans) map.](https://cdn.ncbi.nlm.nih.gov/pmc/blobs/f2ef/7983752/ac63e2b84b4c/rycan.2020200017.fig1b.jpg)
![Multinuclear hydrogen 1 and 13C MR images of the right breast at baseline (top) and after one cycle of neoadjuvant chemotherapy (bottom). (a) Coronal summed hyperpolarized [1-13C]-pyruvate and (b) [1-13C]-lactate signal overlaid on unenhanced T1-weighted images. (c) Coronal dynamic contrast-enhanced MR image obtained 150 seconds after contrast agent injection and (d) overlaid transfer constant (Ktrans) map.](https://cdn.ncbi.nlm.nih.gov/pmc/blobs/f2ef/7983752/e4326edbd7cb/rycan.2020200017.fig1c.jpg)
![Multinuclear hydrogen 1 and 13C MR images of the right breast at baseline (top) and after one cycle of neoadjuvant chemotherapy (bottom). (a) Coronal summed hyperpolarized [1-13C]-pyruvate and (b) [1-13C]-lactate signal overlaid on unenhanced T1-weighted images. (c) Coronal dynamic contrast-enhanced MR image obtained 150 seconds after contrast agent injection and (d) overlaid transfer constant (Ktrans) map.](https://cdn.ncbi.nlm.nih.gov/pmc/blobs/f2ef/7983752/ce7b86435182/rycan.2020200017.fig1d.jpg)
References
-
- Worldwide cancer data. World Cancer Research Fund Web site. https://www.wcrf.org/dietandcancer/cancer-trends/worldwide-cancer-data. Accessed May 9, 2019.
-
- Cortazar P, Zhang L, Untch M, et al. . Pathological complete response and long-term clinical benefit in breast cancer: the CTNeoBC pooled analysis. Lancet 2014;384(9938):164–172 [Published correction appears in Lancet 2019;393(10175):986.]. - PubMed
-
- Fowler AM, Mankoff DA, Joe BN. Imaging Neoadjuvant Therapy Response in Breast Cancer. Radiology 2017;285(2):358–375. - PubMed
Publication types
MeSH terms
Substances
Grants and funding
- C19212/A911376/CRUK_/Cancer Research UK/United Kingdom
- 21491/CRUK_/Cancer Research UK/United Kingdom
- MR/M009041/1/MRC_/Medical Research Council/United Kingdom
- C9685/A25177/CRUK_/Cancer Research UK/United Kingdom
- C197/A16465/CRUK_/Cancer Research UK/United Kingdom
- WT_/Wellcome Trust/United Kingdom
- C19212/A16628/CRUK_/Cancer Research UK/United Kingdom
- 28667/CRUK_/Cancer Research UK/United Kingdom
- 16628/CRUK_/Cancer Research UK/United Kingdom
- 16942/CRUK_/Cancer Research UK/United Kingdom
- C8742/A18097/CRUK_/Cancer Research UK/United Kingdom
- 16465/CRUK_/Cancer Research UK/United Kingdom
LinkOut - more resources
Full Text Sources
Medical