. 2020 Mar;1(3):302-314.
doi: 10.1038/s43018-020-0038-2. Epub 2020 Mar 9.

Bystander IFN-γ activity promotes widespread and sustained cytokine signaling altering the tumor microenvironment

Affiliations

Bystander IFN-γ activity promotes widespread and sustained cytokine signaling altering the tumor microenvironment

Ronan Thibaut et al. Nat Cancer. 2020 Mar.

Abstract

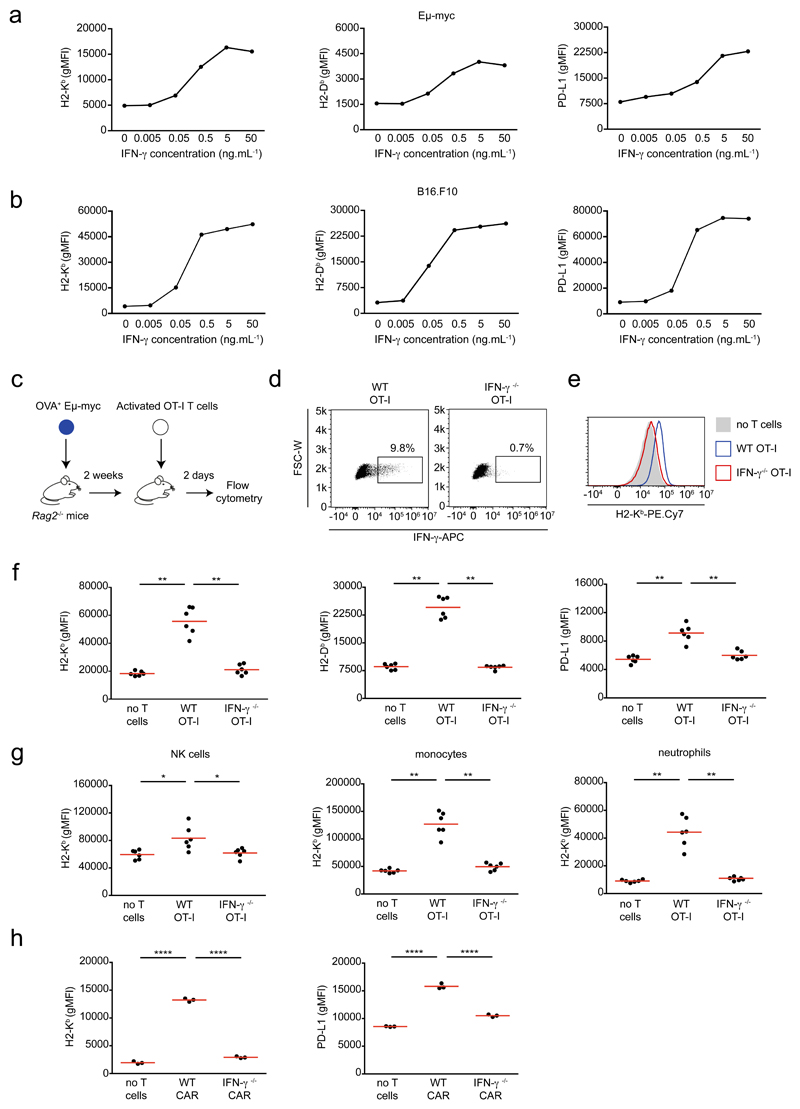
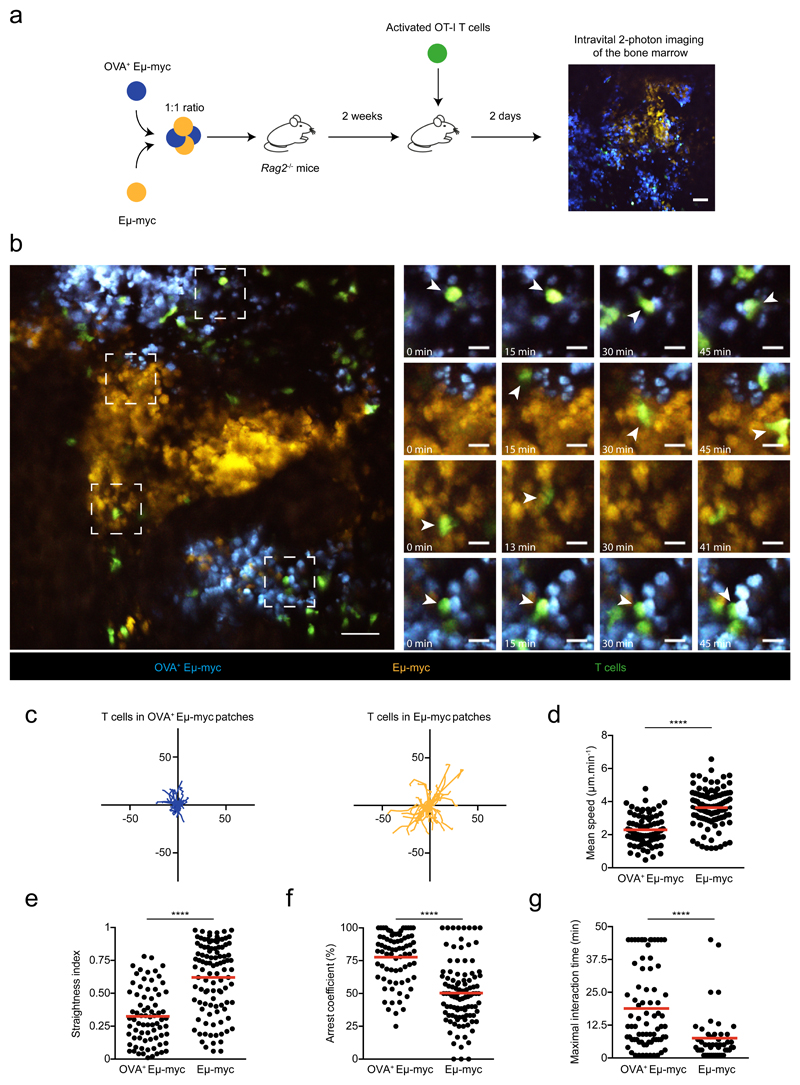
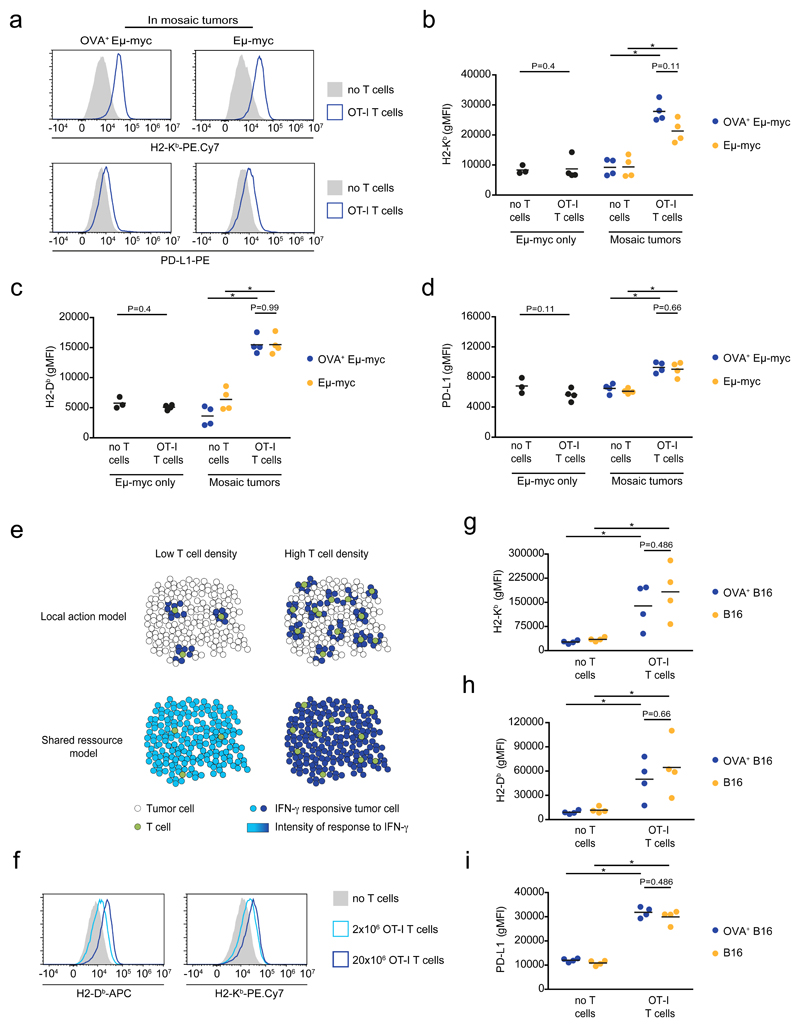
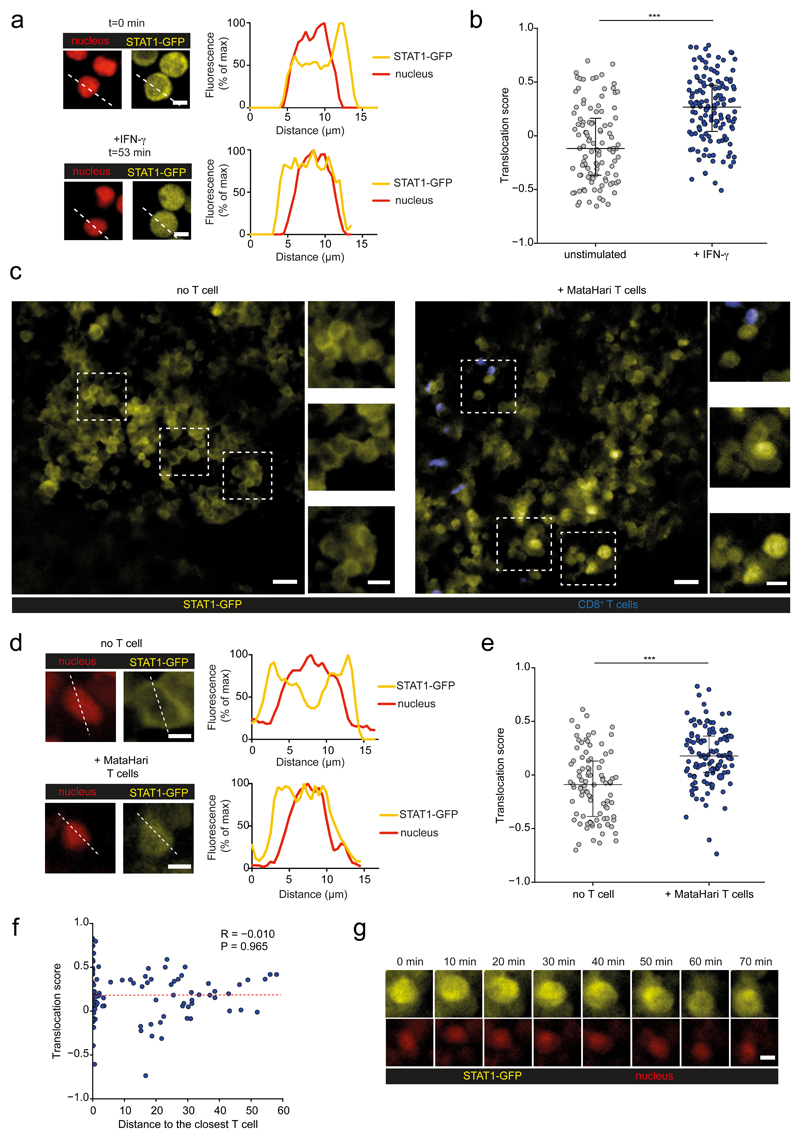
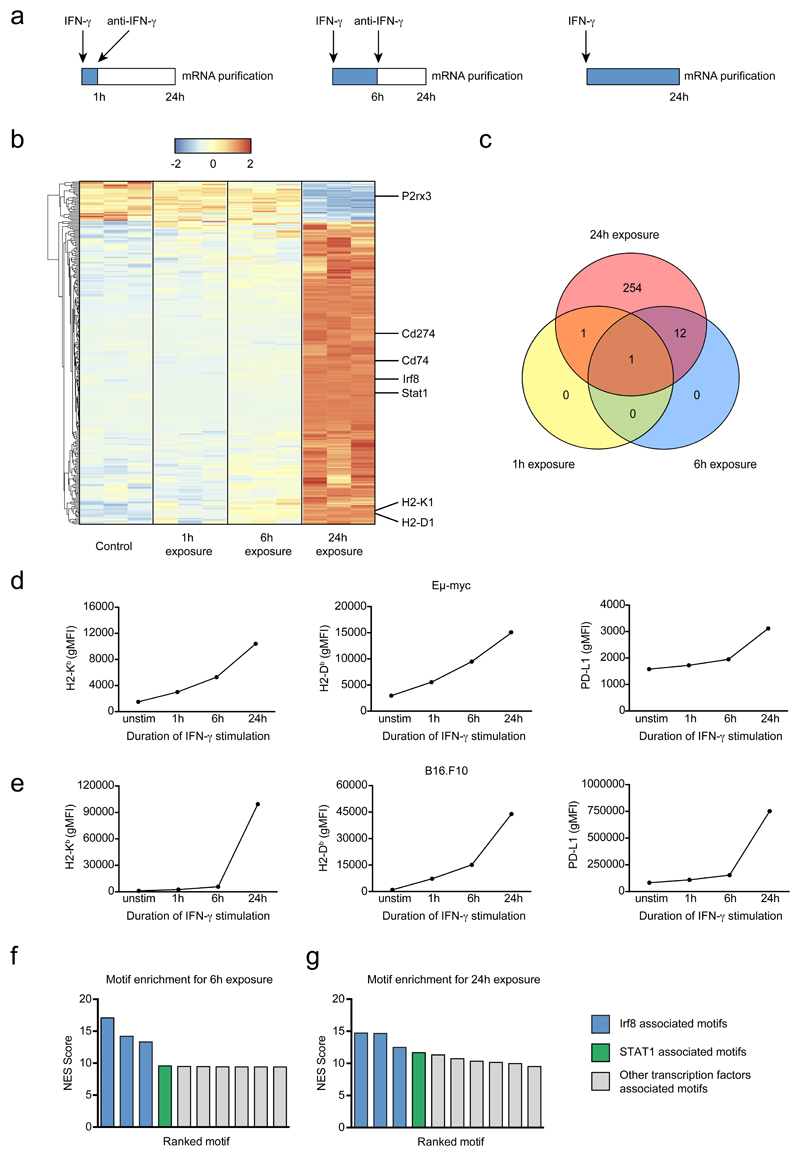
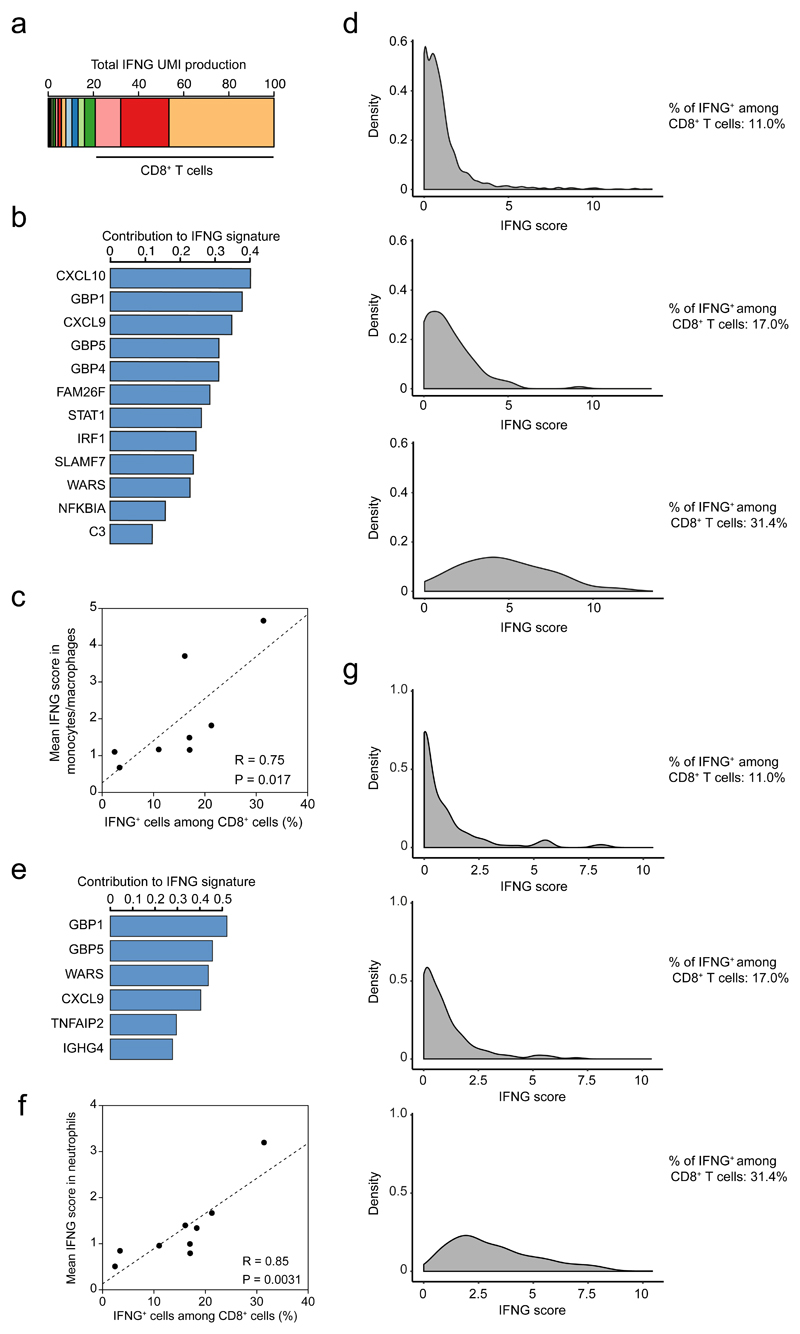
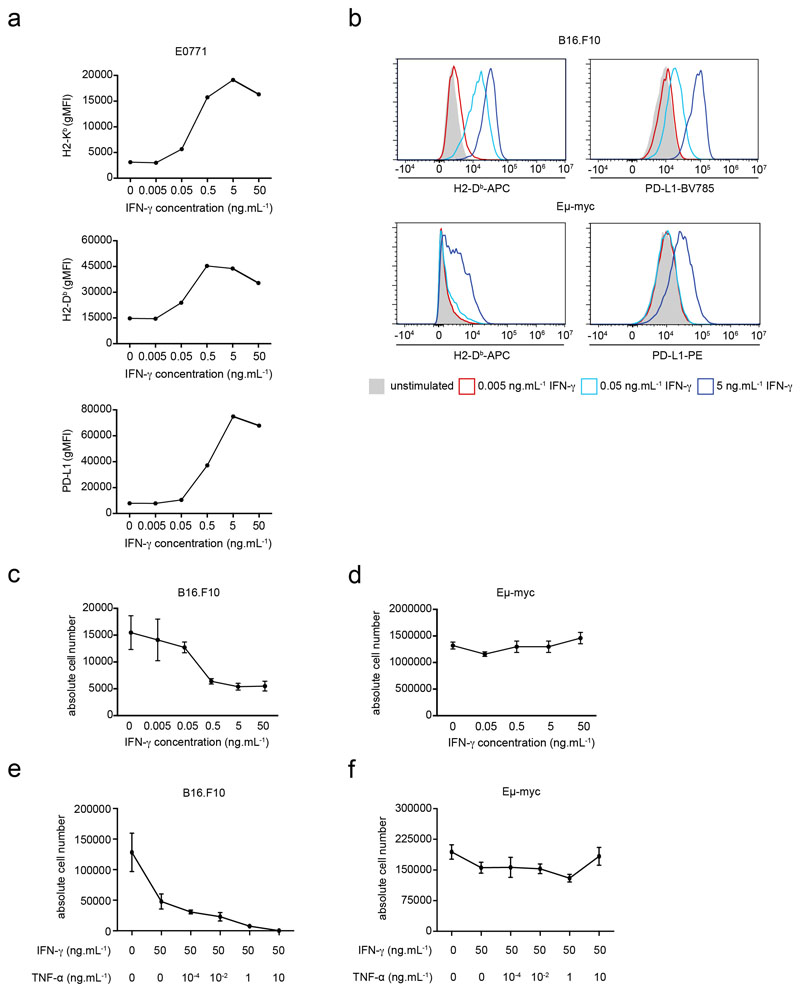
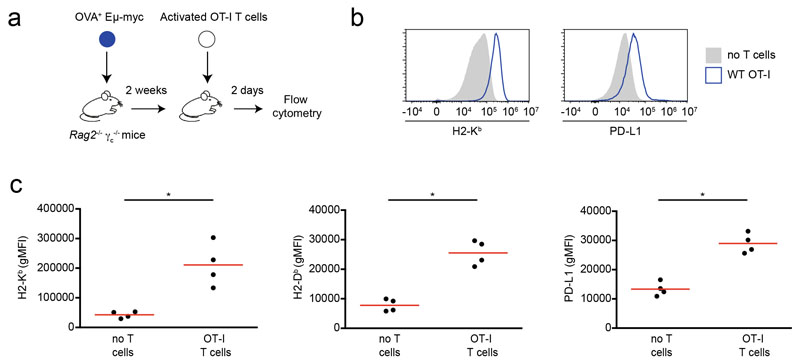
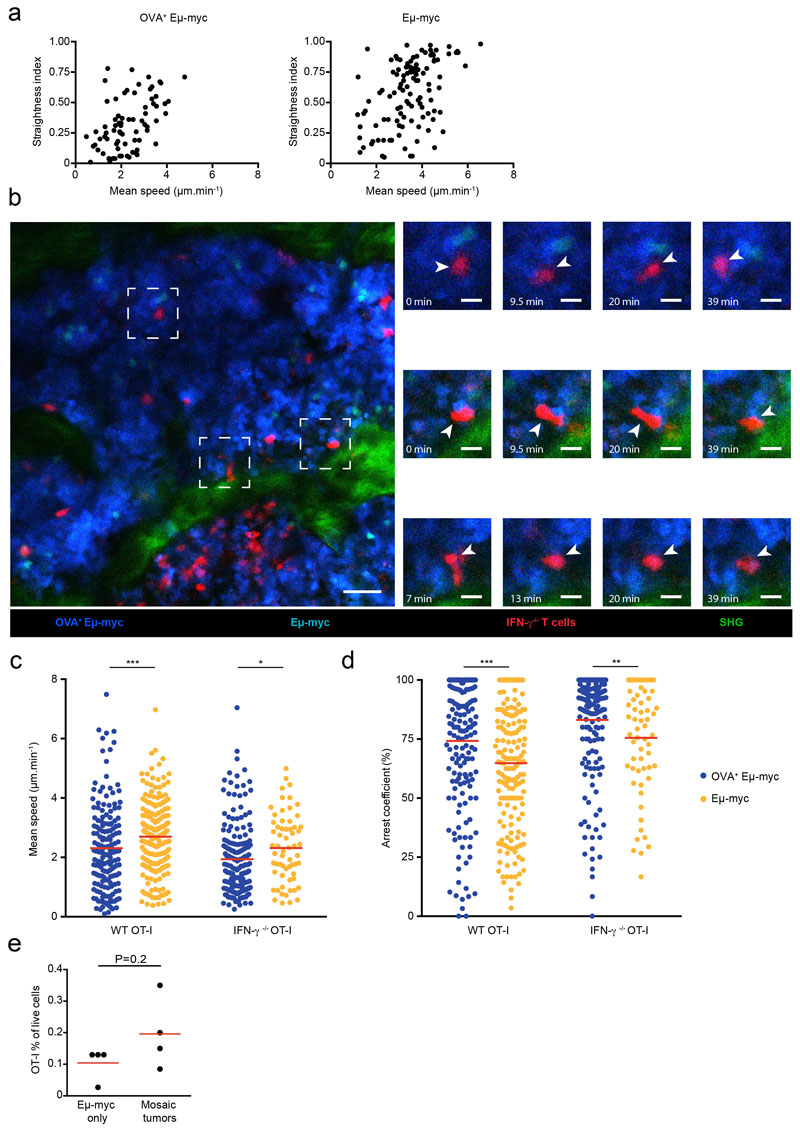
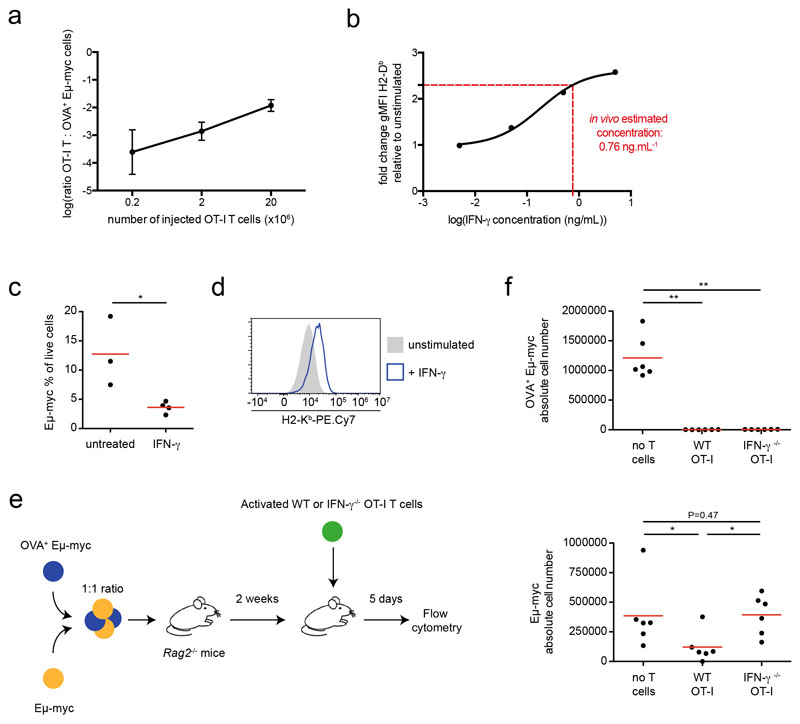
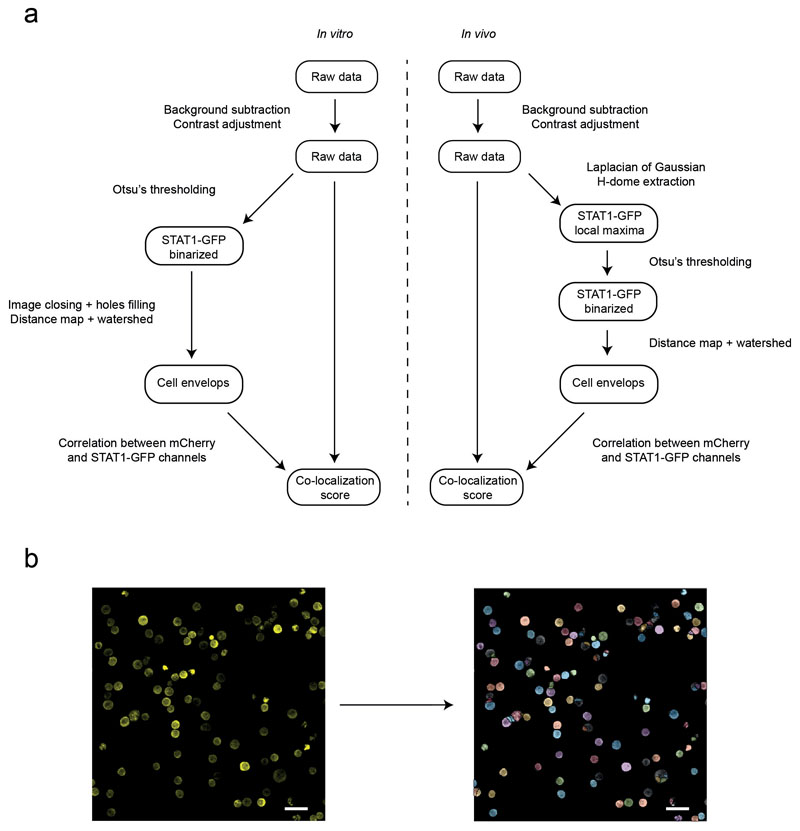
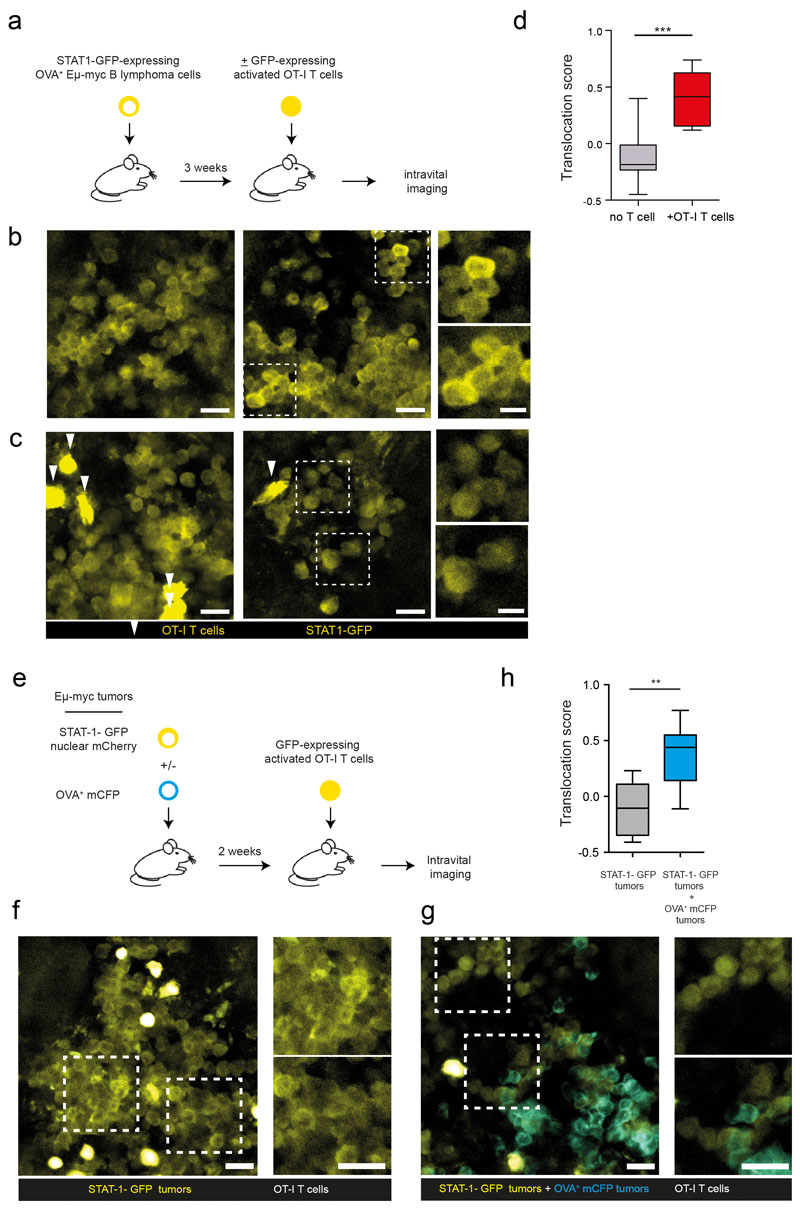
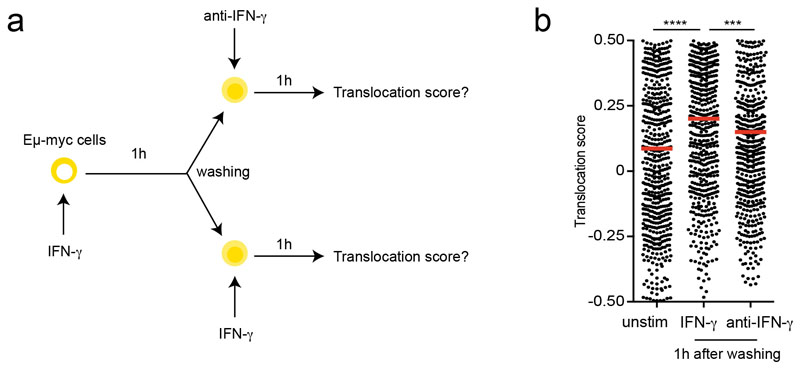
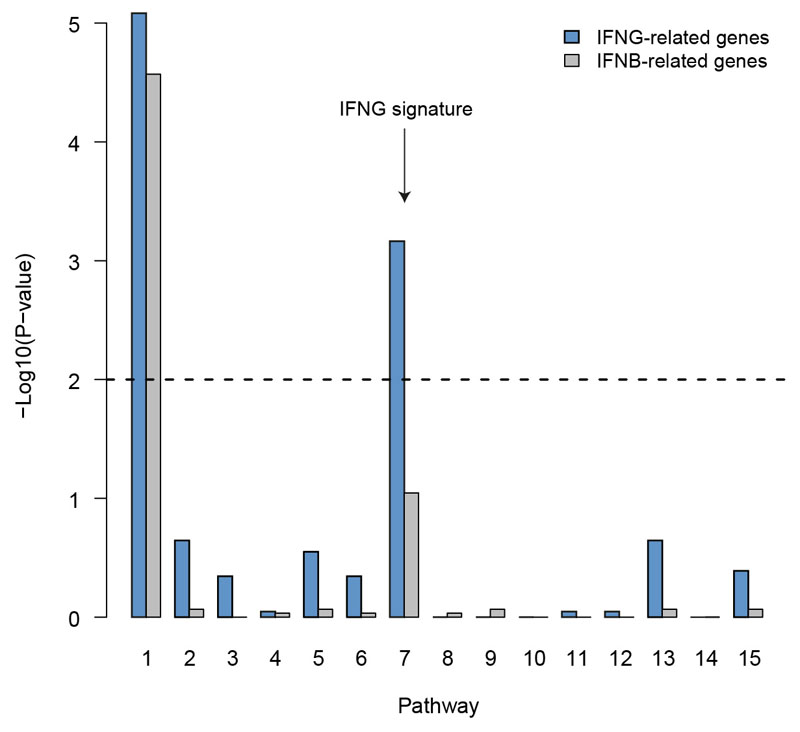
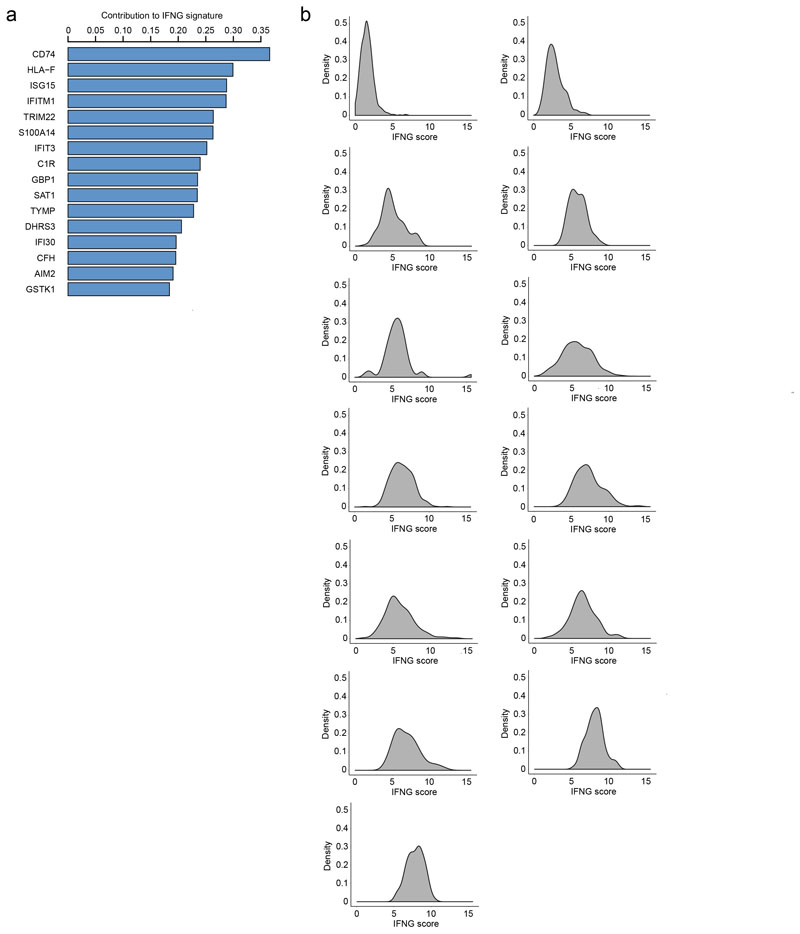
The cytokine IFN-γ produced by tumor-reactive T cells is a key effector molecule with pleiotropic effects during anti-tumor immune responses. While IFN-γ production is targeted at the immunological synapse, its spatiotemporal activity within the tumor remains elusive. Here, we report that while IFN-γ secretion requires local antigen recognition, IFN-γ diffuses extensively to alter the tumor microenvironment in distant areas. Using intravital imaging and a reporter for STAT1 translocation, we provide evidence that T cells mediate sustained IFN-γ signaling in remote tumor cells. Furthermore, tumor phenotypic alterations required several hours of exposure to IFN-γ, a feature that disfavored local IFN-γ activity over diffusion and bystander activity. Finally, single-cell RNA-seq data from melanoma patients also suggested bystander IFN-γ activity in human tumors. Thus, tumor-reactive T cells act collectively to create large cytokine fields that profoundly modify the tumor microenvironment.


Conflict of interest statement

Competing interests statement The authors declare no competing interests.

Figures

Figure 1
Figure 1. T cell-derived IFN-γ induces phenotypic changes in the tumor micro-environment.
a-b IFN-γ induces phenotypic changes in tumor cells in vitro. Eμ-myc B lymphoma (a) or B16.F10 melanoma (b) cells were stimulated with indicated IFN-γ concentrations in vitro for 24h. H2-Kb (left), H2-Db (middle) and PD-L1 (right) surface expression was then analyzed by flow cytometry. Each dot represents the mean of 3 technical replicates. Representative of 2 (B16.F10) or 3 (Eμ-myc) independent experiments. c-g T cell-derived IFN-γ increases MHC class I and PD-L1 levels in tumor and tumor-infiltrating immune cells. c Experimental set-up. Rag2-/- mice were injected i.v with OVA-expressing Eμ-myc B lymphoma cells. On day 12-13, in vitro activated WT or IFN-γ -deficient OT-I CD8+ T cells were injected i.v. Two days later, the recipient bone marrow was harvested and analyzed by flow cytometry. d Intracellular IFN-γ staining was performed in the absence of in vitro restimulation. Dot plots showing IFN-γ production by intratumoral WT OT-I T cells but not IFN-γ -deficient OT-I T cells. Data are representative of n=6 mice per group. e Representative example of histograms showing H2-Kb surface expression on tumor cells isolated from the bone marrow of mice that were left untreated (filled grey) or injected with either WT OT-I T cells (line, blue) or IFN-γ -deficient OT-I T cells (line, red). Data are representative of two independent experiments with n=6 mice per group. f H2-Kb (left), H2-Db (middle) and PD-L1 (right) surface expression on tumor cells isolated from mice treated or not with the indicated OT-I T cell population, as assessed by flow cytometry. Each dot represents one mouse. Red lines indicate mean values. Data are representative of two independent experiments with n=6 mice per group. (** P< 0.01, two-tailed Mann Whitney U-test). g H2-Kb surface expression on NK cells (left), monocytes (middle) and neutrophils (right) isolated from mice treated or not with the indicated OT-I T cells, as assessed by flow cytometry. Red lines indicate mean values. Data are representative of two independent experiments with n=6 mice per group. (* P<0.05, ** P< 0.01, two-tailed Mann Whitney U-test). h Recipients with established Eμ-myc B cell lymphoma were treated with anti-CD19 CAR T cells and analyzed 2 days later. H2-Kb (left) and PD-L1 (right) surface expression on tumor cells isolated from mice left untreated or treated with WT or IFN-γ -deficient CAR T cells. Red lines indicate mean values. Data are representative of 2 independent experiments with n=3 mice per group. (****, P<0.0001, ANOVA, with Tukey's test for multiple comparisons).
Figure 2
Figure 2. Tumor antigen expression drives the selective accumulation and arrest of intratumoral T cells
a Experimental set-up. Rag2-/- mice were injected with a 1:1 mixture of OVA-expressing and non-expressing Eμ-myc B lymphoma cells, labeled with CFP and YFP, respectively. On day 12-13, mice were injected with activated GFP+ OT-I T cells. Two days later, intravital imaging of the bone marrow was performed. Scale bar: 50μm b-g CD8+ OT-I T cells specifically accumulate and arrest in antigen-expressing cellular patches of mosaic tumors. b Left. Representative image of OVA+ (blue) or OVA- (orange) tumor patches infiltrated with OT-I T cells (green). Scale bar: 50 μm. Right. Time lapse images (corresponding to the dashed squares) showing OT-I T cells (pointed by arrows) forming stable contacts with OVA+ Eμ-myc cells but not with OVA- Eμ-myc cells. Scale bar: 15 μm. Representative of two independent experiments with n=3 mice in each experiment. c Individual tracks of OT-I T cells located either in OVA+ tumor patches (blue) or OVA- tumor patches (orange). Numbers indicate distance in μm. d-f Graphs show mean speed (d), straightness (e) and arrest coefficient (f) of individual OT-I T cells located in OVA+ or OVA- tumor patches. Only tracks that were at least 5 min long were considered. g Maximal duration of interaction of individual OT-I T cells with OVA+ or OVA- Eμ-myc cells measured during 45 min long movies. Results in c-g are from 5 movies obtained in two independent experiments with 3 mice per experiment. In d-g, each dot represents one individual track (n=75 OT-I tracks in OVA+ tumor patches, n= 103 OT-I tracks in OVA- tumor patches). Red lines indicate mean values. (****, P<0.0001, two-tailed Mann Whitney U-test).
Figure 3
Figure 3. Extensive bystander IFN-γ activity in the tumor microenvironment
a-f Bystander activity of IFN-γ in the tumor microenvironment of B cell lymphomas. Rag2-/- mice were injected with either Eμ-myc alone or a 1:1 mixture of Eμ-myc and OVA-expressing Eμ-myc B lymphoma cells (labeled with different fluorescent proteins). On day 12-13, recipients were injected with OT-I T cells or left untreated. Two days later, the bone marrow of the mice was recovered and analyzed by flow cytometry. a Representative histograms of H2-Kb and PD-L1 surface expression on OVA-expressing (left) or non-expressing (right) Eμ-myc B lymphoma cells isolated from mice bearing mosaic tumors and injected with OT-I T cells (blue line) or left untreated (filled grey). Data are representative of 3 independent experiments with n=4 mice per group in each experiment. b-d H2-Kb, H2-Db and PD-L1 surface expression on tumor cells from mice injected with Eμ-myc cells only (black) or a 1:1 mixture of OVA-expressing (blue) and non-expressing (orange) Eμ-myc cells. Each dot represents one mouse. Black lines indicate mean values. Data are representative of 3 independent experiments with n=4 mice per group in each experiment. (* P<0.05, two-tailed Mann Whitney U-test). e Proposed models for IFN-γ diffusion in the tumor microenvironment. See text for details. f Representative histograms of surface expression of H2-Db and H2-Kb on OVA-expressing tumor cells isolated from mice either left untreated (filled grey) or injected with 2x10⁶ (light blue line) or 20x106 (dark blue line) OT-I T cells. Data are representative of n=5 mice per group. g-i Bystander activity of IFN-γ in solid tumors. Rag2-/- mice were injected with a 1:1 mixture B16 and OVA-expressing B16 cells (labeled with different fluorescent proteins). After one week, recipients were injected with OT-I T cells or left untreated. Two days later, tumors were digested and analyzed by flow cytometry. H2-Kb, H2-Db and PD-L1 surface expression on tumor cells from mice injected with a mixture of OVA-expressing (blue) and non-expressing (orange) B16.F10 cells. Each dot represents one mouse. Black lines indicate mean values. Data are representative of 2 independent experiments with n=4 mice per group in each experiment. (* P<0.05, two-tailed Mann Whitney U-test).
Figure 4
Figure 4. T cells mediate widespread and sustained STAT1 activity in the tumor microenvironment.
a-b Male Eμ-myc B lymphoma cells were transduced to express a STAT1-GFP reporter and a nuclear mCherry protein. Measurement of STAT1 activity on Eμ-myc B cells cultured in the absence or presence of recombinant IFN-γ. a Images and graphs depict the quantification of STAT1-GFP (yellow) and nuclear mCherry (red) fluorescence intensity across the indicated lines for a representative cell prior to (upper panels) or after (lower panels) IFN-γ exposure. Scale bar, 5 μm. b Translocation score was computed automatically for cells prior to or after IFN-γ exposure. Each dot represents one cell (unstimulated n=106 cells, IFN-γ n=135 cells). (***, P<0.001, two-sided Tukey range test). Error bars indicate mean±SD. c-g Recipient female Rag2-/- mice were injected with H-Y+ Eμ-myc B lymphoma cells expressing the STAT1-GFP reporter and a nuclear mCherry protein. After 3 weeks, activated CD8+ T cells bearing the anti-H-Y MataHari TCR were injected i.v. Three days later, recipients were subjected to intravital imaging of the bone marrow. c-e Detection of nuclear STAT1-GFP in T cell-infiltrated tumors. c Representative two-photon images (scale bar: 20μm), highlighting three specific regions (insets, scale bar: 10μm) of the tumor in mice transferred or not with MataHari T cells. d Quantification of STAT1-GFP (yellow) and nuclear mCherry (red) fluorescence intensity across the indicated line for a representative tumor cell in mice left untreated (upper panels) or transferred with MataHari T cells (lower panels). Scale bar, 5 μm. e Translocation score was computed automatically from two-photon images obtained in mice left untreated (no T cells) or transferred with MataHari T cells. Each dot represents one tumor cell (no T cell n=92 cells, MataHari T cells n=115 cells). (***, P<0.001, two-sided Tukey range test). Error bars indicate mean±SD. f STAT1 translocation in tumor cells is largely independent of the distance to the nearest T cells. The translocation score is graphed for each tumor cell as a function of the calculated distance to the nearest T cell. Each dot represents one cell (n=115 cells; R represents Pearson's correlation coefficient, statistical significance was assessed using a Fisher test). g STAT1-GFP translocation is sustained in vivo. Representative time-lapse images showing the maintenance of STAT1-GFP translocation during the imaging period (scale bar: 5μm). Data shown in b-g are representative of two independent experiments with 3 mice per group in each experiment.
Figure 5
Figure 5. Sustained signaling is required to alter tumor cell phenotype.
a Experimental set-up. Eμ-myc B lymphoma cells were stimulated with 5 ng.mL-1 IFN-γ. At 1h or 6h, the stimulation was blocked by adding 50 μg.mL-1 anti-IFN-γ mAb. At 24h, cells were recovered for mRNA sequencing. b Heatmap of differentially expressed genes. Gene expression is normalized by row. c Venn diagrams of differentially expressed genes between the various stimulated and control samples. d-e Tumor cells were stimulated with 5 ng.mL-1 IFN-γ. At 1h or 6h, the stimulation was blocked by adding 50 μg.mL-1 anti-IFN-γ mAb. At 24h, cells were recovered and analyzed by flow cytometry. Graphs represent H2-Kb (left), H2-Db (middle) and PD-L1 (right) surface expression after indicated durations of stimulation on Eμ-myc (d) and B16.F10 (e) models. Each dot represents the mean of 3 technical replicates. Representative of 3 independent experiments. f-g Normalized Enrichment Score of the ten most enriched motifs for the differentially expressed genes between 6h-stimulated (f) and 24h-stimulated (g) samples and control samples.
Figure 6
Figure 6. Assessing IFN-γ bystander activity in human melanoma samples
Measurement of IFNG signature in the tumor microenvironment of melanoma patients using single-cell RNA-seq. a Contribution of distinct cell clusters to IFNG production. Data are compiled from all patients analyzed (n=8). b Gene contribution to the IFNG signature in the monocyte/macrophage cluster. c Association between the percentage of IFNG+ cells among CD8+ cells and the IFNG score in monocytes/macrophages. (R represents Pearson's correlation coefficient, statistical significance was assessed using a Fisher test). d Distribution of IFNG signature in monocytes/macrophages from three different patients harboring distinct indicated frequencies of IFNG+ CD8+ T cells. e Gene contribution to the IFNG signature in the neutrophil cluster. f Association between the percentage of IFNG+ cells among CD8+ cells and the IFNG score in neutrophils. (R represents Pearson's correlation coefficient, statistical significance was assessed using a Fisher test). g Distribution of IFNG signature in neutrophils from three different patients harboring distinct indicated frequencies of IFNG+ CD8+ T cells.
None
None
None
None
None
None
None
None
None
None

Comment in

  • Carpet-bombing tumors with IFN-γ.
    Hu KH, Krummel MF. Hu KH, et al. Nat Cancer. 2020 Mar;1(3):270-272. doi: 10.1038/s43018-020-0042-6. Nat Cancer. 2020. PMID: 35122031 No abstract available.

References

    1. Kaplan DH, et al. Demonstration of an interferon gamma-dependent tumor surveillance system in immunocompetent mice. Proc Natl Acad Sci US A. 1998;95:7556–7561. - PMC - PubMed
    1. Street SE, Cretney E, Smyth MJ. Perforin and interferon-gamma activities independently control tumor initiation, growth, and metastasis. Blood. 2001;97:192–197. - PubMed
    1. Dunn GP, Koebel CM, Schreiber RD. Interferons, immunity and cancer immunoediting. Nat Rev Immunol. 2006;6:836–848. - PubMed
    1. Garris CS, et al. Successful Anti-PD-1 Cancer Immunotherapy Requires T Cell-Dendritic Cell Crosstalk Involving the Cytokines IFN-gamma and IL-12. Immunity. 2018;49:1148–1161 e1147. - PMC - PubMed
    1. Gao J, et al. Loss of IFN-gamma Pathway Genes in Tumor Cells as a Mechanism of Resistance to Anti-CTLA-4 Therapy. Cell. 2016;167:397–404 e399. - PMC - PubMed

Publication types