. 2020 May;1(5):546-561.
doi: 10.1038/s43018-020-0066-y. Epub 2020 May 22.

The T cell differentiation landscape is shaped by tumour mutations in lung cancer

Collaborators, Affiliations

The T cell differentiation landscape is shaped by tumour mutations in lung cancer

Ehsan Ghorani et al. Nat Cancer. 2020 May.

Abstract

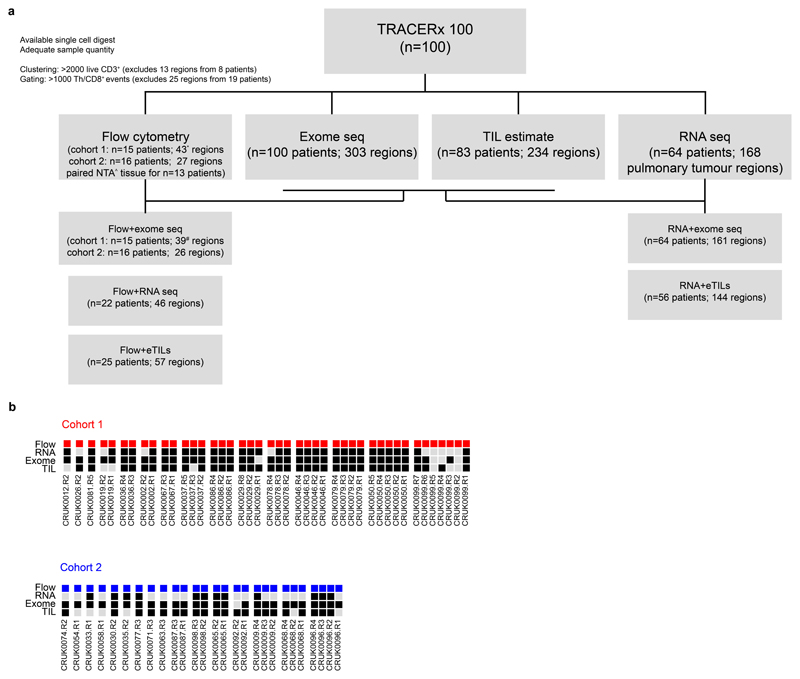
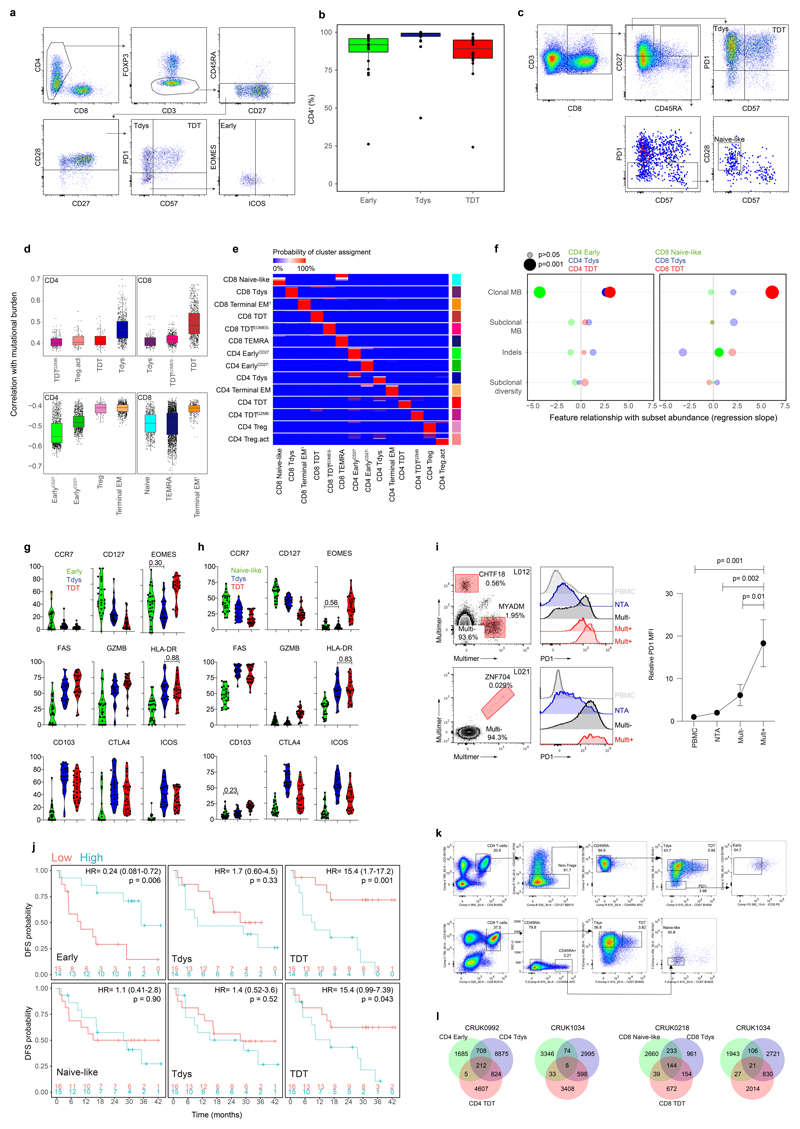
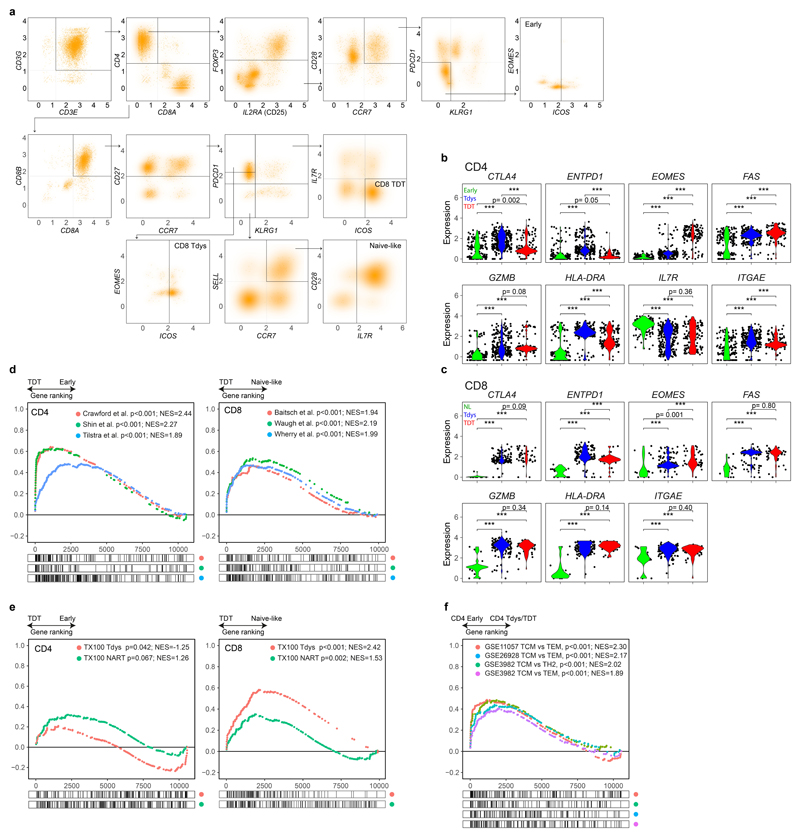
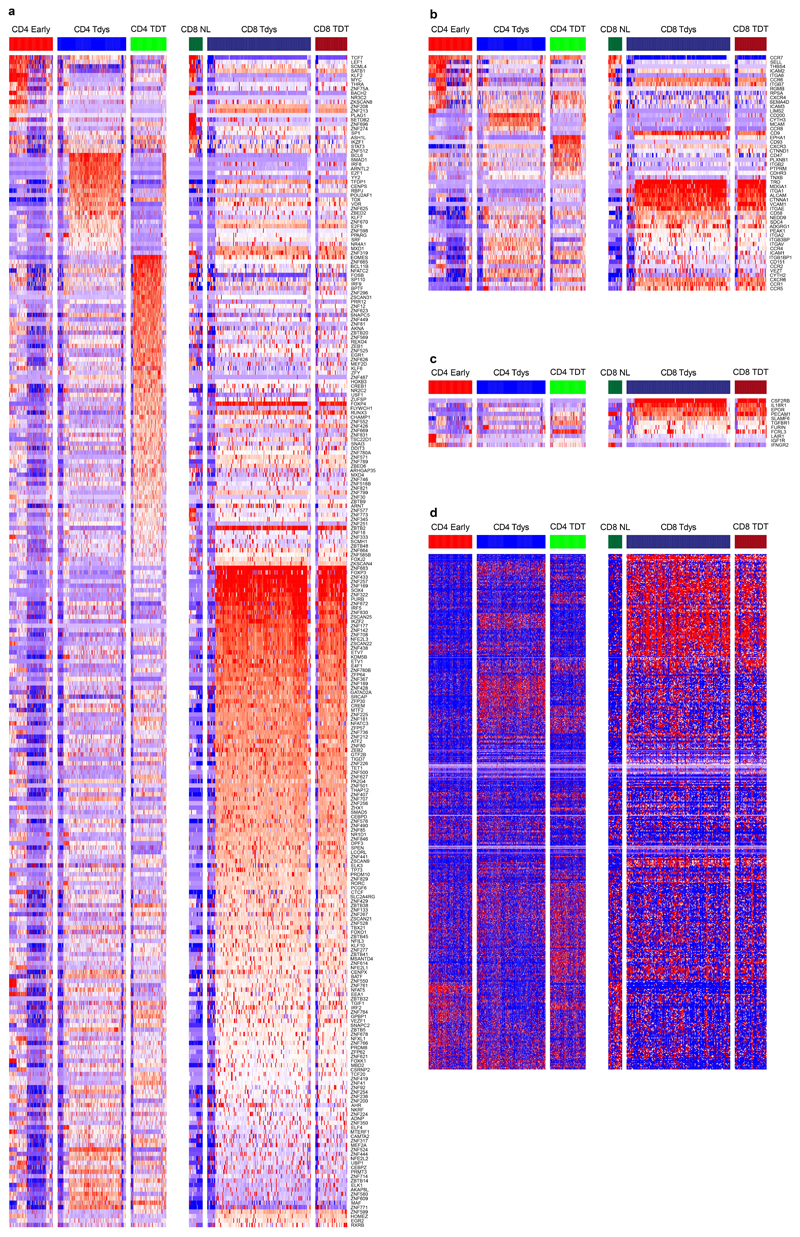
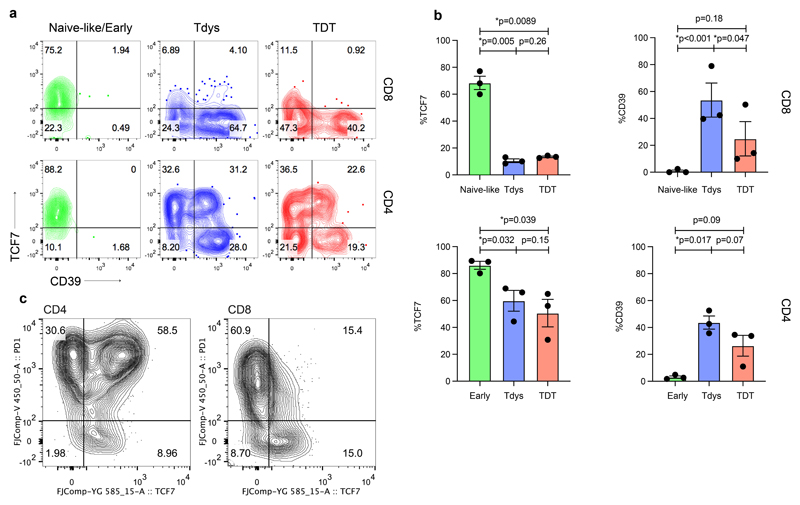
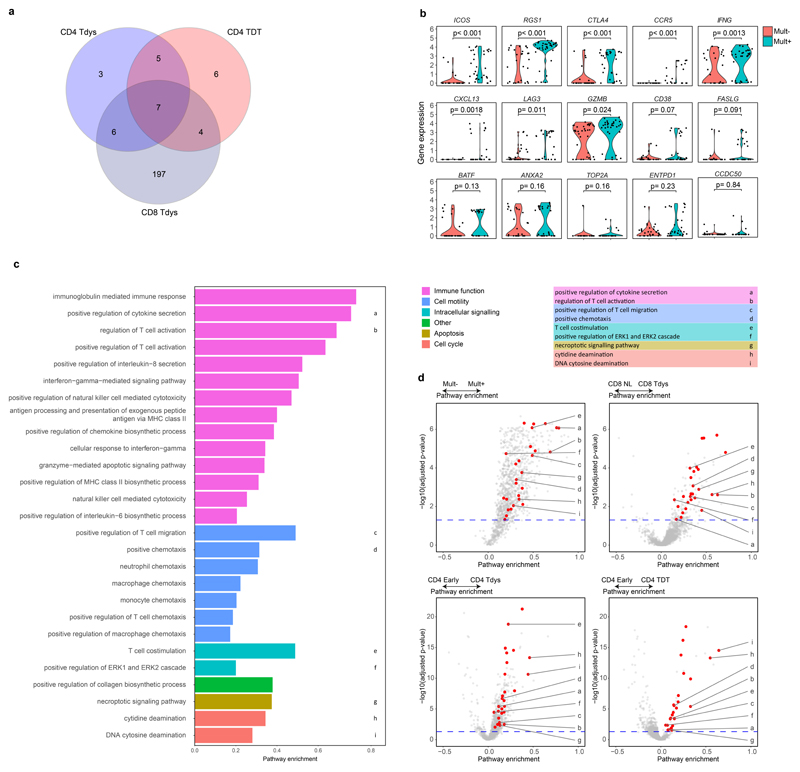
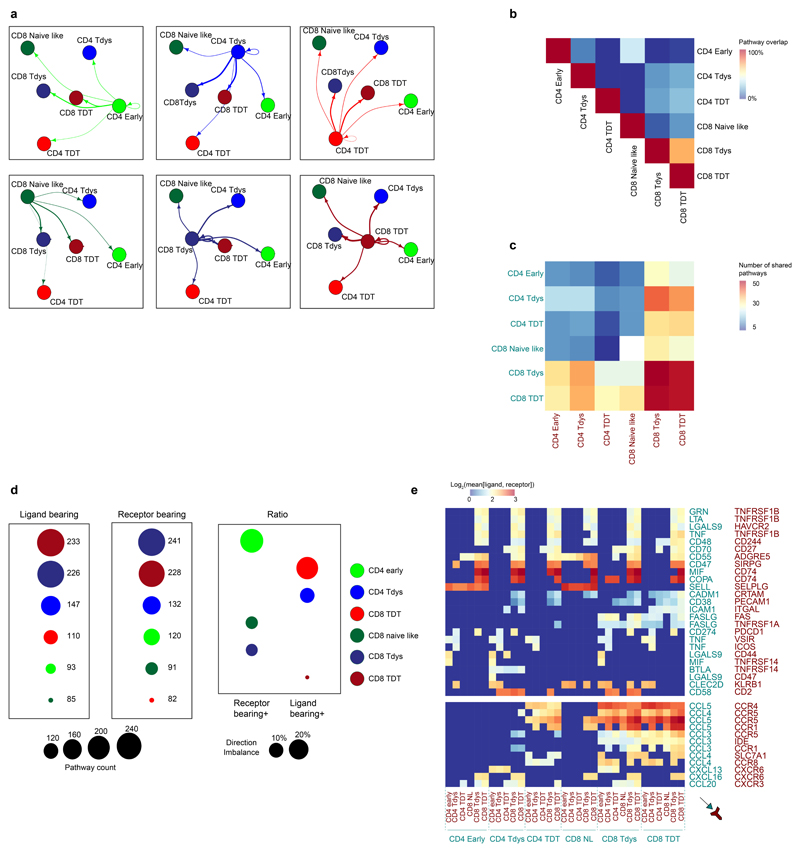
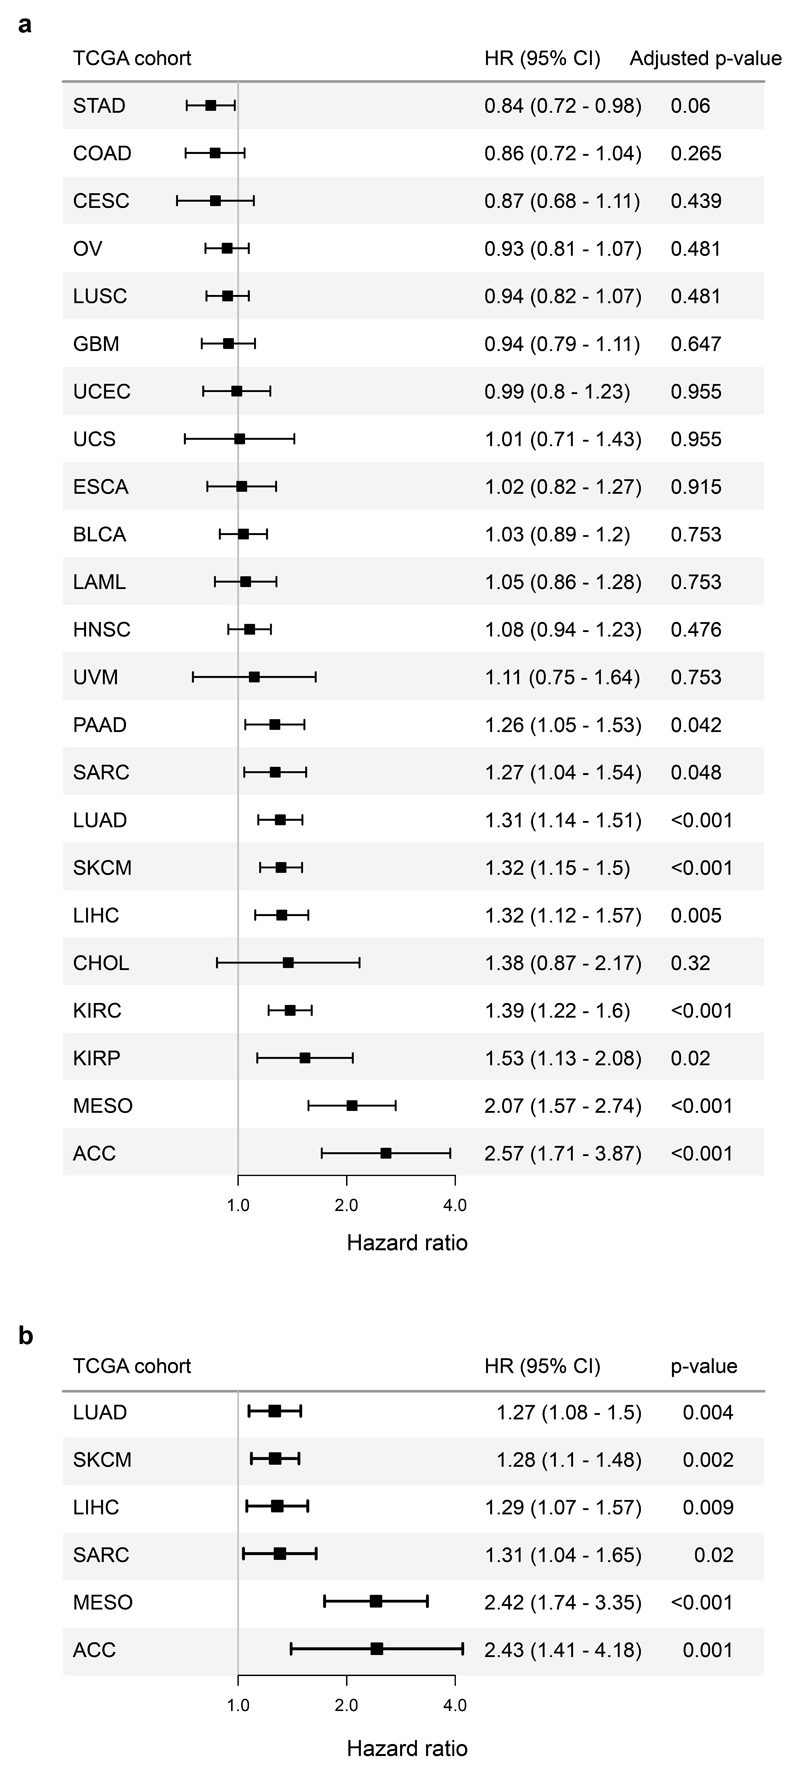
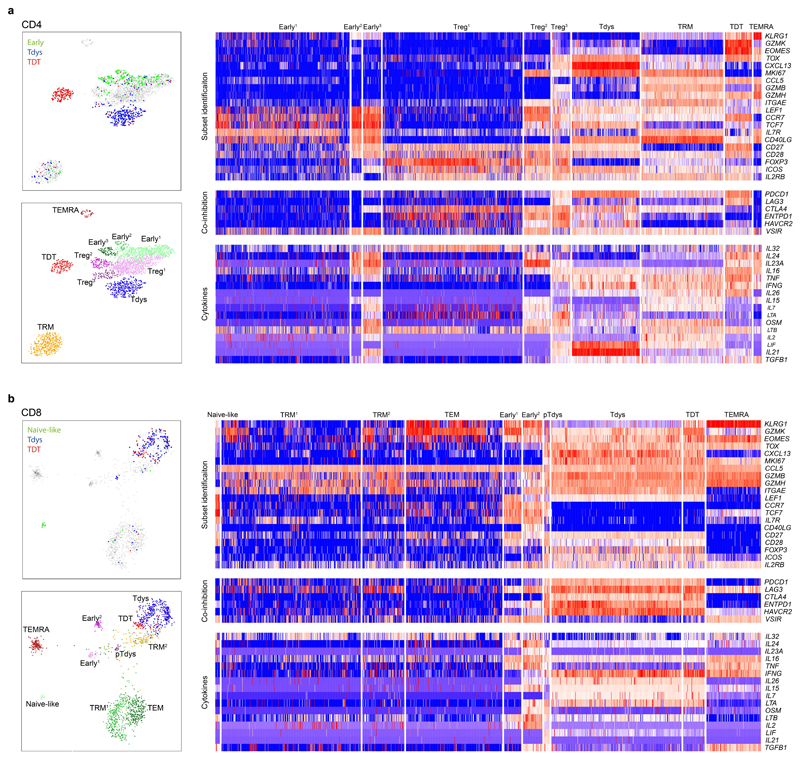
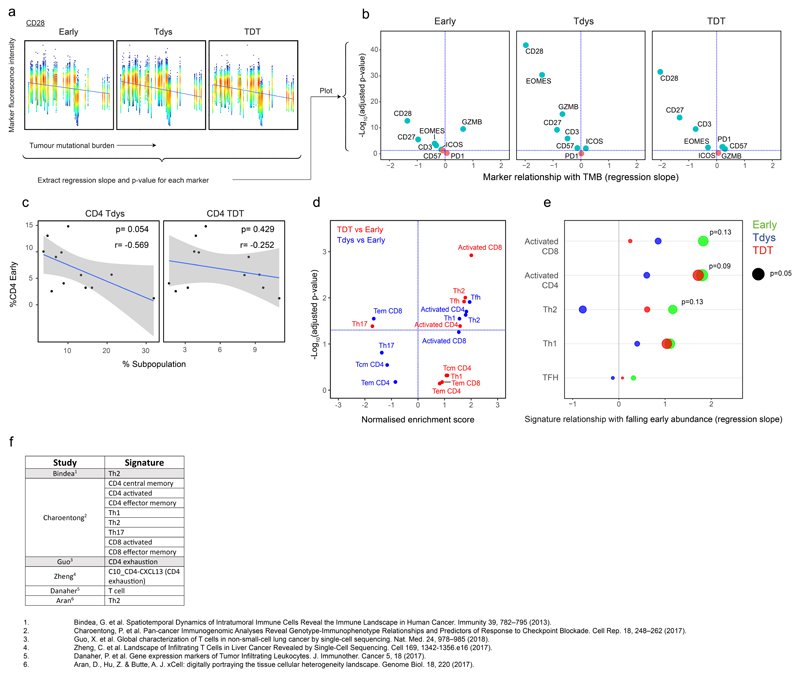
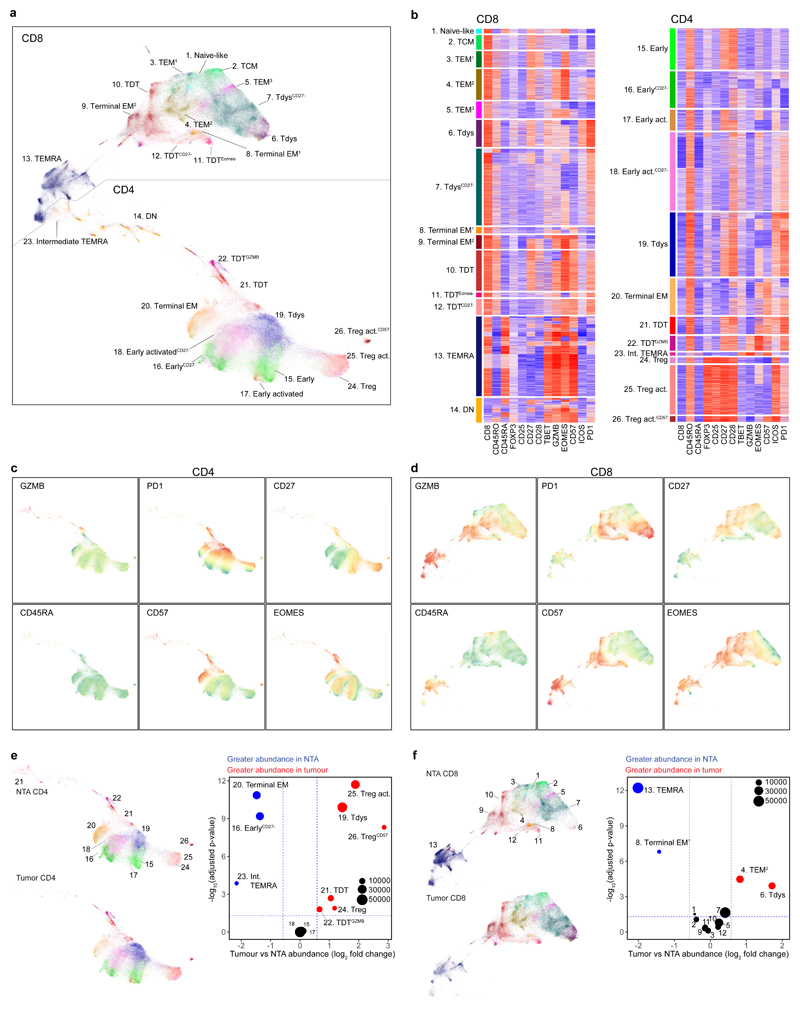
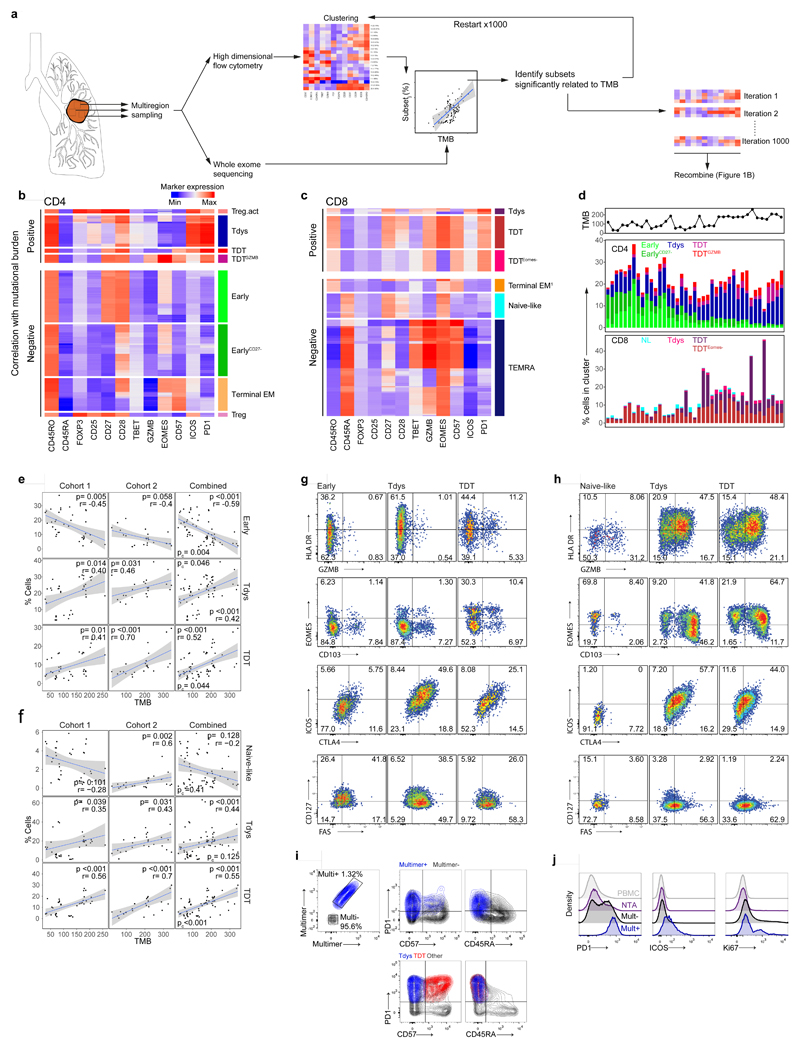
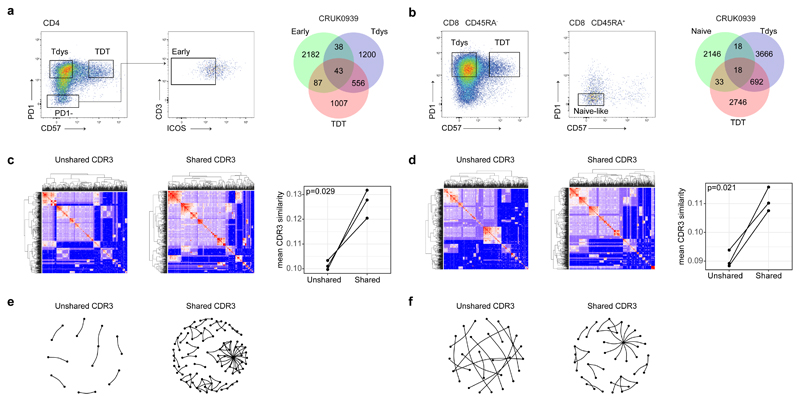
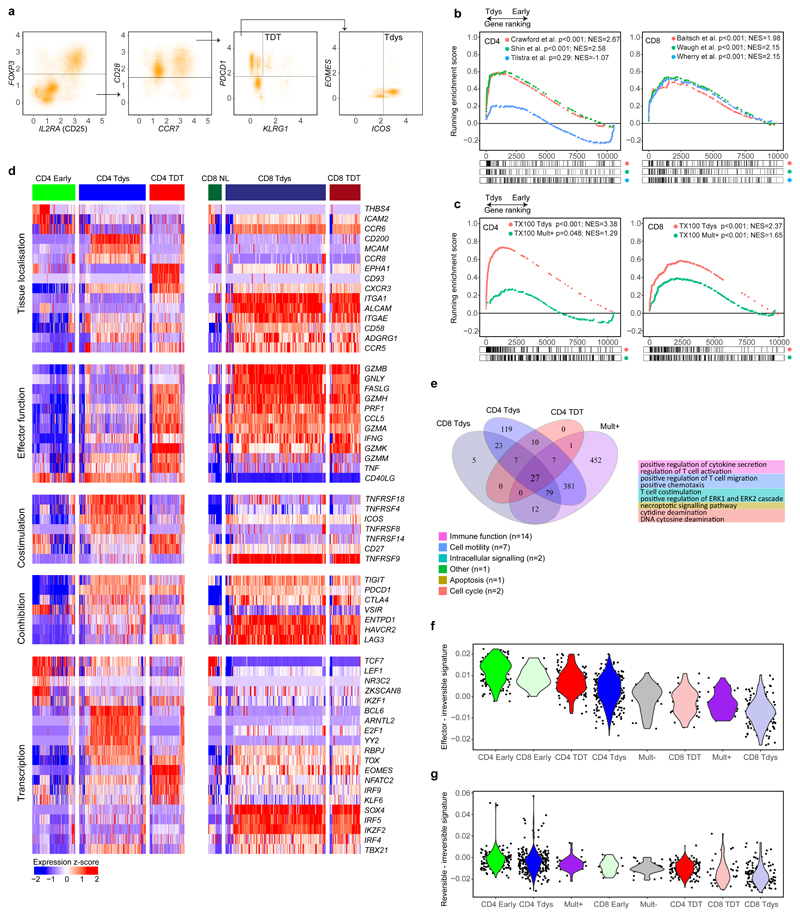
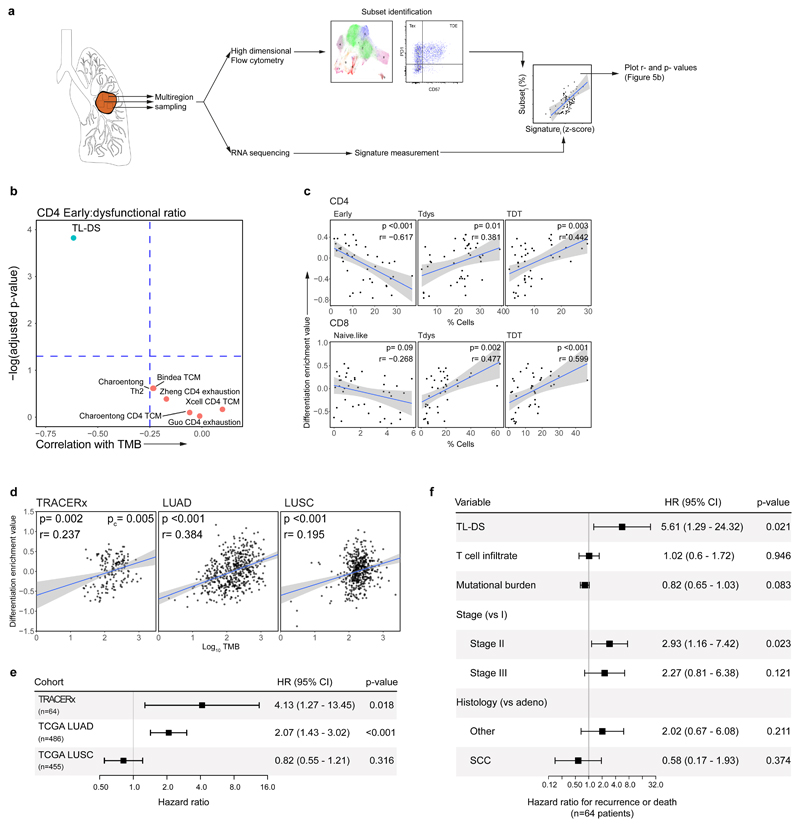
Tumour mutational burden (TMB) predicts immunotherapy outcome in non-small cell lung cancer (NSCLC), consistent with immune recognition of tumour neoantigens. However, persistent antigen exposure is detrimental for T cell function. How TMB affects CD4 and CD8 T cell differentiation in untreated tumours, and whether this affects patient outcomes is unknown. Here we paired high-dimensional flow cytometry, exome, single-cell and bulk RNA sequencing from patients with resected, untreated NSCLC to examine these relationships. TMB was associated with compartment-wide T cell differentiation skewing, characterized by loss of TCF7-expressing progenitor-like CD4 T cells, and an increased abundance of dysfunctional CD8 and CD4 T cell subsets, with significant phenotypic and transcriptional similarity to neoantigen-reactive CD8 T cells. A gene signature of redistribution from progenitor-like to dysfunctional states associated with poor survival in lung and other cancer cohorts. Single-cell characterization of these populations informs potential strategies for therapeutic manipulation in NSCLC.


Conflict of interest statement

Competing interest statement S.A.Q., K.S.P. and C.S. are co-founders of Achilles Therapeutics. C.S. receives grant support from Pfizer, AstraZeneca, BMS, Roche-Ventana and Boehringer-Ingelheim. C.S. has consulted for Pfizer, Novartis, GlaxoSmithKline, MSD, BMS, Celgene, AstraZeneca, Illumina, Genentech, Roche-Ventana, GRAIL, Medicxi, and the Sarah Cannon Research Institute. C.S. is a shareholder of Apogen Biotechnologies, Epic Bioscience, GRAIL, and has stock options in and is co-founder of Achilles Therapeutics. R.R., N.M. and G.A.W. have stock options in and have consulted for Achilles Therapeutics. J.L.R and M.A.B have consulted for Achilles Therapeutics. P.D.B and M.W.S are employees of Achilles Therapeutics.

Figures

Extended Data Fig. 1
Extended Data Fig. 1. Sample data availability.
(a) Sample data availability and disposition for TRACERx 100 flow cytometry and RNA sequencing cohorts, with details of matched data relevant to key analyses. * 41 regions had >2000 live CD3+ events; ^ 18 NTA specimens in total, including from two patients without matched tumour tissue; # 37 regions had WES data and >2000 live CD3+ events. (b) Patients and regional data availability for flow cytometry cohorts 1 and 2. All patients with at least one tumour region are shown.
Extended Data Fig. 2
Extended Data Fig. 2. Progenitor-like and dysfunctional T cell subsets correlate with clonal mutational burden and their abundance associates with patient outcomes.
(a) Gating strategy to define CD4 Early, Tdys and TDT populations. (b) For n=20 lung samples with distinct CD4 staining, the percentage of CD4+ cells amongst manually gated Early, Tdys and TDT populations from n=61 total samples, is shown for each subset. (c) Gating strategy to define CD8 Naive-like, Tdys and TDT populations. (d) Boxplots show the Spearman correlation between cluster abundance and TMB (n=39 regions from 15 patients) across all iterations (n=1000) of the clustering workflow. Each point represents the result of a single run. (e) Heatmap showing cluster stability across 1000 clustering iterations. The cluster identity of each cell was determined for one representative iteration (labels are on the left of the heatmap). For each cell, the probability of being assigned to each cluster (labelled below the plot) across all iterations is represented. (f) Relationship between CD4 population abundance (60 regions from 29 patients) and tumor genomic features. Two-sided p-values and regression slopes (β coefficients) reflecting the direction and magnitude of relationships tested are from linear mixed effects regression models accounting for tumor histology and multiregionality. (g, h) Percentage of cells amongst manually gated cohort 2 CD8 (g) and CD4 (h) populations positive for key markers (26 regions from 16 patients). All comparisons p<0.05 by two-sided Wilcoxon rank sum test except for those labelled. Violin plots show median and interquartile range. (i) Neoantigen-multimer reactive (Mult+) CD8 T cell identification and PD1 expression for two patients in comparison to matched multimer non-reactive (Mult-), NTA and circulating (PBMC) CD8 T cells. Line graph shows CD8 T cell PD1 MFI (relative to PBMC) in Mult+, Mult- and NTA populations. Data points show mean PD1 MFI from n=4 multimer reactive populations from n=3 patients, error bars show SEM. P-values are from paired 2-Way ANOVA (Fisher’s least significant difference test). (j) Disease free survival (DFS) probability of patients with high vs. low abundance of CD4 (upper row) and CD8 subsets (from n=29 and n=31 patients respectively), categorized according to the median value. The number of patients at risk at each time point, log-rank p-value and hazard ratios with 95% confidence intervals are shown. (k) Sort strategy for CD4 (top) and CD8 subsets, for TCRseq. (l) Venn diagrams show CDR3 beta chain sharing between CD4 (left two diagrams) and CD8 subsets, for two patients each. Boxplots in (b) and (d) represent median and interquartile range.
Extended Data Fig. 3
Extended Data Fig. 3. Identification and single cell transcriptomic characterization of progenitor-like and dysfunctional T cell subsets.
(a) Full gating strategy to identify the CD4 Early, CD8 Naïve-like, CD8 Tdys and CD8 TDT subsets by single T cell RNA expression. (b, c) Confirmation of CD4 (n=590 cells; b) and CD8 (n=206 cells; c) subset identity by evaluating expression of genes not used in the gating strategy but whose relative expression is known based on analysis of flow cytometry data. Each point represents an individual T cell and two-sided Wilcoxon rank sum test p-values are shown (***p<0.0001). Violin plots show the median and interquartile range. (d, e) GSEA to evaluate enrichment of gene sets upregulated in published T cell dysfunction datasets (d) and sorted CD8 Tdys and multimer reactive cells (e), amongst genes ranked by their expression in CD4 TDT vs. Early (143 vs. 175 cells) and CD8 TDT vs Naive-like populations (143 vs. 19 cells). For each gene set tested, the top 200 most differentially expressed genes were selected. Normalized enrichment scores (NES) and FDR adjusted p-values from permutation tests are shown. (f) GSEA to confirm the T central memory like transcriptional status of CD4 Early vs. Tdys/TDT subsets (175 vs. 415 cells). Normalized enrichment scores (NES) and FDR adjusted p-values by permutation test are shown.
Extended Data Fig. 4
Extended Data Fig. 4. Expression profile of progenitor-like and dysfunctional T cell subsets.
(a) Differentially expressed transcription factor encoding genes in CD4 (n=590 cells) and CD8 (n=206 cells) subsets at the single T cell RNA expression level. Each gene has >2-fold differential expression in one subset with FDR adjusted p<0.05 (quasi-likelihood F-test with edgeR). Differentially expressed genes encoding adhesion molecules and chemokine receptors (b) and ITIM containing proteins (c); All genes shown are >2-fold differentially expressed between subsets within the same compartment, FDR adjusted p<0.05. (d) Expression of the top 500 most variably expressed genes between CD4 and CD8 subsets.
Extended Data Fig. 5
Extended Data Fig. 5. TCF7 and CD39 protein expression in CD4 and CD8 T cell subsets.
(a) Flow cytometry of concatenated data from n=3 patients (CRUK0939, CRUK0952 and CRUK1037) in manually-gated subsets of tumor infiltrating CD4 (Early; CD45RA-PD1-FOXP3-CD27+CCR7+, Tdys; FOXP3-CD27+PD1hiCD57-, TDT FOXP3-CD27+PD1hiCD57+) and CD8 (Naïve-like; CD45RA+PD1-CD27+CD57-, Tdys; CD45RA-CD27+PD1hiCD57-, TDT CD45RA-CD27+PD1hiCD57+) T cells. (b) Quantification of TCF7 and CD39 expression in CD8 (top row) and CD4 subsets identified amongst n=3 patients in (a). Error bars represent the SEM. (c) PD1 vs. TCF7 expression of CD4 and CD8 TILs from the same patients as (a).
Extended Data Fig. 6
Extended Data Fig. 6. Transcriptional similarity and gene pathway analysis amongst dysfunctional subsets.
(a) For each gene set tested in enrichment analysis, leading edge genes shared between at least two sets were identified and their overlap between CD4 and CD8 dysfunctional population is shown. (b) Of the 19 shared leading edge genes common to both CD4 and CD8 populations, 17 were expressed in single cell RNA sequencing data from multimer reactive cells. Violin plots show expression in multimer positive (n=36) vs. negative cells (n=39). Unadjusted two-sided Wilcoxon rank sum test p-values are shown. Violin plots represent the median and interquartile range. (c) Bar chart shows enrichment in multimer reactive vs. non-reactive cells of shared GO terms that distinguish dysfunctional T cell populations, identified in Figure 3E. Selected pathways are identified in the table and their enrichment within each population vs. control is shown in (d). FDR adjusted two-sided Wilcoxon rank sum test p-values are represented. CD8 Tdys vs. Naive-like (143 vs. 19 cells), CD4 Tdys vs. Early (272 vs. 175 cells), CD4 TDT vs. Early (143 vs. 175 cells) and Mult+ vs. Mult- (36 vs. 39 cells)
Extended Data Fig. 7
Extended Data Fig. 7. Transcriptional evidence of signalling pathways active between T cell subsets.
(a) Network diagram of ligand–receptor interactions as determined by cellPhoneDB; Solid lines represent pathways between two populations, the width of each line is proportional to the number of pathways. For each pair of populations, pathways were split depending on which population is ligand-bearing vs. receptor-bearing. Arrows indicate communication from ligand-bearing to receptor-bearing populations. (b) Summary of overlap in reciprocal pathways between population pairs. The heatmap represents the Jaccard similarity index of overlapping pathways for each pair of populations. (c) Summary of directed pathway counts. The heatmap represents the number of pathways for each directed pair of populations. (d) Number of pathways where each population is the ligand-bearing partner (left column) or receptor-bearing partner (right column) and the ratio between the count of each group. (e) Summary of ligand–receptor interactions. Log2 means of the average expression level of receptor-ligand pair genes are shown.
Extended Data Fig. 8
Extended Data Fig. 8. Pan-TCGA association between a signature of T cell differentiation skewing and patient outcomes.
(a) Forest plot showing the relationship between the TL-DS signature and survival across TCGA cohorts (n=6853 patients). HRs and FDR adjusted p-values are from univariable Cox regression analysis. (b) Relationship between the TL-DS signature and survival, corrected for T cell infiltration, TMB and stage, in cohorts from (b) in which the signature predicted survival (9 cohorts, n=2418 patients). HRs and p-values are from multivariable Cox regression analysis. Cohorts in which the relationship was significant are shown.
Extended Data Fig. 9
Extended Data Fig. 9. Single T cell RNAseq cluster analysis.
(a, b) UMAP dimension reduction plot of NSCLC CD4 (a) and CD8 (b) TIL single cell RNA sequencing data (2469 and 1508 cells respectively). Manually identified subsets are located in the upper panels of A and B. Clustering analysis reveals 10 CD4 and 10 CD8 subsets (lower panels). Relative expression (z-score) of selected genes is shown in the adjacent heatmaps (each column represents a single cell).
Extended Data Fig. 10
Extended Data Fig. 10. Marker and transcriptional changes within the CD4 Early population in relation to TMB and subset abundance.
(a) Workflow to determine the relationship between flow cytometry measured marker expression intensity and TMB in CD4 Early (n=23,597 cells), Tdys (n=25,271 cells) and TDT (n=11,880 cells) subsets. Each point represents an individual cell, FDR adjusted two-sided p-values and regression coefficients were derived from linear mixed effects models accounting for patient histology and tumor multiregionality and plotted in (b). Volcano plots show the relationship between marker intensity and TMB for each CD4 subset. (c) Change in CD4 Tdys and TDT with Early abundance (as a percentage of all CD4+ cells, n=12 patients). Two-sided Pearson p- and r-values are shown. Shaded bands represents the 95% confidence interval of a linear regression slope. (d) GSEA of T helper subset signatures enriched in Tdys and TDT vs. Early (n=590 cells), using modules from Charoentong et al. 201778. Normalized enrichment scores (NES) and FDR adjusted p-values from permutation tests are shown. (e) Correlation between falling abundance of the CD4 Early population (175 cells, n=12 patients) and expression of gene signatures from (d) indicative of CD4 later differentiation state. Two-sided p-values and regression coefficients were derived from linear mixed effects models with patient as the random effect. Published T cell subset signatures used in the study are summarized in (f).
Figure 1
Figure 1. The landscape of tumour infiltrating CD4 and CD8 T cells in non-small cell lung cancer.
(a) T cell clusters identified in high dimensional flow cytometry analysis of n=41 regions from 15 patients with NSCLC are visualized by UMAP dimension reduction. (b) Heatmaps show min-max scaled, transformed expression of markers expressed by CD8 and CD4 T cells. Each row represents an individual cell from a sample of 10,000 cells from each population. UMAP projections show expression intensity of key markers in CD4 (c) and CD8 (d) T cells. (e, f) Analysis of differential cluster abundance in tumour (n=41 regions) vs. non-tumour adjacent (NTA; n=18 regions) tissue for CD4 (e) and CD8 (f) T cells. FDR adjusted p-values (quasi-likelihood F-test with edgeR) and log2 fold change values are represented for each cluster in the volcano plots, the size of points reflects cluster abundance.
Figure 2
Figure 2. T cell differentiation skewing occurs in association with tumour mutational burden.
(a) Workflow to identify clusters of intratumour T cells that vary in abundance in association with TMB. Heatmaps show min-max scaled, transformed marker expression of CD4 (b) and CD8 (c) clusters that vary positively (upper region of heatmaps) or negatively in abundance with TMB (Spearman’s rank test; n=37 regions from 15 patients). Cluster abundance was calculated as a proportion of all CD3+ cells in each region. (d) The abundance of CD4 and CD8 clusters identified in (b, c) for all tumour regions is shown. Regional TMB is indicated above the plot. NL, naive-like. (e, f) Populations found to vary in abundance with TMB by unsupervised analysis were manually gated within cohort 1 and a second validation set of n=26 regions from 16 patients drawn independently from the first 100 TRACERx cohort. Scatter plots show the relationship between population abundance and TMB for CD4 (e) and CD8 (f) subsets in cohorts 1 (left columns), 2 (middle columns) and a combined analysis (right column). P- and correlation coefficient r-values are from Spearman’s rank tests. Two-sided p-values (pc) from linear mixed effects regression models to correct for effects of histology and multiple tumour regions are additionally shown. Shaded bands represent the 95% confidence interval of a linear regression slope. (g, h) Marker expression profiles of manually gated CD4 (G) and CD8 (H) subsets in validation cohort 2 (concatenated data from n=16 patients are shown). (i) PD1, CD57 and CD45RA expression profile of neoantigen-multimer reactive (Mult+) CD8 T cells from a representative patient (similar results were found amongst four Mult+ populations from n=3 patients). Lower panel shows corresponding profile of CD8 Tdys and TDT subsets amongst all CD8 TILs. (j) PD1, ICOS and Ki67 expression profile of multimer reactive, non-reactive, NTA localized and circulating (PBMC) CD8 T cells.
Figure 3
Figure 3. T cell subsets are clonally related.
CD4 (a) and CD8 (b) subsets were sorted for TCRseq; left panels show sort gates, right panels show Venn diagrams of CDR3 β-sequence sharing between subsets from a representative patient (values represent unique CDR3 sequences). Heatmaps show pairwise similarity (measured by sharing of triplet amino acids) amongst shared and unshared CD4 (c) and CD8 (d) CDR3 β-sequences from patient CRUK0939. Unique CDR3 sequences are arranged across rows and columns, points of intersection are colored according to the similarity between CDR3 pairs. The right hand panels show the mean CDR3 similarity within shared and unshared sequences for CD4 and CD8 CDR3 sequences respectively (n=3 patients each). Network diagrams show shared and unshared CDR3 sequences (points) that have similarity of >0.8 to at least one other CDR3 sequence amongst CD4 (e) and CD8 (f) compartments.
Figure 4
Figure 4. Single cell transcriptomic characterization of CD4 and CD8 subsets reveals distinct regulatory mechanisms.
(a) CD4 and CD8 subsets were identified by a biaxial gating strategy applied to single cell RNAseq data (n=14 patients), based on markers identified by flow cytometry. The gating scheme for CD4 Tdys and TDT cells is shown (CD3E + CD3G + CD4 + CD8 - cells were pre-gated, see Figure S3A). Expression values are represented as normalized, log10 transformed read counts per million (log10 CPM). (b, c) GSEA to evaluate enrichment of published gene sets of T cell dysfunction (b) and sorted CD8 Tdys and multimer reactive cells (c), amongst genes ranked by their expression in CD4 Tdys vs. Early (n=272 vs. 175 cells) and CD8 Tdys vs Naive-like populations (n=143 vs. 19 cells). For each gene set tested, the top 200 most differentially expressed genes were selected. Normalized enrichment scores (NES) and FDR adjusted p-values from permutation tests are shown. (d) Heatmaps showing relative expression (z-score) of genes involved in key T cell regulatory pathways. All genes shown are >2-fold differentially expressed in a comparison between two subsets within with same population (FDR adjusted p<0.05). (e) Venn diagram shows sharing of Gene Ontology (GO) terms enriched in single cell analysis of CD8 Tdys vs. Naïve-like (n=143 vs. 19 cells), CD4 Tdys vs. Early (n=272 vs. 175 cells), CD4 TDT vs. Early (n=143 vs. 175 cells) and Mult+ vs. Mult- (n=36 vs. 39 cells). Pathways with FDR adjusted two-sided Wilcoxon rank sum test p-value <0.05 were considered significant. Pathways shared by all populations were grouped according to the legend and exemplary pathways from each group are tabulated. (f, g) Comparison of transcriptional profiles of individual cells in subsets of interest with effector, reversibly dysfunctional and irreversibly dysfunctional antigen-specific CD8 T cells. Similarity between individual cells in each population (cell numbers as described above) and previously published bulk RNAseq data was calculated by Pearson correlation. Violin plots show the difference between reversible vs. irreversible scores (f) and effector vs. irreversible scores (g) for each population calculated at the single cell level.
Figure 5
Figure 5. A gene signature of progenitor T cell loss correlates with flow cytometry measured differentiation skewing and predicts lung cancer survival.
(a) Workflow of gene signature validation. Using regions with both high dimensional flow cytometry and RNAseq data (n=46 regions from 22 patients), CD4 and CD8 subsets were gated within the flow cytometry data and expression signatures measured within RNAseq data to identify gene signatures that predict subset abundances. (b) Correlation between gene signatures of TCF7/LEF1 loss (TL-DS), CD4 early differentiation/exhaustion and the ratio between Early:dysfunctional subset abundance (calculated as the sum of Tdys and TDT). Spearman rank correlation r- and two-sided FDR adjusted p-values are shown. (c) Relationship between the TL-DS signature and CD4 (upper row) and CD8 subset abundances. Spearman rank correlation r- and two-sided p-values are shown. Shaded bands represents the 95% confidence interval of a linear regression slope. (d) The TL-DS signature correlates with TMB in TRACERx RNAseq (n=161 regions from 64 patients) and TCGA NSCLC cohorts (LUAD, n=511, LUSC, n=482). Progenitor loss signature values were z-score scaled, TMB values were log10 transformed. Spearman rank correlation r- and two-sided p-values are shown for TCGA analyses. An FDR adjusted, two-sided p-value (pc) is shown for the TRACERx cohort from a mixed effects regression model accounting for tumour multiregionality and histology. Shaded bands represents the 95% confidence interval of a linear regression slope. (e) Forest plot shows relationship between TL-DS expression and patient outcome in TRACERx RNAseq (DFS; n=64) and TCGA cohorts (OS; n=486 LUAD, n=455 LUSC). P-values are from univariable Cox regression analysis. (f) Forest plot shows relationship between TL-DS and patient DFS in the TRACERx RNAseq cohort, adjusting for multiple potential confounders. P-values are from a multivariable Cox regression analysis.

References

    1. Schumacher TN, Schreiber RD. Neoantigens in cancer immunotherapy. Science (80-) 2015;348:69–74. - PubMed
    1. Rizvi NA, et al. Mutational landscape determines sensitivity to PD-1 blockade in non-small cell lung cancer. Science (80.) 2015;348:124–8. - PMC - PubMed
    1. Mcgranahan N, et al. Clonal neoantigens elicit T cell immunoreactivity and sensitivity to immune checkpoint blockade. Science (80-) 2016;351:1463–1469. - PMC - PubMed
    1. Gros A, et al. Prospective identification of neoantigen-specific lymphocytes in the peripheral blood of melanoma patients. Nat Med. 2016;22:433–8. - PMC - PubMed
    1. Van Allen EM, et al. Genomic correlates of response to CTLA-4 blockade in metastatic melanoma. Science (80-) 2015;350:207–211. - PMC - PubMed

Publication types