

Echocardiographic characteristics of patients with SARS-CoV-2 infection
- PMID: 32803387
- PMCID: PMC7428201
- DOI: 10.1007/s00392-020-01727-5
Echocardiographic characteristics of patients with SARS-CoV-2 infection
Abstract
Background: Myocardial involvement induced by SARS-CoV-2 infection might be important for long-term prognosis. The aim of this observational study was to characterize the myocardial effects during SARS-CoV-2 infections by echocardiography.
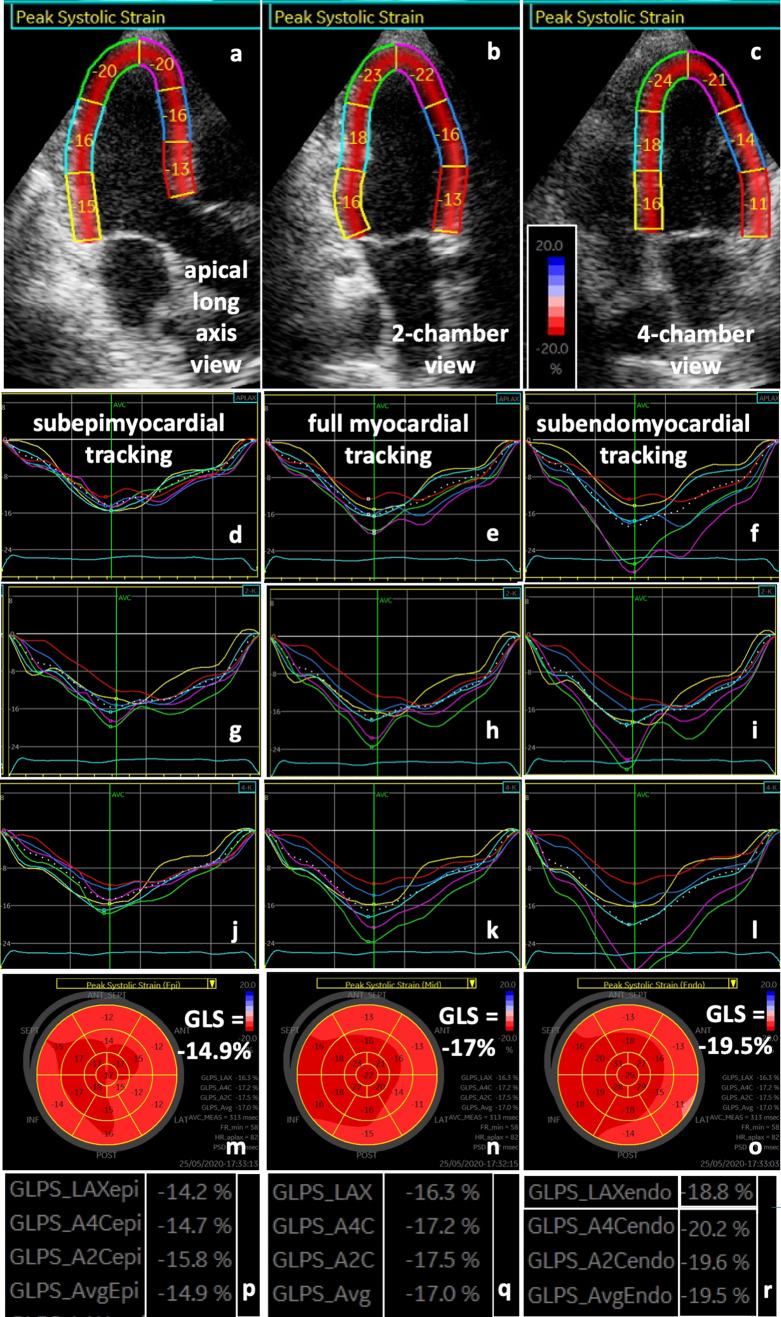
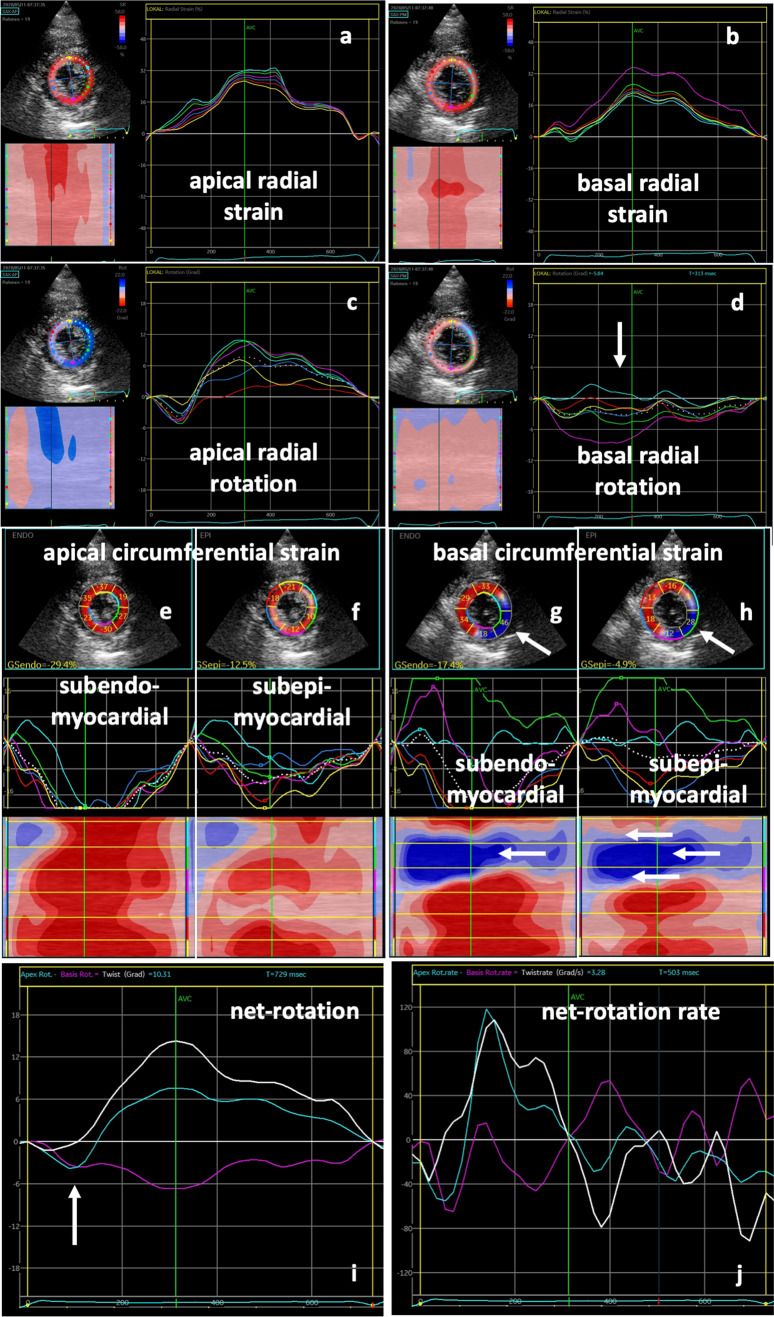
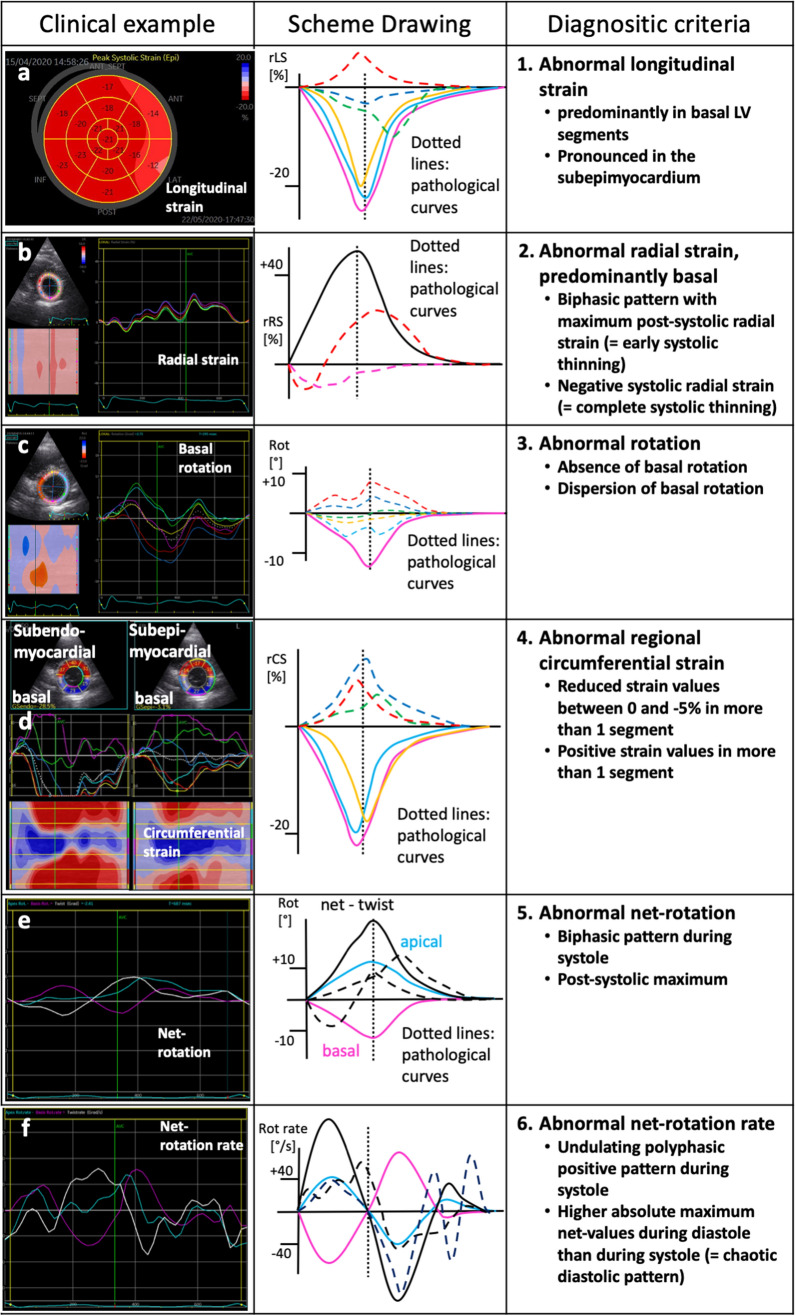
Results and methods: An extended echocardiographic image acquisition protocol was performed in 18 patients with SARS-CoV-2 infection assessing LV longitudinal, radial, and circumferential deformation including rotation, twist, and untwisting. Furthermore, LV deformation was analyzed in an age-matched control group of healthy individuals (n = 20). The most prevalent finding was a reduced longitudinal strain observed predominantly in more than one basal LV segment (n = 10/14 patients, 71%). This pattern reminded of a "reverse tako-tsubo" morphology that is not typical for other viral myocarditis. Additional findings included a biphasic pattern with maximum post-systolic or negative regional radial strain predominantly basal (n = 5/14 patients, 36%); the absence or dispersion of basal LV rotation (n = 6/14 patients, 43%); a reduced or positive regional circumferential strain in more than one segment (n = 7/14 patients, 50%); a net rotation showing late post-systolic twist or biphasic pattern (n = 8/14 patients, 57%); a net rotation showing polyphasic pattern and/or higher maximum net values during diastole (n = 8/14 patients, 57%).
Conclusion: Myocardial involvement due to SARS-CoV-2-infection was highly prevalent in the present cohort-even in patients with mild symptoms. It appears to be characterized by specific speckle tracking deformation abnormalities in the basal LV segments. These data set the stage to prospectively test whether these parameters are helpful for risk stratification and for the long-term follow-up of these patients.
Keywords: COVID-19; Deformation imaging; Myocardial strain; Myocarditis; Rotation; SARS-CoV-2.
Conflict of interest statement
The authors declare that they have no conflict of interest.
Figures


Similar articles
-
The usefulness of speckle tracking echocardiography in identifying subclinical myocardial dysfunction in young adults recovered from mild COVID-19.Echocardiography. 2022 Sep;39(9):1190-1197. doi: 10.1111/echo.15431. Epub 2022 Jul 29. Echocardiography. 2022. PMID: 35906710 Free PMC article.
-
Dissecting myocardial mechanics in patients with severe aortic stenosis: 2-dimensional vs 3-dimensional-speckle tracking echocardiography.BMC Cardiovasc Disord. 2020 Jan 30;20(1):33. doi: 10.1186/s12872-020-01336-0. BMC Cardiovasc Disord. 2020. PMID: 32000672 Free PMC article.
-
Myocardial oedema in acute myocarditis detected by echocardiographic 2D myocardial deformation analysis.Eur Heart J Cardiovasc Imaging. 2016 Sep;17(9):1018-26. doi: 10.1093/ehjci/jev302. Epub 2015 Nov 20. Eur Heart J Cardiovasc Imaging. 2016. PMID: 26588987
-
Quantifying and reporting cardiac findings in imaging of COVID-19 patients.Monaldi Arch Chest Dis. 2020 Nov 9;90(4). doi: 10.4081/monaldi.2020.1394. Monaldi Arch Chest Dis. 2020. PMID: 33169595 Review.
-
Echocardiographic Manifestations in COVID-19: A Review.Heart Lung Circ. 2021 Aug;30(8):1117-1129. doi: 10.1016/j.hlc.2021.02.004. Epub 2021 Feb 19. Heart Lung Circ. 2021. PMID: 33715970 Free PMC article. Review.
Cited by
-
Echocardiography and Lung Ultrasound in Long COVID and Post-COVID Syndrome, a Review Document of the Austrian Society of Pneumology and the Austrian Society of Ultrasound in Medicine.J Ultrasound Med. 2023 Feb;42(2):269-277. doi: 10.1002/jum.16068. Epub 2022 Jul 30. J Ultrasound Med. 2023. PMID: 35906952 Free PMC article. Review.
-
Assessment of myocardial function and cardiac performance using left ventricular global longitudinal strain in athletes after COVID-19: a follow-up study.Front Cardiovasc Med. 2023 Oct 9;10:1240278. doi: 10.3389/fcvm.2023.1240278. eCollection 2023. Front Cardiovasc Med. 2023. PMID: 37876776 Free PMC article.
-
Strain Echocardiography in Acute COVID-19 and Post-COVID Syndrome: More than Just a Snapshot.Biomedicines. 2023 Apr 21;11(4):1236. doi: 10.3390/biomedicines11041236. Biomedicines. 2023. PMID: 37189854 Free PMC article. Review.
-
Prominent Longitudinal Strain Reduction of Basal Left Ventricular Segments in Patients With Coronavirus Disease-19.J Card Fail. 2021 Jan;27(1):100-104. doi: 10.1016/j.cardfail.2020.09.469. Epub 2020 Sep 28. J Card Fail. 2021. PMID: 32991982 Free PMC article.
-
Right ventricular dysfunction and pulmonary hypertension in COVID-19: a meta-analysis of prevalence and its association with clinical outcome.Arch Med Sci. 2021 May 5;18(5):1169-1180. doi: 10.5114/aoms/136342. eCollection 2022. Arch Med Sci. 2021. PMID: 36160328 Free PMC article. Review.
References
Publication types
MeSH terms
LinkOut - more resources
Full Text Sources
Medical
Miscellaneous
