Multicenter Study
. 2020;30(4):225-234.
doi: 10.3233/VES-200708.

VOR gain calculation methods in video head impulse recordings

Affiliations
Multicenter Study

VOR gain calculation methods in video head impulse recordings

Ewa Zamaro et al. J Vestib Res. 2020.

Abstract

Background: International consensus on best practices for calculating and reporting vestibular function is lacking. Quantitative vestibulo-ocular reflex (VOR) gain using a video head impulse test (HIT) device can be calculated by various methods.

Objective: To compare different gain calculation methods and to analyze interactions between artifacts and calculation methods.

Methods: We analyzed 1300 horizontal HIT traces from 26 patients with acute vestibular syndrome and calculated the ratio between eye and head velocity at specific time points (40 ms, 60 ms) after HIT onset ('velocity gain'), ratio of velocity slopes ('regression gain'), and ratio of area under the curves after de-saccading ('position gain').

Results: There was no mean difference between gain at 60 ms and position gain, both showing a significant correlation (r2 = 0.77, p < 0.001) for artifact-free recordings. All artifacts reduced high, normal-range gains modestly (range -0.06 to -0.11). The impact on abnormal, low gains was variable (depending on the artifact type) compared to artifact-free recordings.

Conclusions: There is no clear superiority of a single gain calculation method for video HIT testing. Artifacts cause small but significant reductions of measured VOR gains in HITs with higher, normal-range gains, regardless of calculation method. Artifacts in abnormal HITs with low gain increased measurement noise. A larger number of HITs should be performed to confirm abnormal results, regardless of calculation method.

Keywords: HIT device; VOR; area under the curve; artifacts; calculation methods; gain; position gain; regression; regression gain; vHIT; video head impulse test; video-oculography.


Conflict of interest statement

None

Figures

Fig.1
Fig.1
Figure 1 depicts one clean (Fig. 1A–C, no artifacts) and unclean (Fig. 1D–E, trace with artifacts) vHIT example (eye- and head velocity profile) from one patient with PICA stroke. The unclean vHIT shows trace oscillation artifacts due to intermittent pupil tracking loss. VOR gain has been calculated by (A and D) taking different time points at 40 ms and at 60 ms after HIT onset (‘velocity gain’), (B and E) applying a linear regression (‘regression gain’), or (C and F) comparing the area under the curve for eye (black) and head (grey) velocity (‘position gain’). Note that VOR gain from the same patient and the same vHIT trace resulted in different VOR gains for each calculation method ranging from 0.73–1.1 (traces with no artifact) and from 0.39–1.13 if artifacts changed the morphology of the bell-shaped slow phase curve.
Fig.2
Fig.2
VOR gain of HITs with higher gain and lower (abnormal) gain for clean recordings for all four methods. Different letters represent significant differences among the methods inside the normal or abnormal HITs (For variables with the same letter, the difference between these variables is not statistically significant. Likewise, for variables with a different letter, the difference is statistically significant). Means and confidence intervals are model based, due to the nested data.
Fig.3
Fig.3
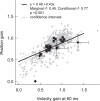
Correlation between position gain and velocity gain at 60 ms. Grey dots represent the individual HITs, and black dots are mean (±standard error) values per patient. The regression line is derived from the mixed effects model (+/–95% confidence intervals), and takes into account the nested structure of HITs within ears within patients. Note that the regression line shows an offset with an intercept of 0.46. Imperfect calculation algorithms including imperfect de-saccading, removal of negative gain values by the device or data lowpass filtering might lead to a skewed regression line.
Fig.4
Fig.4
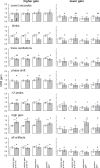
VOR gain for clean (white bars) and artifactual (grey bars) higher gain and lower gainHITs for different artifacts and the four methods. Different letters represent significant differences among the methods for gains with artifacts (see legend Fig. 2). Stars denote significant differences between HITs with and without artifacts within a method: *p < 0.05, **p < 0.01, ***p < 0.001. Means and confidence intervals are model-based due to the nested data.

Similar articles

Cited by

References

    1. Agrawal Y., Schubert M.C., Migliaccio A.A., Zee D.S., Schneider E., Lehnen N., Carey J.P., Evaluation of quantitative head impulse testing using search coils versus video-oculography in older individuals, Otol Neurotol 35 (2014), 283–288. - PMC - PubMed
    1. Aw S.T., Halmagyi G.M., Haslwanter T., Curthoys I.S., Yavor R.A., Todd M.J., Three-dimensional vector analysis of the human vestibuloocular reflex in response to high-acceleration head rotations. II. responses in subjects with unilateral vestibular loss and selective semicircular canal occlusion, J Neurophysiol 76 (1996), 4021–4030. - PubMed
    1. Aw S.T., Haslwanter T., Halmagyi G.M., Curthoys I.S., Yavor R.A., Todd M.J., Three-dimensional vector analysis of the human vestibuloocular reflex in response to high-acceleration head rotations. I. Responses in normal subjects, J Neurophysiol 76 (1996), 4009–4020. - PubMed
    1. Carey J.P., Minor L.B., Peng G.C., la C.C., Santina, P.D. Cremer and T. Haslwanter, Changes in the three-dimensional angular vestibulo-ocular reflex following intratympanic gentamicin for Meniere’s disease, J Assoc Res Otolaryngol 3 (2002), 430–443. - PMC - PubMed
    1. Cleworth T.W., Carpenter M.G., Honegger F., Allum J.H.J., Differences in head impulse test results due to analysis techniques, J Vestib Res 27 (2017), 163–172. - PubMed

Publication types

LinkOut - more resources