. 2020;77(1):149-163.
doi: 10.3233/JAD-200286.

Mitochondrial DNA Manipulations Affect Tau Oligomerization

Affiliations

Mitochondrial DNA Manipulations Affect Tau Oligomerization

Ian W Weidling et al. J Alzheimers Dis. 2020.

Abstract

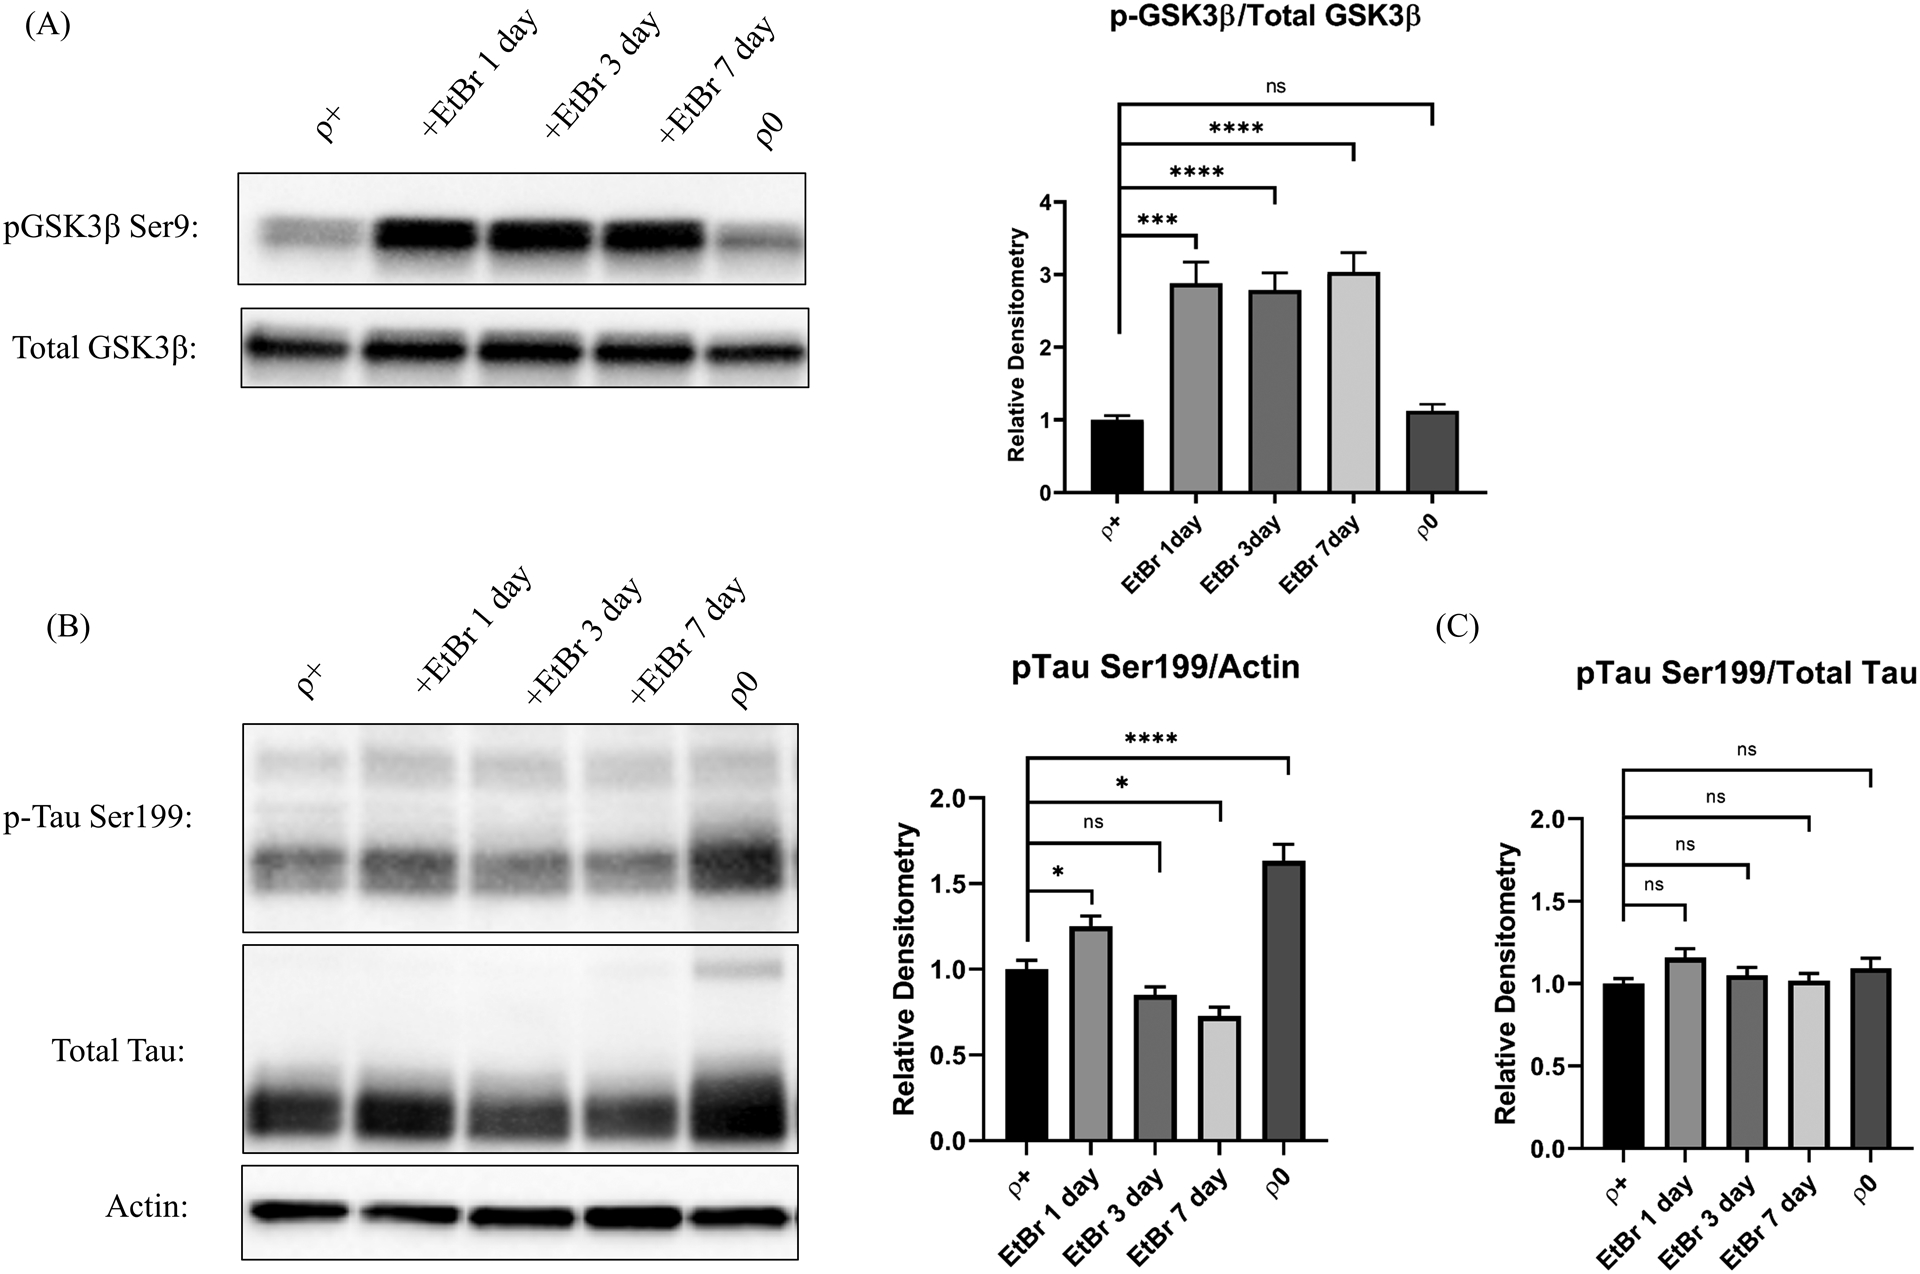
Background: Mitochondrial dysfunction and tau aggregation occur in Alzheimer's disease (AD), and exposing cells or rodents to mitochondrial toxins alters their tau.

Objective: To further explore how mitochondria influence tau, we measured tau oligomer levels in human neuronal SH-SY5Y cells with different mitochondrial DNA (mtDNA) manipulations.

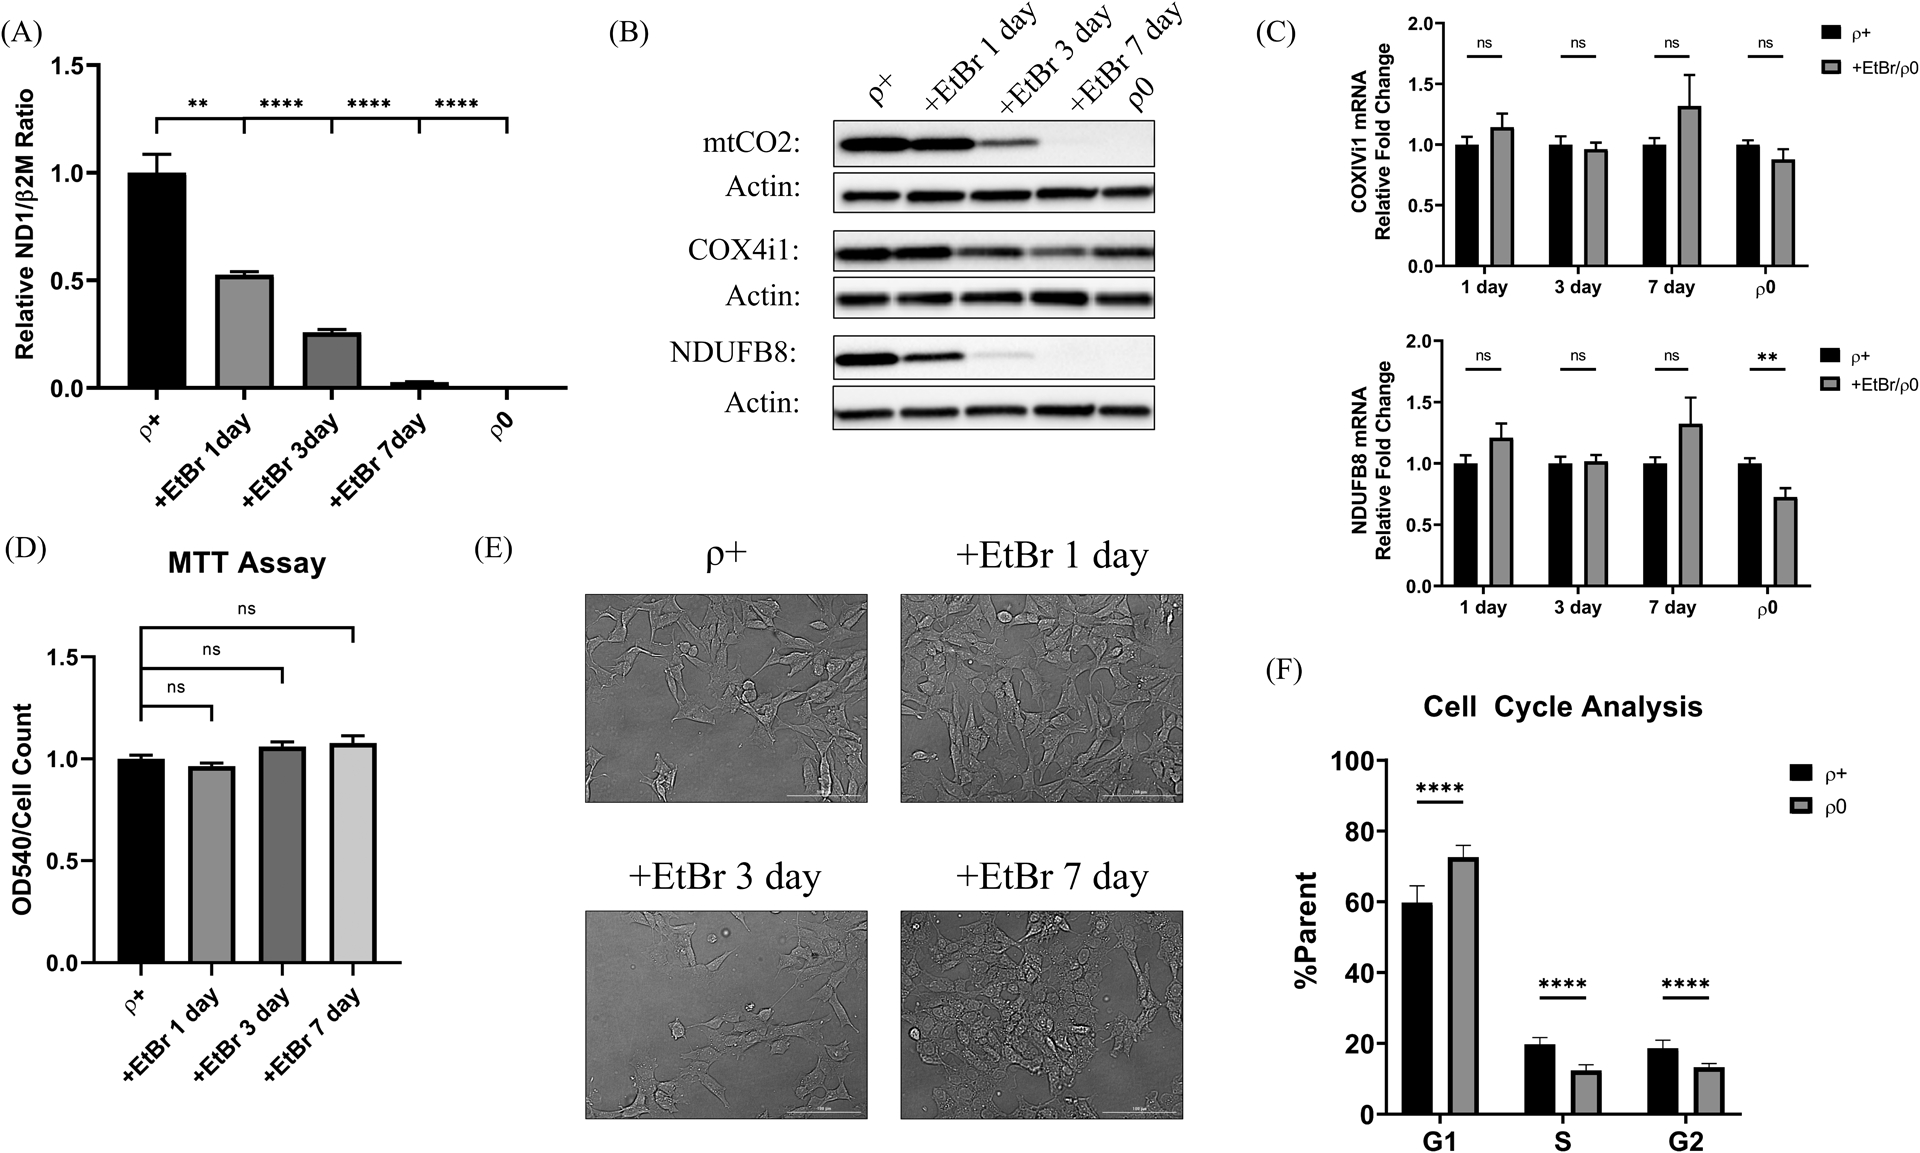
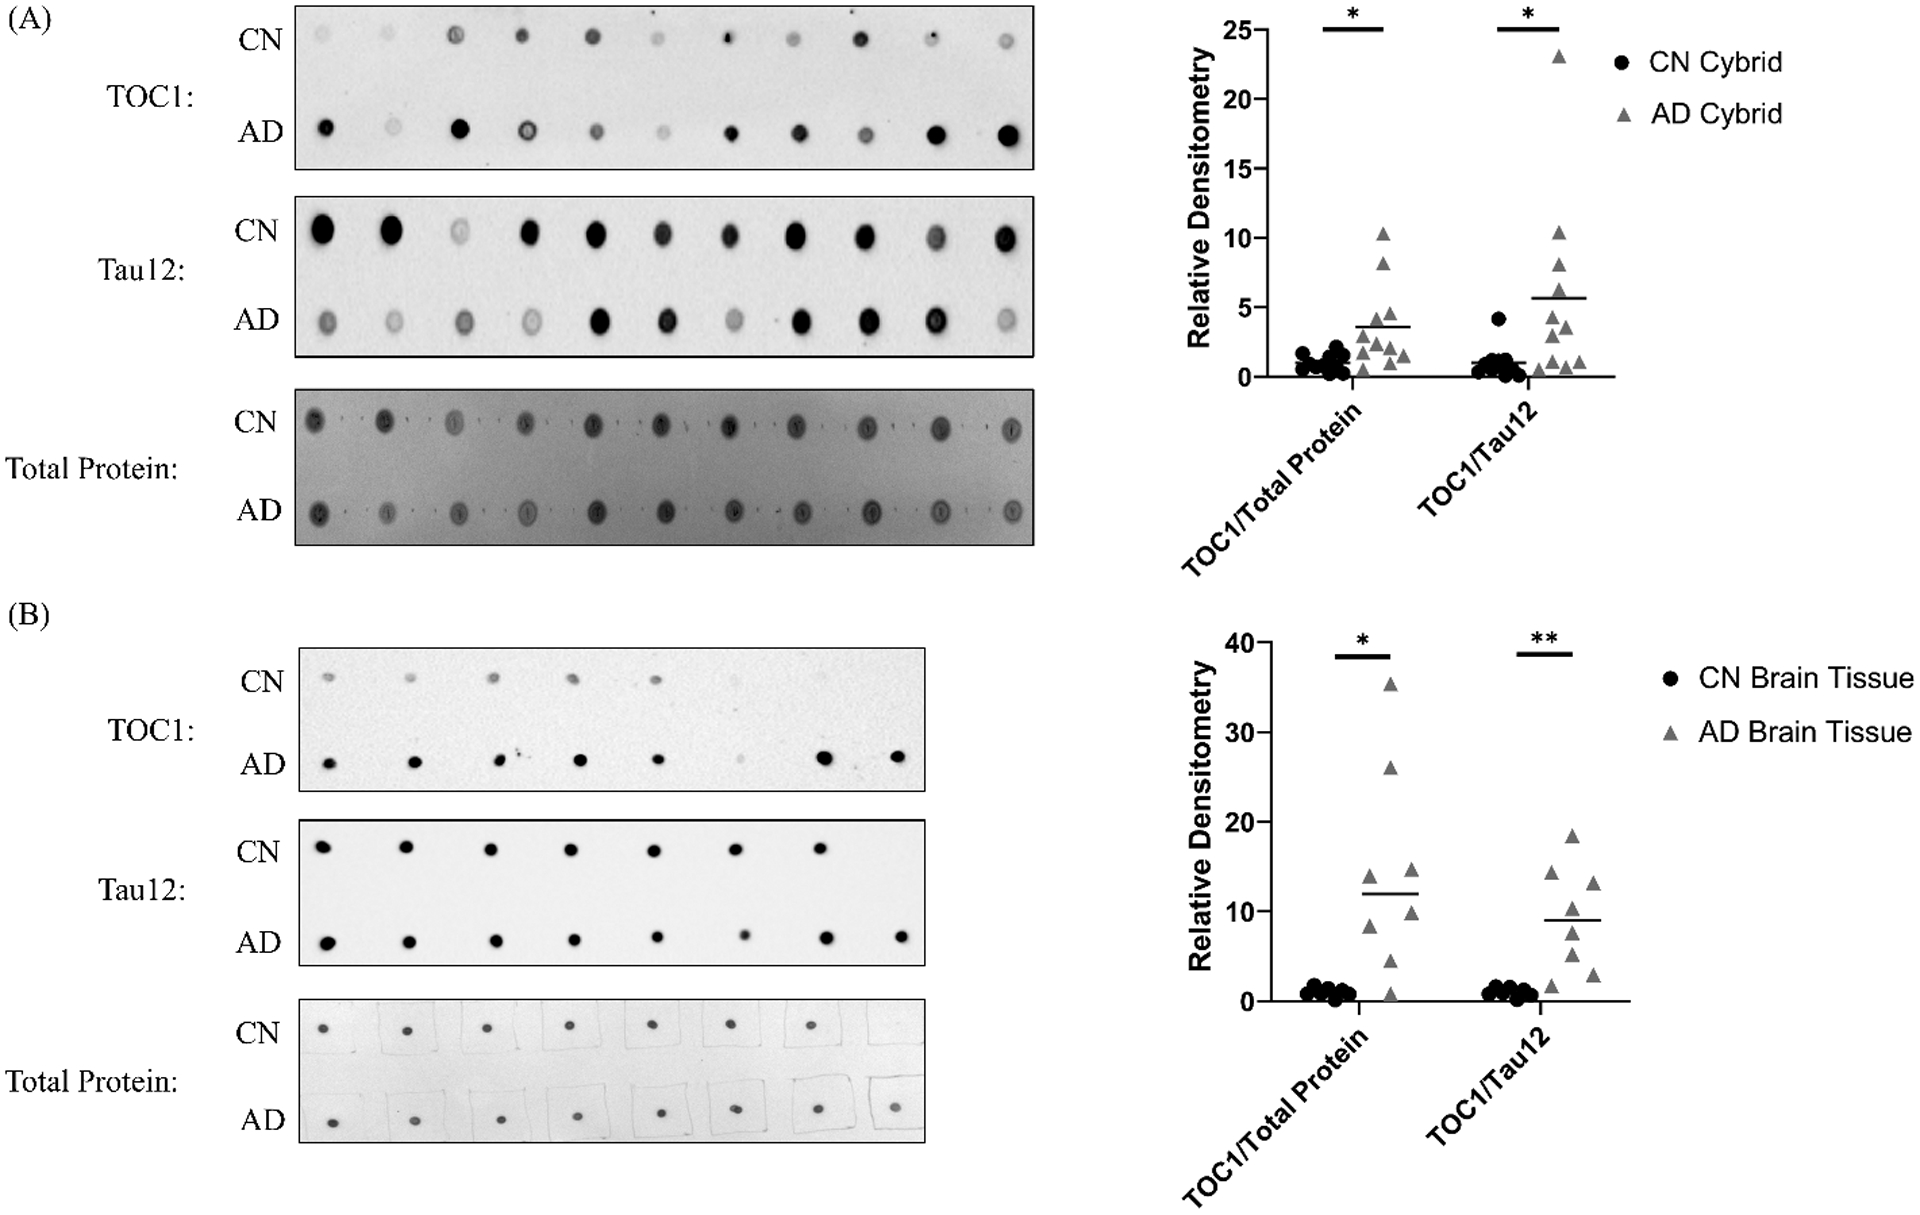
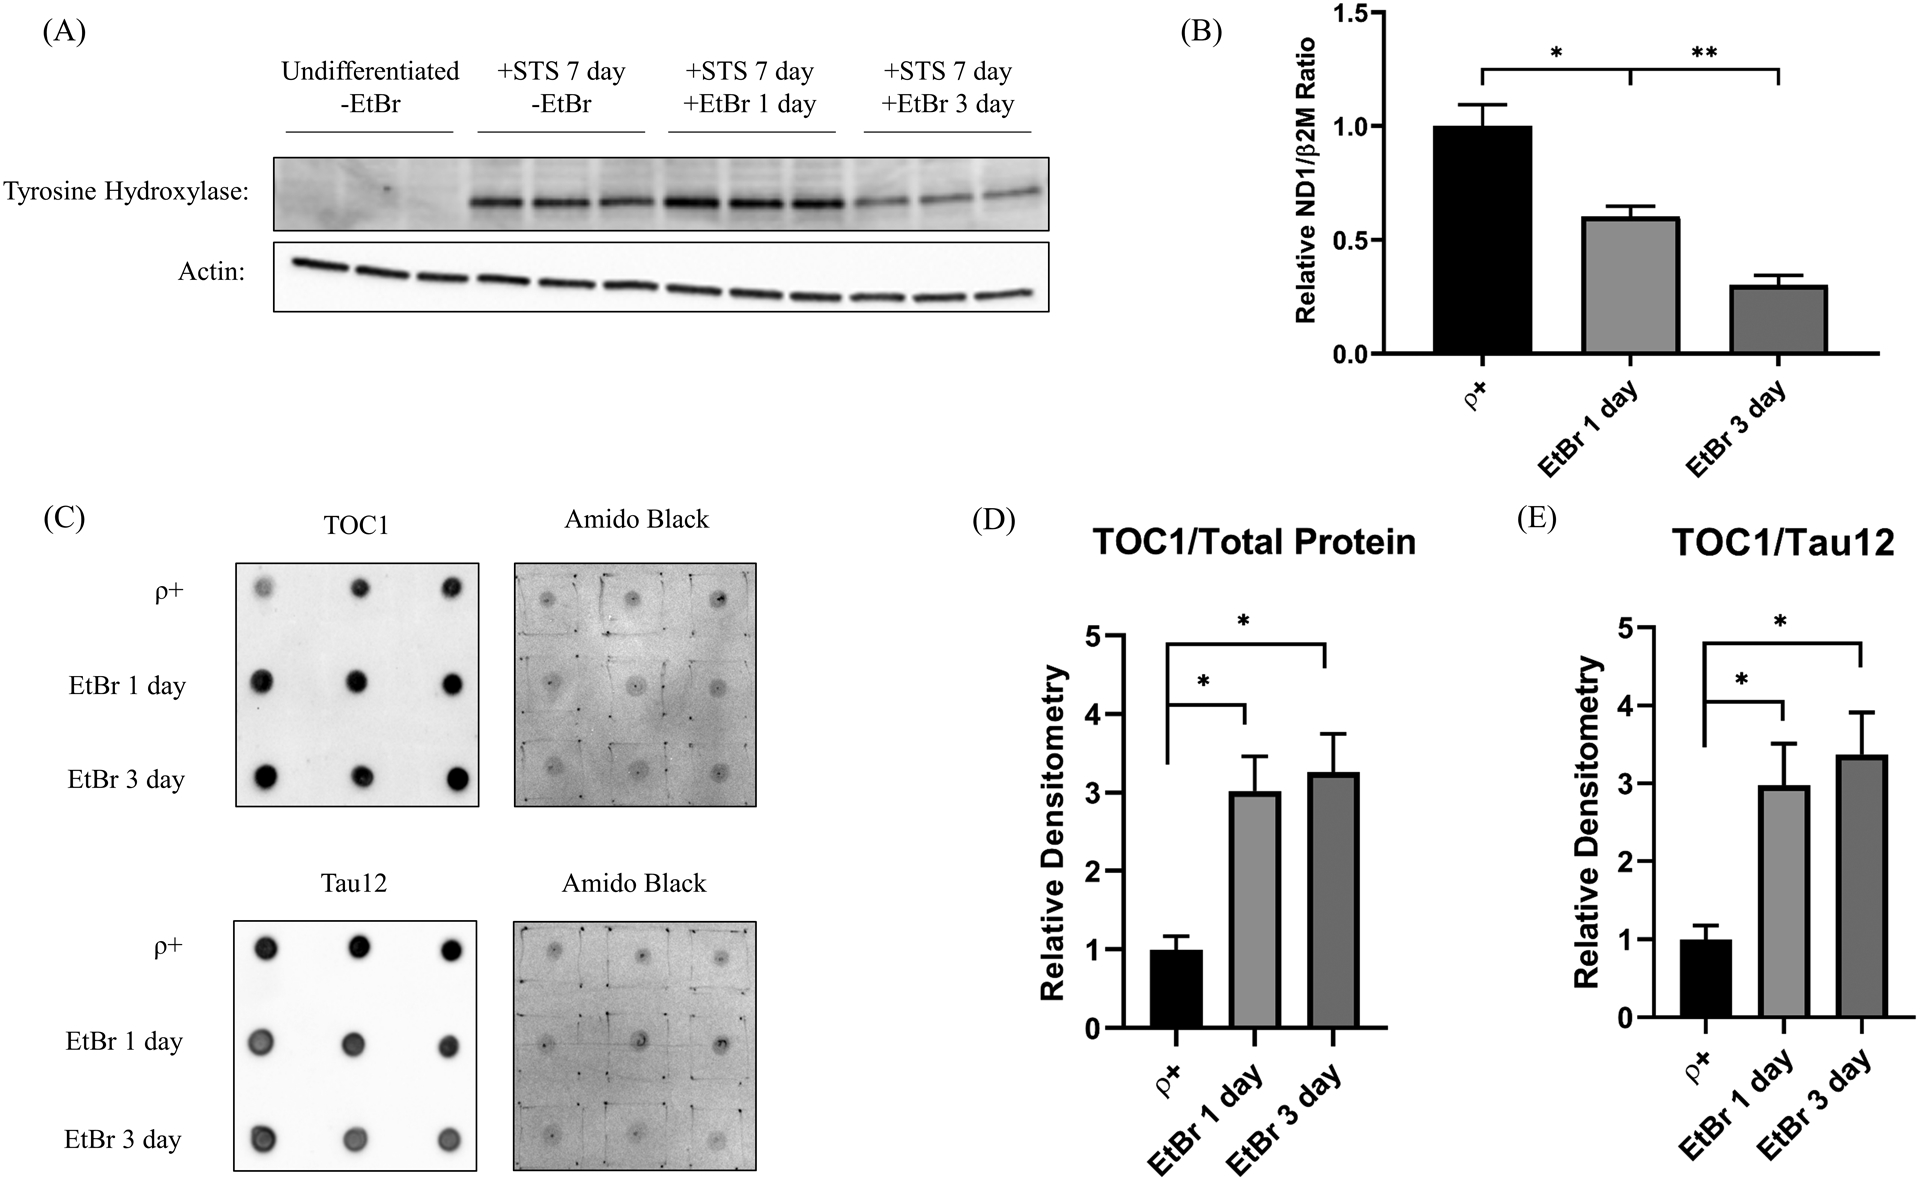
Methods: Specifically, we analyzed cells undergoing ethidium bromide-induced acute mtDNA depletion, ρ0 cells with chronic mtDNA depletion, and cytoplasmic hybrid (cybrid) cell lines containing mtDNA from AD subjects.

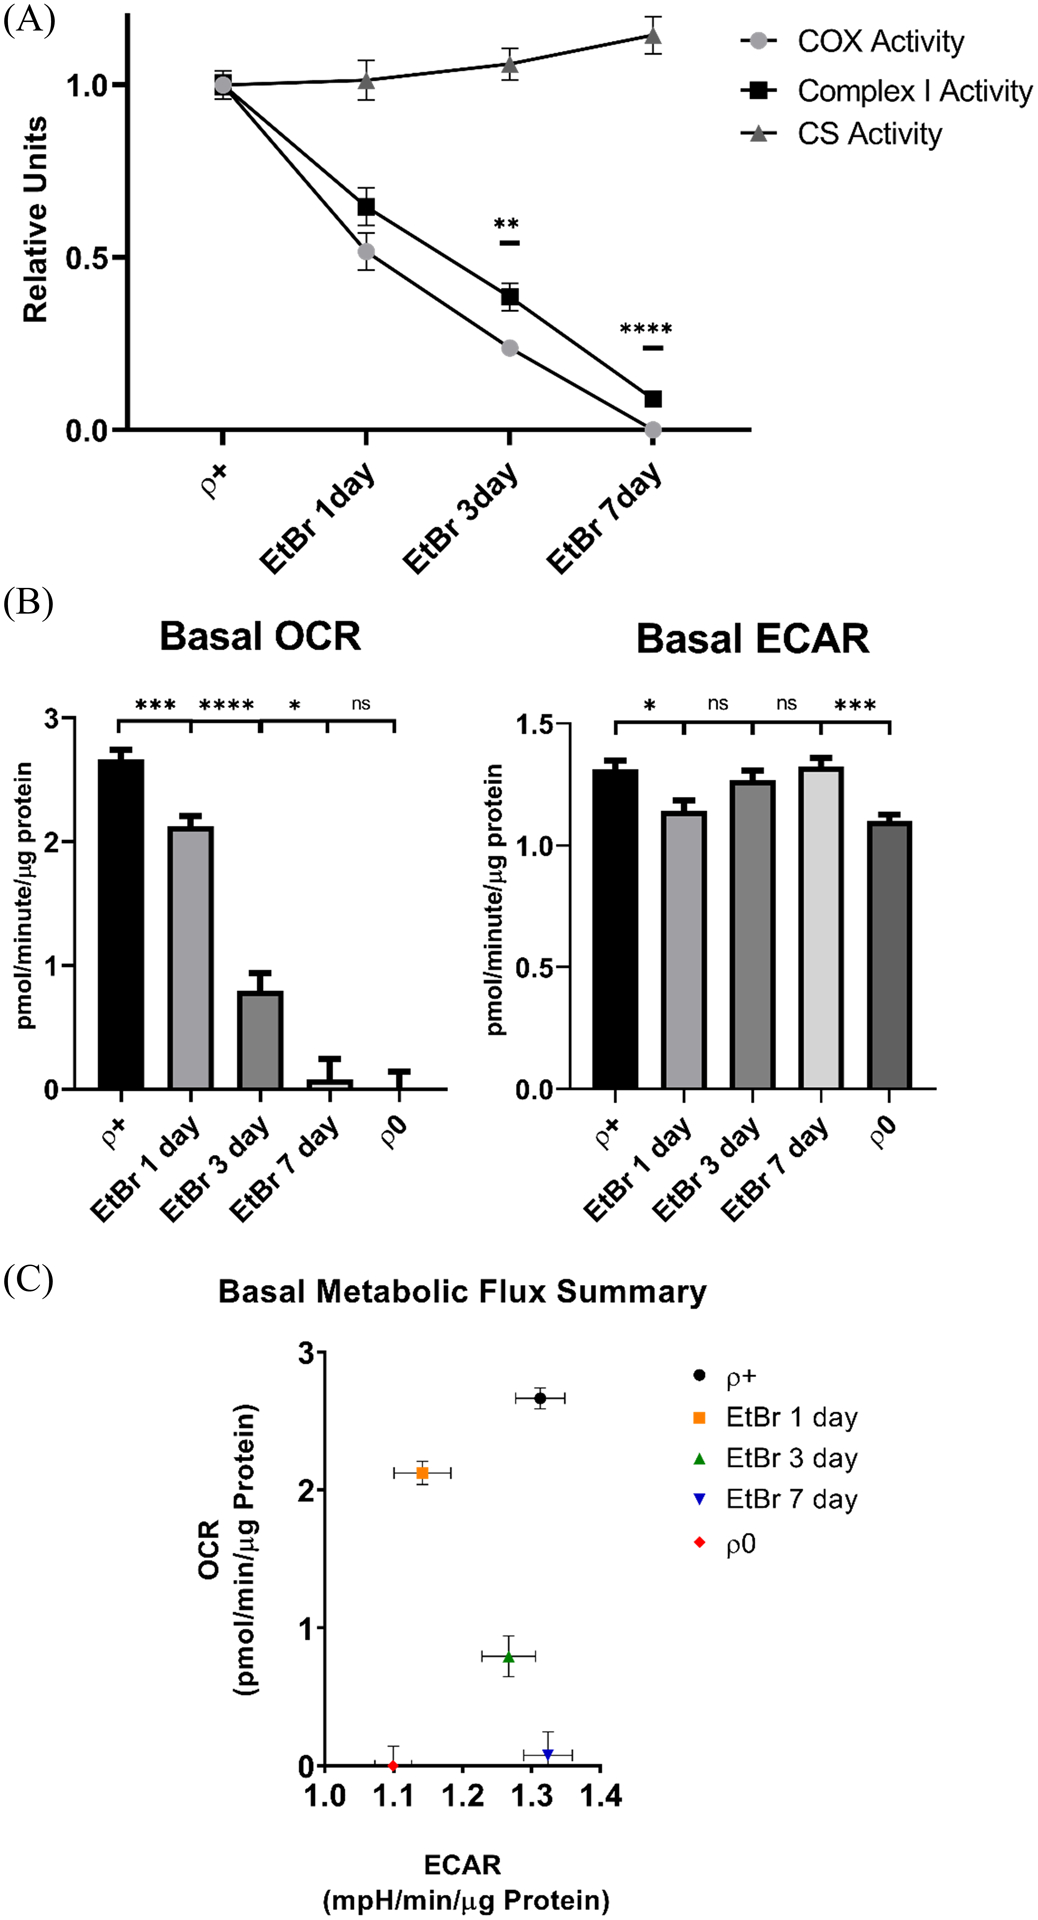
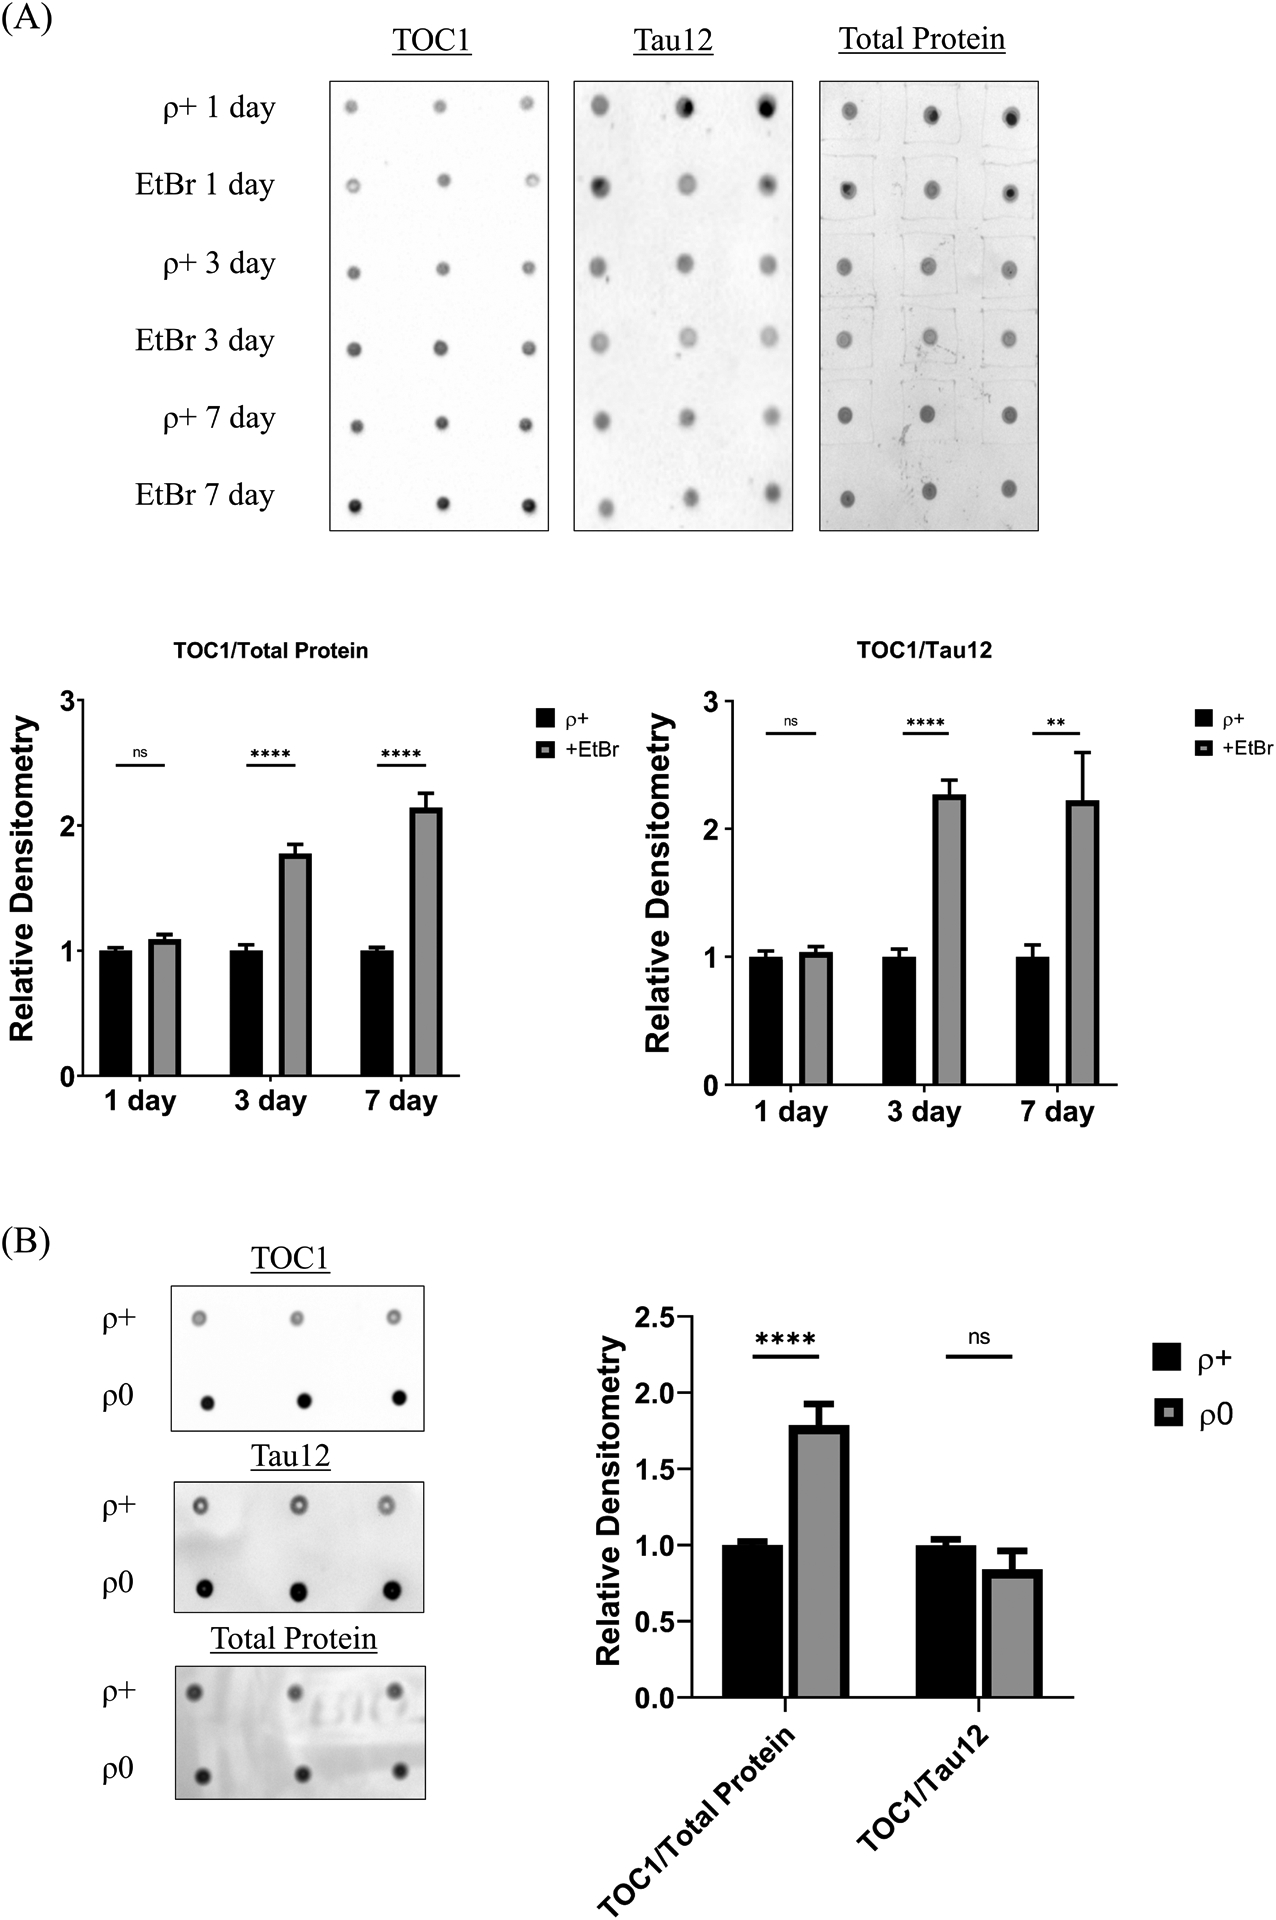
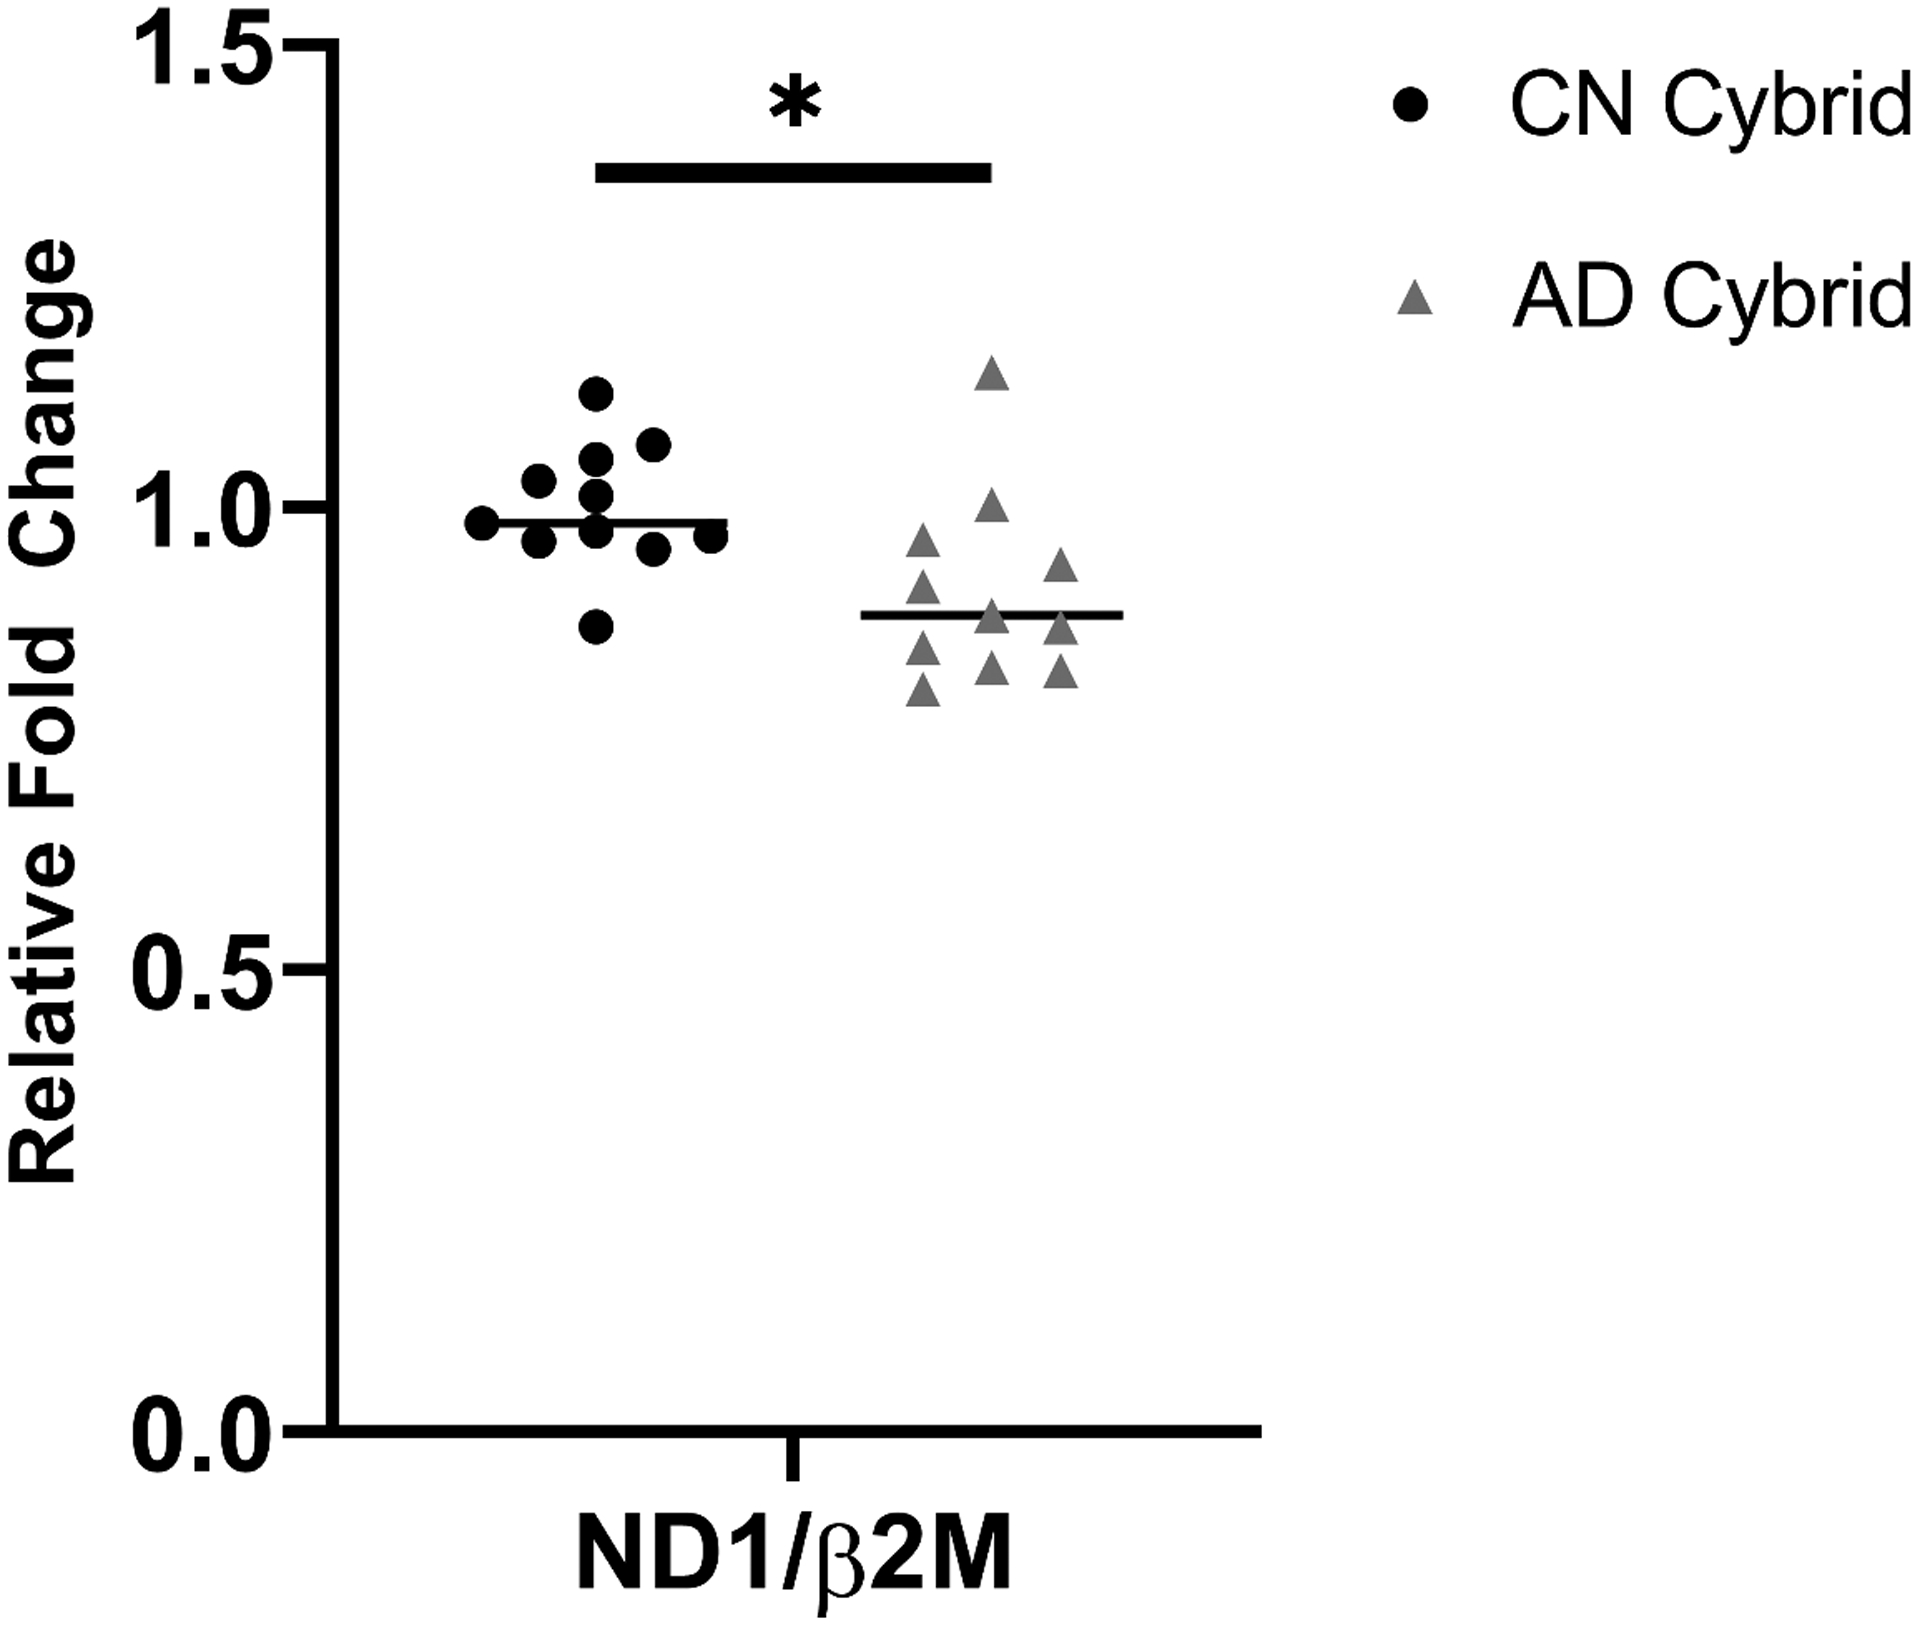
Results: We found cytochrome oxidase activity was particularly sensitive to acute mtDNA depletion, evidence of metabolic re-programming in the ρ0 cells, and a relatively reduced mtDNA content in cybrids generated through AD subject mitochondrial transfer. In each case tau oligomer levels increased, and acutely depleted and AD cybrid cells also showed a monomer to oligomer shift.

Conclusion: We conclude a cell's mtDNA affects tau oligomerization. Overlapping tau changes across three mtDNA-manipulated models establishes the reproducibility of the phenomenon, and its presence in AD cybrids supports its AD-relevance.

Keywords: Alzheimer’s disease; mitochondria; mitochondrial DNA; oligomers; tau.


Conflict of interest statement

Conflict of Interest/Disclosure Statement

The authors have no conflict of interest to report.

Figures

Figure 1.
Figure 1.. Extent of acute and chronic mtDNA depletion and its effects on respiratory chain protein and mRNA levels.
(A) 1, 3, and 7-day EtBr treatment reduced SH-SY5Y mtDNA levels by approximately 50%, 75%, and 95%. ρ0 cells displayed >99.9% relative mtDNA depletion. (B) Representative western blots labeled with antibodies recognizing the mtDNA-encoded mtCO2, nuclear-encoded COX4I1, and nuclear-encoded NDUFB8 proteins. Actin is included as a loading control. (C) COX4I1 and NDUFB8 mRNA levels were unaffected by the acute EtBr treatment, although the NDUFB8 mRNA level was slightly reduced in ρ0 cells. (D) By MTT assay the acutely mtDNA-depleted cells appeared viable throughout. (E) The acutely mtDNA-depleted cells grossly showed at most subtle morphologic changes. (F) The ρ0 cell cycle rate was slightly reduced as compared to the parent SH-SY5Y line. **p<0.01, ***p<0.001, and ****p<0.0001. Error bars represent SEM.
Figure 2.
Figure 2.. Effect of mtDNA depletion on mitochondrial enzyme Vmax activities and energy metabolism fluxes.
(A) A progressive decline in complex I and COX activities accompanied the progressive EtBr-induced mtDNA depletion, although after 3 and 7 days of EtBr COX activity fell to a greater extent than complex I activity. CS activity did not decline during this period. (B) SH-SY5Y oxygen consumption rates also tracked mtDNA depletion, and as was the case with the ρ0 cells the mitochondrial OCR was essentially undetectable by EtBr exposure day 7. The EtBr-treated cell ECAR fell initially but recovered, and the EtBr exposure day 7 ECAR exceeded the ρ0 cell ECAR. n=16 per group. (C) Metabolic flux rates for the different groups; the EtBr day 7 cells and ρ0 cells both showed no or essentially no mitochondrial oxygen consumption, but the ρ0 cells uniquely lowered their glycolysis flux. *p<0.05, **p<0.01, ***p<0.001, and ****p<0.0001. Error bars represent SEM.
Figure 3.
Figure 3.. Acute and chronic mtDNA depletion alters TOC1 staining.
(A) Representative dot blots of EtBr-treated SH-SY5Y lysates labeled with the TOC1 antibody, the Tau12 antibody, or Amido Black. Each day’s EtBR-treated samples were compared to control samples simultaneously prepared on that specific day. Densitometry analysis reveals no change in TOC1 staining after the 1-day EtBr treatment but following 3 and 7 days TOC1 staining increases whether normalized to total protein or total tau. (B) Representative dot blots of SH-SY5Y ρ+ and ρ0 lysates labeled with the TOC1 antibody, the Tau12 antibody, or Amido Black. Densitometry analysis reveals a significant increase in TOC1 staining in ρ0 cells relative to ρ+ cells when normalized to total protein, but not to total tau. **p<0.01, and ****p<0.0001. Error bars represent SEM.
Figure 4.
Figure 4.. Tau phosphorylation in acutely and chronically mtDNA-depleted cells.
(A) The GSK3β kinase serine 9 phosphorylation level and the serine 9 phosphorylated to unphosphorylated ratio increased in cells undergoing acute but not chronic mtDNA depletion. (B) Tau serine 199 phosphorylation levels varied during acute mtDNA depletion and increased in ρ0 cells. (C) Serine 199 phosphorylated to total tau ratios remained constant. *p<0.05, ***p<0.001, and ****p<0.0001. Error bars represent SEM.
Figure 5.
Figure 5.. TOC1 staining in AD cybrids and AD brains.
(A) Normalized to total protein or total tau protein AD cybrids show more TOC1 staining than age-matched CN cybrids. The dot blots shown are actual representative data from a single experiment. Each datapoint in the graph represents the mean value from three independent measurements. n=11 per group. (B) Normalized to total protein or total tau protein AD brains show more TOC1 staining than age-matched brains from CN subjects. The dot blots shown are actual representative data from a single experiment. Each datapoint in the graph represents the mean value from three independent measurements. n=8 AD and 7 CN brains. *p<0.05, **p<0.01.
Figure 6.
Figure 6.. Cybrid cell line relative mtDNA content.
AD cybrids maintain less mtDNA than CN cybrids; the AD cybrid mtDNA mean was 9% lower than the CN cybrid mean. Each datapoint in the graph represents the mean value from three independent measurements. n=11 per group. *p<0.05.
Figure 7.
Figure 7.. Acute mtDNA depletion alters TOC1 staining in differentiated SH-SY5Y cells.
(A) Tyrosine hydroxylase protein, a marker of differentiation, increased in staurosporine-treated SH-SY5Y cells. (B) The amount of mtDNA progressively declined in EtBr-treated differentiated cells. (C) Dot blots of differentiated SH-SY5Y cell lysates labeled with the TOC1 antibody, the Tau12 antibody, or Amido Black. Each day’s EtBR-treated samples were compared to control samples simultaneously prepared on that specific day. (D) Densitometry analysis reveals after 1 and 3 days of EtBr, TOC1 staining increases when normalized to total protein. (E) Densitometry analysis reveals after 1 and 3 days of EtBr, TOC1 staining increases when normalized to total tau protein, indicative of a monomer to oligomer shift. n=6 per group. *p<0.05, **p<0.01. Error bars represent SEM.

References

    1. Swerdlow RH (2007) Is aging part of Alzheimer’s disease, or is Alzheimer’s disease part of aging? Neurobiol Aging 28, 1465–1480. - PubMed
    1. Swerdlow RH (2012) Mitochondria and cell bioenergetics: increasingly recognized components and a possible etiologic cause of Alzheimer’s disease. Antioxid Redox Signal 16, 1434–1455. - PMC - PubMed
    1. Manczak M, Reddy PH (2012) Abnormal interaction between the mitochondrial fission protein Drp1 and hyperphosphorylated tau in Alzheimer’s disease neurons: implications for mitochondrial dysfunction and neuronal damage. Hum Mol Genet 21, 2538–2547. - PMC - PubMed
    1. Quintanilla RA, Matthews-Roberson TA, Dolan PJ, Johnson GV (2009) Caspase-cleaved tau expression induces mitochondrial dysfunction in immortalized cortical neurons: implications for the pathogenesis of Alzheimer disease. J Biol Chem 284, 18754–18766. - PMC - PubMed
    1. Atlante A, Amadoro G, Bobba A, de Bari L, Corsetti V, et al. (2008) A peptide containing residues 26–44 of tau protein impairs mitochondrial oxidative phosphorylation acting at the level of the adenine nucleotide translocator. Biochim Biophys Acta 1777, 1289–1300. - PubMed

Publication types

LinkOut - more resources