

Modeling the Dependence Structure in Genome Wide Association Studies of Binary Phenotypes in Family Data
- PMID: 32804302
- PMCID: PMC7581561
- DOI: 10.1007/s10519-020-10010-2
Modeling the Dependence Structure in Genome Wide Association Studies of Binary Phenotypes in Family Data
Abstract
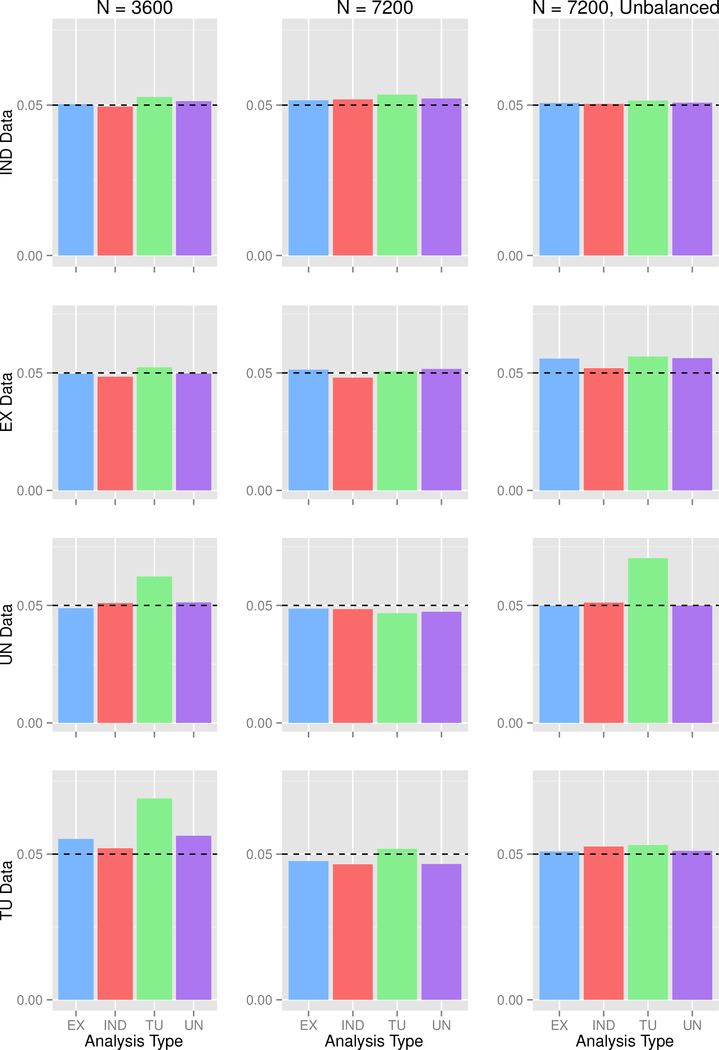
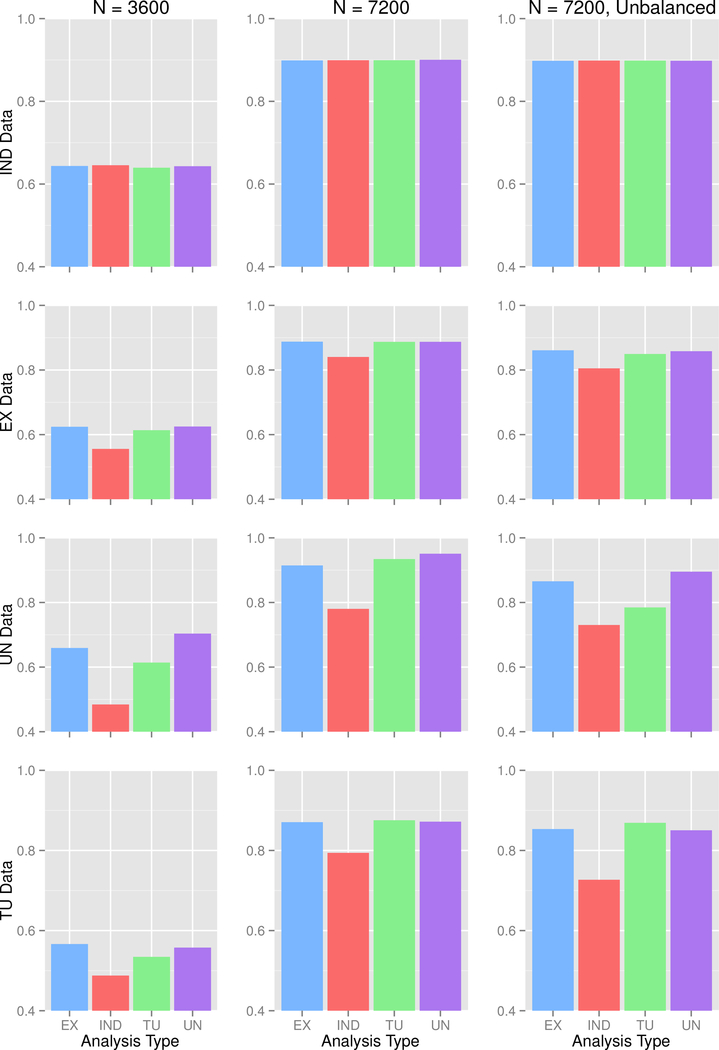
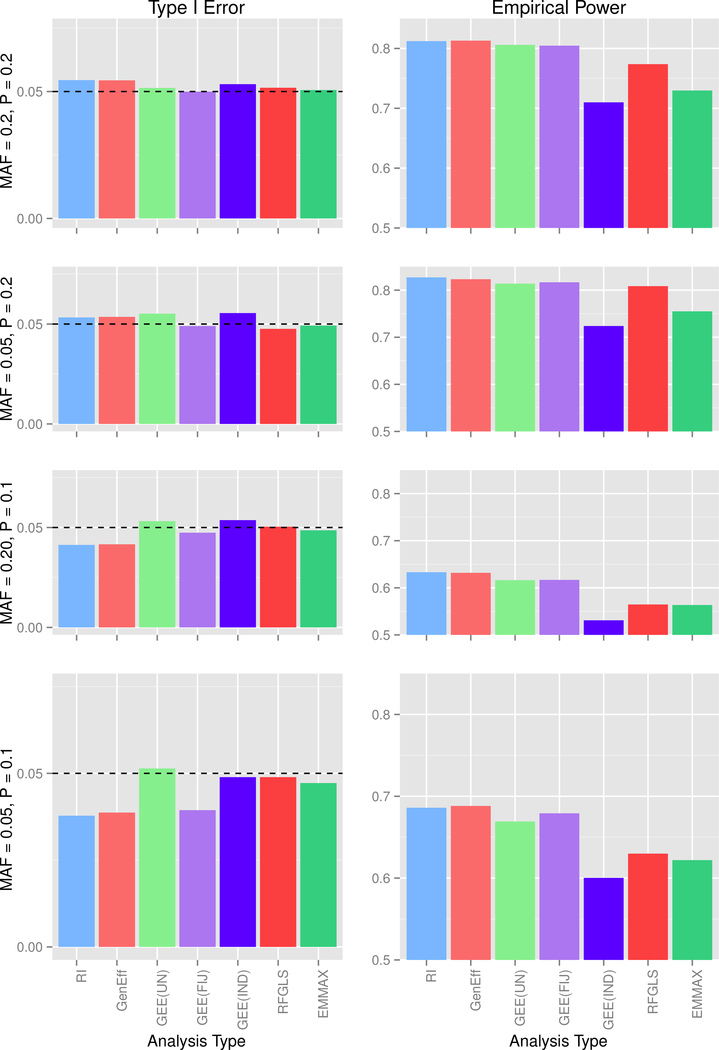
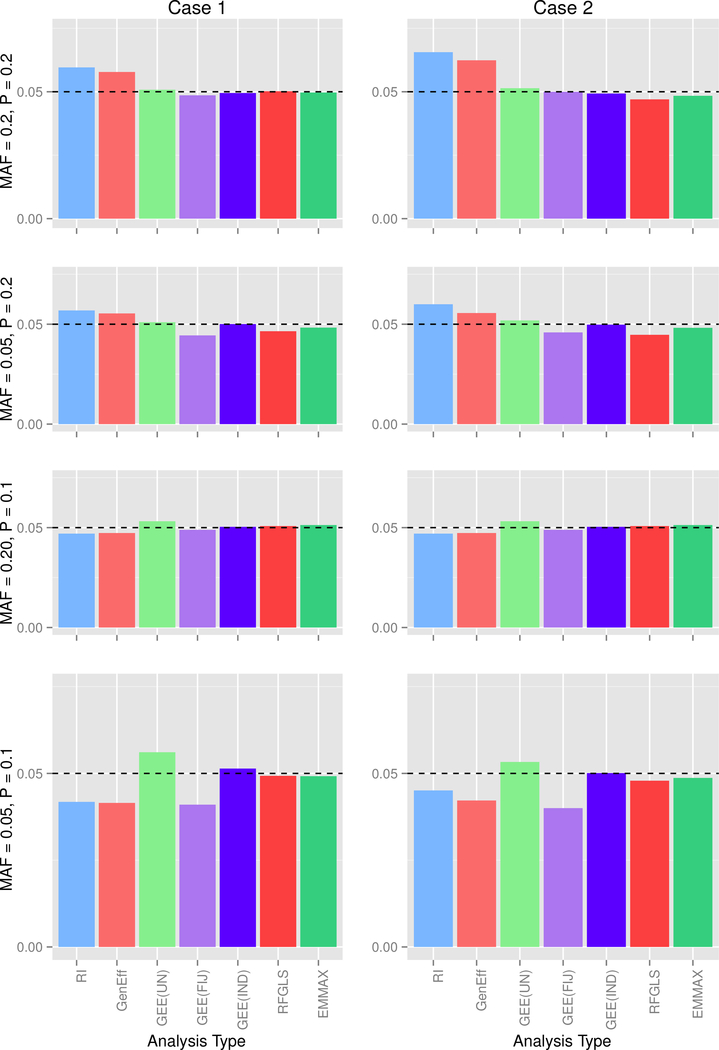
Genome-wide association studies (GWASs) are a popular tool for detecting association between genetic variants or single nucleotide polymorphisms (SNPs) and complex traits. Family data introduce complexity due to the non-independence of the family members. Methods for non-independent data are well established, but when the GWAS contains distinct family types, explicit modeling of between-family-type differences in the dependence structure comes at the cost of significantly increased computational burden. The situation is exacerbated with binary traits. In this paper, we perform several simulation studies to compare multiple candidate methods to perform single SNP association analysis with binary traits. We consider generalized estimating equations (GEE), generalized linear mixed models (GLMMs), or generalized least square (GLS) approaches. We study the influence of different working correlation structures for GEE on the GWAS findings and also the performance of different analysis method(s) to conduct a GWAS with binary trait data in families. We discuss the merits of each approach with attention to their applicability in a GWAS. We also compare the performances of the methods on the alcoholism data from the Minnesota Center for Twin and Family Research (MCTFR) study.
Keywords: Family data; Generalized estimating equation; Generalized least squares; Generalized linear mixed effect model; Genome-wide scan; Population-based association analysis.
Figures
Similar articles
-
Single Marker Family-Based Association Analysis Not Conditional on Parental Information.Methods Mol Biol. 2017;1666:409-439. doi: 10.1007/978-1-4939-7274-6_20. Methods Mol Biol. 2017. PMID: 28980257 Review.
-
Adaptive SNP-Set Association Testing in Generalized Linear Mixed Models with Application to Family Studies.Behav Genet. 2018 Jan;48(1):55-66. doi: 10.1007/s10519-017-9883-x. Epub 2017 Nov 17. Behav Genet. 2018. PMID: 29150721 Free PMC article.
-
A rapid gene-based genome-wide association test with multivariate traits.Hum Hered. 2013;76(2):53-63. doi: 10.1159/000356016. Epub 2013 Nov 13. Hum Hered. 2013. PMID: 24247328 Free PMC article.
-
A rapid generalized least squares model for a genome-wide quantitative trait association analysis in families.Hum Hered. 2011;71(1):67-82. doi: 10.1159/000324839. Epub 2011 Apr 8. Hum Hered. 2011. PMID: 21474944 Free PMC article.
-
Leveraging GWAS for complex traits to detect signatures of natural selection in humans.Curr Opin Genet Dev. 2018 Dec;53:9-14. doi: 10.1016/j.gde.2018.05.012. Epub 2018 Jun 16. Curr Opin Genet Dev. 2018. PMID: 29913353 Review.
Cited by
-
Efficient estimation of SNP heritability using Gaussian predictive process in large scale cohort studies.PLoS Genet. 2022 Apr 20;18(4):e1010151. doi: 10.1371/journal.pgen.1010151. eCollection 2022 Apr. PLoS Genet. 2022. PMID: 35442943 Free PMC article.
References
-
- Agresti A and Kateri M (2011). Categorical data analysis. Springer.
-
- Allen NE, Sudlow C, Peakman T, Collins R, et al. (2014). Uk biobank data: come and get it. - PubMed
-
- Bates DM (2010). lme4: Mixed-effects modeling with r.
-
- Benyamin B, Visscher PM, and McRae AF (2009). Family-based genome-wide association studies. - PubMed
Publication types
MeSH terms
Grants and funding
LinkOut - more resources
Full Text Sources
Miscellaneous
