

A Bayesian phylogenetic hidden Markov model for B cell receptor sequence analysis
- PMID: 32804924
- PMCID: PMC7451993
- DOI: 10.1371/journal.pcbi.1008030
A Bayesian phylogenetic hidden Markov model for B cell receptor sequence analysis
Abstract
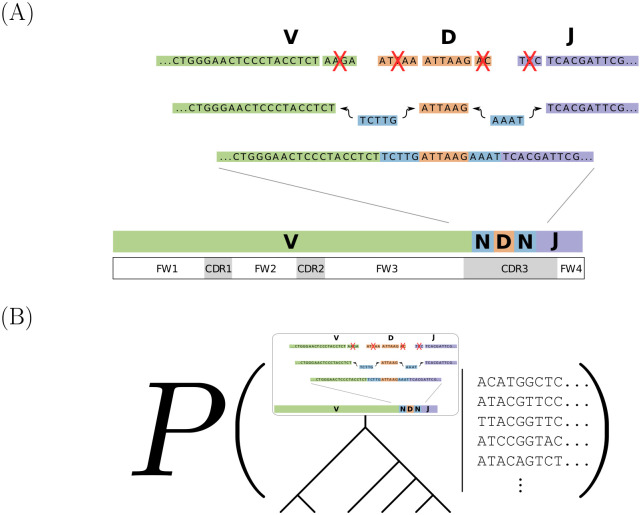
The human body generates a diverse set of high affinity antibodies, the soluble form of B cell receptors (BCRs), that bind to and neutralize invading pathogens. The natural development of BCRs must be understood in order to design vaccines for highly mutable pathogens such as influenza and HIV. BCR diversity is induced by naturally occurring combinatorial "V(D)J" rearrangement, mutation, and selection processes. Most current methods for BCR sequence analysis focus on separately modeling the above processes. Statistical phylogenetic methods are often used to model the mutational dynamics of BCR sequence data, but these techniques do not consider all the complexities associated with B cell diversification such as the V(D)J rearrangement process. In particular, standard phylogenetic approaches assume the DNA bases of the progenitor (or "naive") sequence arise independently and according to the same distribution, ignoring the complexities of V(D)J rearrangement. In this paper, we introduce a novel approach to Bayesian phylogenetic inference for BCR sequences that is based on a phylogenetic hidden Markov model (phylo-HMM). This technique not only integrates a naive rearrangement model with a phylogenetic model for BCR sequence evolution but also naturally accounts for uncertainty in all unobserved variables, including the phylogenetic tree, via posterior distribution sampling.
Conflict of interest statement
The authors have declared that no competing interests exist.
Figures
Similar articles
-
Consistency of VDJ Rearrangement and Substitution Parameters Enables Accurate B Cell Receptor Sequence Annotation.PLoS Comput Biol. 2016 Jan 11;12(1):e1004409. doi: 10.1371/journal.pcbi.1004409. eCollection 2016 Jan. PLoS Comput Biol. 2016. PMID: 26751373 Free PMC article.
-
Bayesian coestimation of phylogeny and sequence alignment.BMC Bioinformatics. 2005 Apr 1;6:83. doi: 10.1186/1471-2105-6-83. BMC Bioinformatics. 2005. PMID: 15804354 Free PMC article.
-
Likelihood-Based Inference of B Cell Clonal Families.PLoS Comput Biol. 2016 Oct 17;12(10):e1005086. doi: 10.1371/journal.pcbi.1005086. eCollection 2016 Oct. PLoS Comput Biol. 2016. PMID: 27749910 Free PMC article.
-
The Bayesian optimist's guide to adaptive immune receptor repertoire analysis.Immunol Rev. 2018 Jul;284(1):148-166. doi: 10.1111/imr.12664. Immunol Rev. 2018. PMID: 29944760 Free PMC article. Review.
-
The Diversity and Molecular Evolution of B-Cell Receptors during Infection.Mol Biol Evol. 2016 May;33(5):1147-57. doi: 10.1093/molbev/msw015. Epub 2016 Jan 22. Mol Biol Evol. 2016. PMID: 26802217 Free PMC article. Review.
Cited by
-
Rationalizing Random Walks: Replicating Protective Antibody Trajectories.Trends Immunol. 2021 Mar;42(3):186-197. doi: 10.1016/j.it.2021.01.001. Epub 2021 Jan 26. Trends Immunol. 2021. PMID: 33514459 Free PMC article. Review.
-
Phylogenetic analysis of migration, differentiation, and class switching in B cells.PLoS Comput Biol. 2022 Apr 25;18(4):e1009885. doi: 10.1371/journal.pcbi.1009885. eCollection 2022 Apr. PLoS Comput Biol. 2022. PMID: 35468128 Free PMC article.
-
Inference of B cell clonal families using heavy/light chain pairing information.PLoS Comput Biol. 2022 Nov 28;18(11):e1010723. doi: 10.1371/journal.pcbi.1010723. eCollection 2022 Nov. PLoS Comput Biol. 2022. PMID: 36441808 Free PMC article.
-
Ecological Processes Shaping Microbiomes of Extremely Low Birthweight Infants.Front Microbiol. 2022 Feb 28;13:812136. doi: 10.3389/fmicb.2022.812136. eCollection 2022. Front Microbiol. 2022. PMID: 35295290 Free PMC article.
-
Adaptive Immune Receptor Repertoire (AIRR) Community Guide to Repertoire Analysis.Methods Mol Biol. 2022;2453:297-316. doi: 10.1007/978-1-0716-2115-8_17. Methods Mol Biol. 2022. PMID: 35622333 Free PMC article.
References
Publication types
MeSH terms
Substances
Grants and funding
LinkOut - more resources
Full Text Sources
Other Literature Sources
