. 2020 Aug 17;16(8):e1008120.
doi: 10.1371/journal.pcbi.1008120. eCollection 2020 Aug.

Deconvolving the contributions of cell-type heterogeneity on cortical gene expression

Affiliations

Deconvolving the contributions of cell-type heterogeneity on cortical gene expression

Ellis Patrick et al. PLoS Comput Biol. .

Abstract

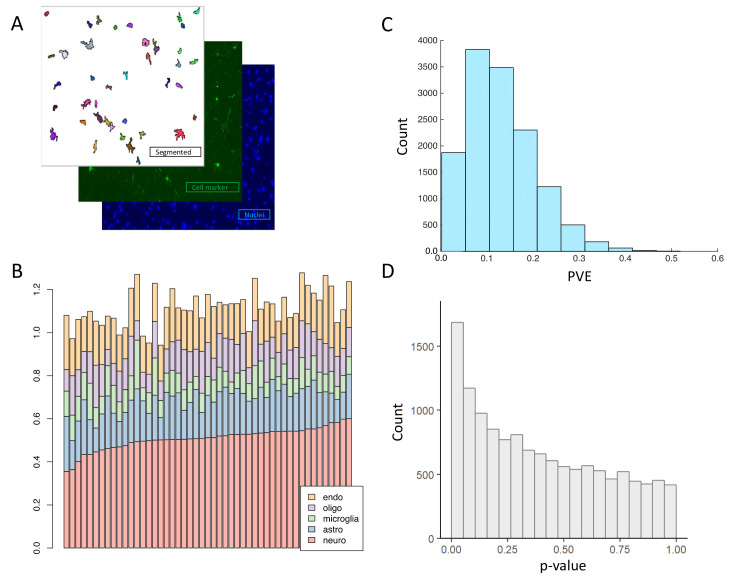
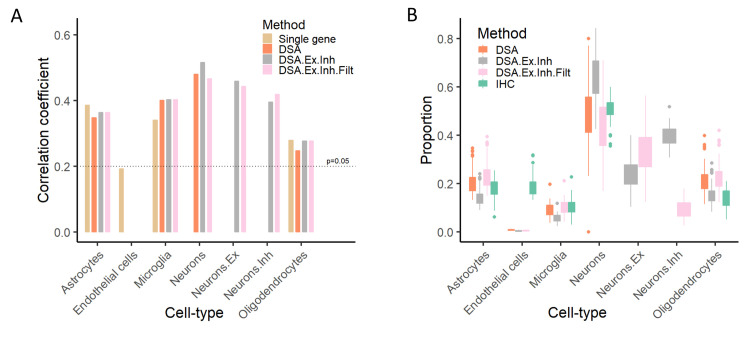
Complexity of cell-type composition has created much skepticism surrounding the interpretation of bulk tissue transcriptomic studies. Recent studies have shown that deconvolution algorithms can be applied to computationally estimate cell-type proportions from gene expression data of bulk blood samples, but their performance when applied to brain tissue is unclear. Here, we have generated an immunohistochemistry (IHC) dataset for five major cell-types from brain tissue of 70 individuals, who also have bulk cortical gene expression data. With the IHC data as the benchmark, this resource enables quantitative assessment of deconvolution algorithms for brain tissue. We apply existing deconvolution algorithms to brain tissue by using marker sets derived from human brain single cell and cell-sorted RNA-seq data. We show that these algorithms can indeed produce informative estimates of constituent cell-type proportions. In fact, neuronal subpopulations can also be estimated from bulk brain tissue samples. Further, we show that including the cell-type proportion estimates as confounding factors is important for reducing false associations between Alzheimer's disease phenotypes and gene expression. Lastly, we demonstrate that using more accurate marker sets can substantially improve statistical power in detecting cell-type specific expression quantitative trait loci (eQTLs).


Conflict of interest statement

The authors have declared that no competing interests exist.

Figures

Fig 1
Fig 1. Estimation of cell-type proportions by IHC.
(A) Figure depicts an example segmented IHC image used to quantify cell-type proportions. (B) A bar plot illustrating the total proportions of cell-types for an individual. Each bar represents an individual, y-axis shows the estimated proportion of each of the five cell-types. The proportions of the different cell-types for a specific individual are estimated from different images. The sum of the proportions of the cell-types should be close to one. (C) A histogram showing the Percent Variance Explained (PVE) of expression values of all genes (across 70 individuals) by the combination of proportion of five cell-types measured by IHC. For each gene, linear regression was used to estimate the gene expression levels of that gene across individuals from five covariates (representing IHC proportions from each of the five cell-types). A value of one would mean that all the variation in a gene’s expression could be explained by the IHC estimated proportions of cell-types. All values are less than 0.6. (D) A p-value distribution corresponding to the PVE histogram in panel C, showing the p-values for the correlation between gene expression levels (all expressed genes) and IHC-based cell-type proportions estimates across 70 individuals with paired data. As in panel C, expression level of each gene was used as the outcome in linear regression, with covariates included for IHC measurements from each cell-type. A peak at zero provides evidence that the variation of many genes can be explained by changes in cell-type proportions.
Fig 2
Fig 2. Computational estimation of cell-type proportions.
(A) Figure shows the Spearman correlation coefficient between IHC-based cell-type estimates and four deconvolution algorithms, in addition to the “single marker” based approach. For the single marker based approach, we used the expression of the widely used marker genes: ENO2 for neurons, GFAP for astrocytes, CD68 for microglia, CD34 for endothelial, OLIG2 for oligodendrocytes. Correlations larger than 0.2 provide evidence that the gene expression cell-type proportion estimate for that cell-type are correlated with the IHC cell-type proportion using an unadjusted p-value threshold of 0.05. (B) Estimates of absolute proportions of each cell-type in the DLPFC according to the four algorithms tested, and IHC (experimentally measured in this study). Box plots depict the range of proportions across 70 individuals. (C) Boxplots depict the similarities and differences of predicted cell-type proportions (using DSA algorithm and Zhang markers) across nine brain regions, based on bulk GTEx tissue data.
Fig 3
Fig 3. Cell-type proportions estimates with snRNA-seq.
(A) Boxplots show the cell-type proportions calculated from our IHC data and cell-type proportions calculated using a snRNA-seq dataset that was also generated from the ROSMAP cohort. Boxplots depict the range of proportions across 48 individuals. The boxplots for each cell-type should substantially overlap if the estimates from both datasets were similar. (B) Barplots of the correlations between the ROSMAP snRNA-seq data and the four deconvolution methods, single gene markers and two additional deconvolution approaches MuSiC and BSEQ-sc. MuSiC and BSEQ-sc are two methods that use snRNA-seq data as a reference to deconvolute bulk gene expression data and here they are using the ROSMAP snRNA-seq data as a reference to deconvolute the ROSMAP bulk gene expression data. These estimates are then compared back to the ROSMAP snRNA-seq proportions. (C) Boxplots depict the predicted proportion of cell-types estimated using MuSiC and BSEQ-sc compared to DSA and IHC. Both MuSiC and BSEQ-sc use cell-type markers and other information from the snRNA-seq data to deconvolute the bulk gene expression data. DSA was chosen to represent other deconvolution approaches as DSA, dtangle, CIBERSORT and NNLS all had similar estimates in Fig 2.
Fig 4
Fig 4. Inference of neuronal sub-types.
We used markers for inhibitory and excitatory neurons from Darmanis dataset, to predict the proportion of these two-neuronal sub-types, in addition to oligodendrocytes, endothelial, microglia, and astrocytes. To ensure that the deconvolution algorithms can robustly infer sub-types, we also filtered the list of markers to only include those that are differentially expressed in neurons (and are not also highly expressed elsewhere). (A) correlation between proportions of four major cell-types, in addition to two neuronal-subtypes, with measured IHC data. (B) Inferred proportions for four major cell-types, in addition to two neuronal sub-types. DSA method with Darmanis markers was used. DSA: algorithm was run on five major cell-type, as Fig 2. DSA.Ex.Inh: algorithm was run using four major cell-types, in addition to two neuronal sub-types. DSA.Ex.Inh.Filt: the neuronal sub-type markers where filtered to only include those that are highly expressed in neurons (based on Zhang dataset). Neuron.Ex and Neuron.Inh are the excitatory and inhibitory neurons respectively while, for DSA.Ex.Inh and DSA.Ex.Inh.Filt, Neuron is the sum of these two subsets. If DSA is robust, introducing extra cell sub-types shouldn’t alter the proportion estimates of other cell-types.
Fig 5
Fig 5. Utility of inferred proportions in association analysis.
(A) A scatter plot shows the signed p-value for association between each gene’s expression level and amyloid aggregation, as assessed on the ROSMAP dataset (N = 508). x-axis shows the association strength before adjusting for cellular heterogeneity, and y-axis show the association strength after adjusting for cellular heterogeneity. The dashed green lines mark the Bonferroni corrected p-value threshold based on this signed log p-value representation. The purple dots represent genes that are found to be significant in both adjusted and not-adjusted data; the red dots are genes that are only significant in not-adjusted data. (B) A bar plot shows the signed log10 p-values for association between inferred proportions and three AD related phenotypes. Predictions from DSA across 508 samples were used. (C) Figure shows the number of associations for several p-value thresholds. We tested ~34 x 106 eQTLs in total across cell-types, so the most stringent threshold based on Bonferroni correction is in the 10−9 range. We opted to clip the plot at a relaxed range of p < 10−6 to better display the differences in performance between using single gene marker sets and multiple gene marker sets. The p-values displayed are raw p-values without multiple testing correction. Number of associations found based on the DSA estimates are shown in blue, and those based on single cell marker genes are shown in yellow.

References

    1. Hoffman GE, Bendl J, Voloudakis G, Montgomery KS, Sloofman L, Wang YC, et al. CommonMind Consortium provides transcriptomic and epigenomic data for Schizophrenia and Bipolar Disorder. Sci Data. 2019;6(1):180 10.1038/s41597-019-0183-6 - DOI - PMC - PubMed
    1. Hodes RJ, Buckholtz N. Accelerating Medicines Partnership: Alzheimer’s Disease (AMP-AD) Knowledge Portal Aids Alzheimer’s Drug Discovery through Open Data Sharing. Expert Opinion on Therapeutic Targets. 2016;20(4):389–91. 10.1517/14728222.2016.1135132 - DOI - PubMed
    1. Mostafavi S, Gaiteri C, Sullivan SE, White CC, Tasaki S, Xu J, et al. A molecular network of the aging human brain provides insights into the pathology and cognitive decline of Alzheimer's disease. Nat Neurosci. 2018;21(6):811–9. 10.1038/s41593-018-0154-9 - DOI - PMC - PubMed
    1. Jaffe AE, Irizarry RA. Accounting for cellular heterogeneity is critical in epigenome-wide association studies. Genome Biol. 2014;15(2):R31 10.1186/gb-2014-15-2-r31 - DOI - PMC - PubMed
    1. Hunt GJ, Freytag S, Bahlo M, Gagnon-Bartsch JA. dtangle: accurate and fast cell-type deconvolution. bioRxiv. 2018. - PubMed

Publication types