. 2020 Aug 17;16(8):e1008977.
doi: 10.1371/journal.pgen.1008977. eCollection 2020 Aug.

Systematic identification of functional SNPs interrupting 3'UTR polyadenylation signals

Affiliations

Systematic identification of functional SNPs interrupting 3'UTR polyadenylation signals

Eldad David Shulman et al. PLoS Genet. .

Abstract

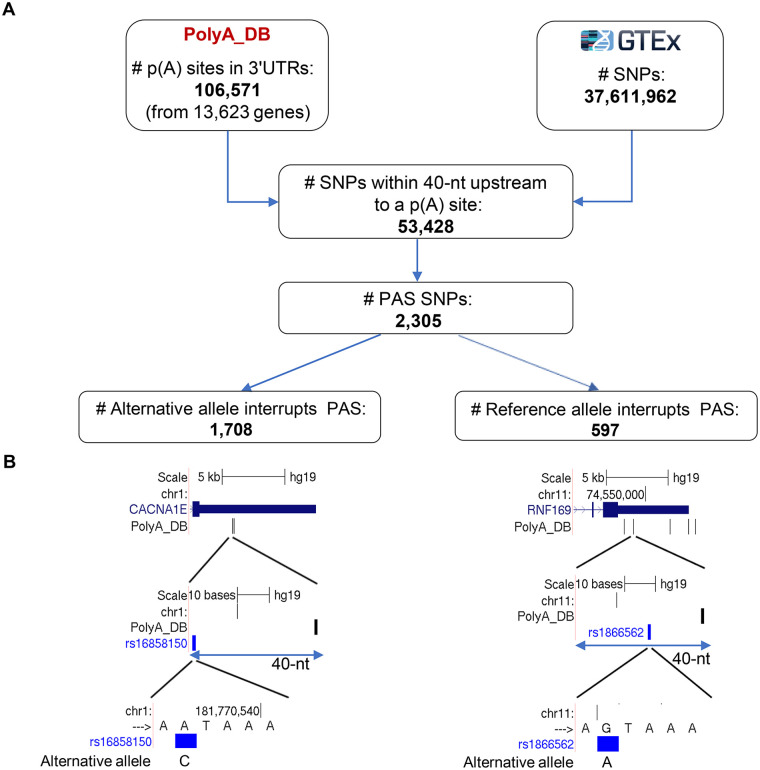
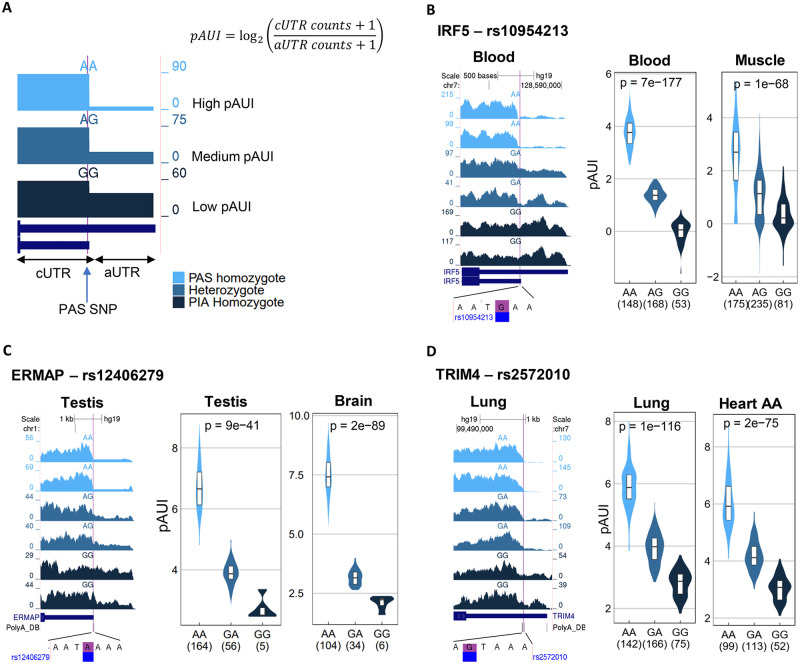
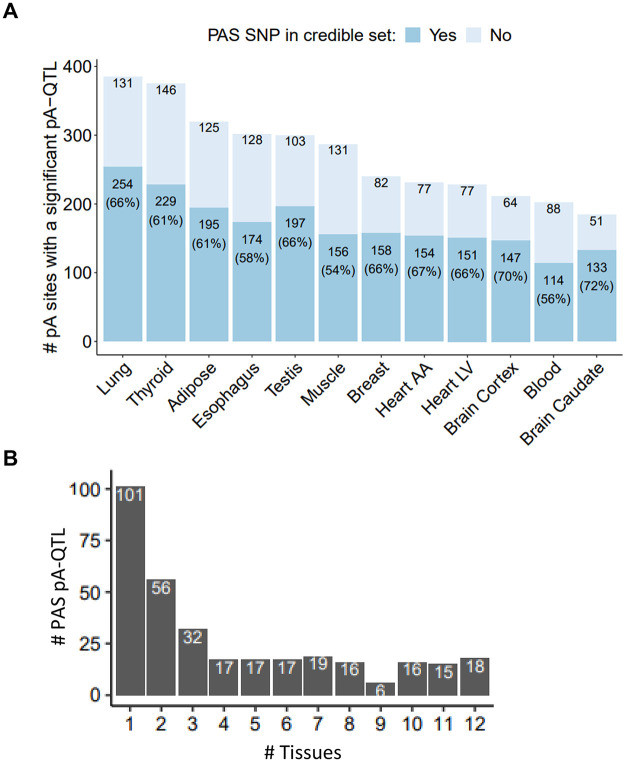
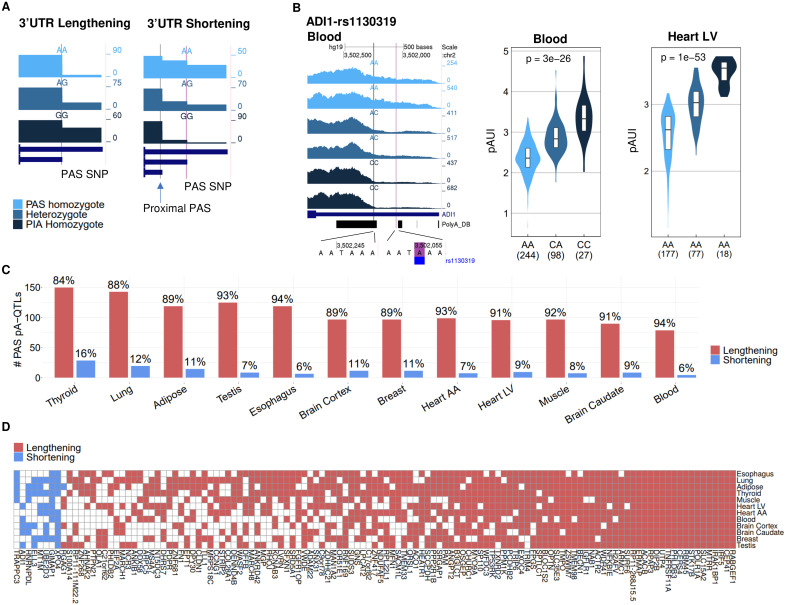
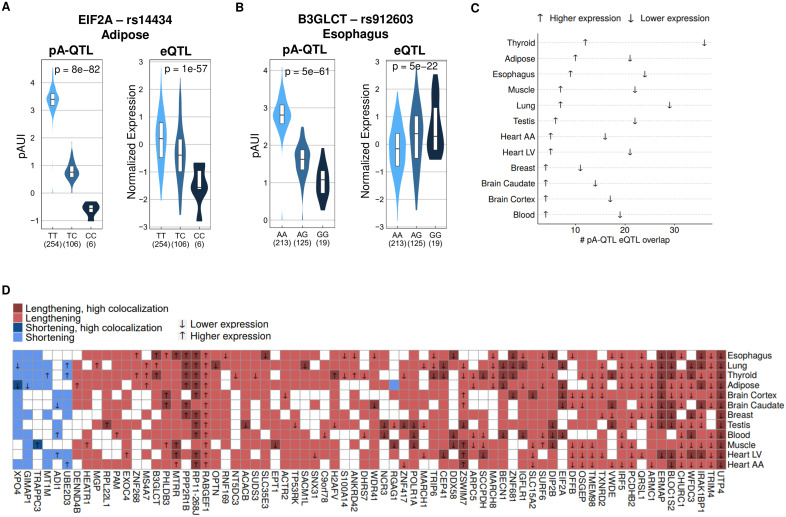
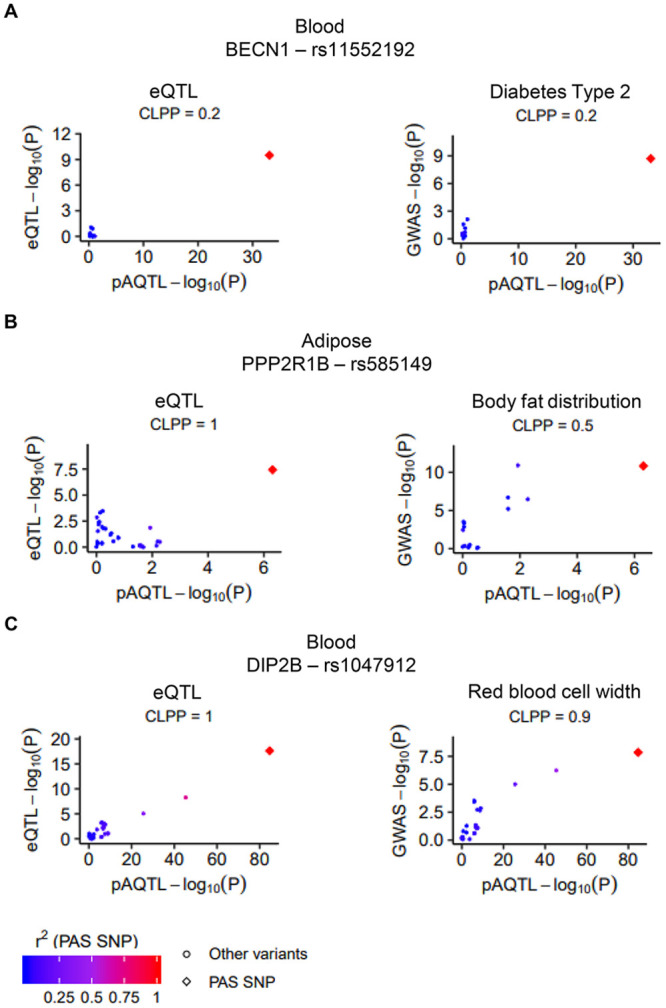
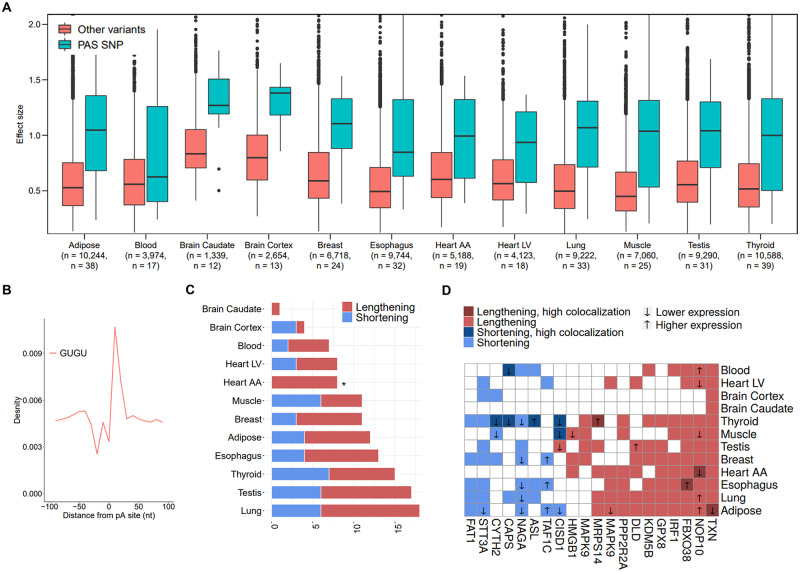
Alternative polyadenylation (APA) is emerging as a widespread regulatory layer since the majority of human protein-coding genes contain several polyadenylation (p(A)) sites in their 3'UTRs. By generating isoforms with different 3'UTR length, APA potentially affects mRNA stability, translation efficiency, nuclear export, and cellular localization. Polyadenylation sites are regulated by adjacent RNA cis-regulatory elements, the principals among them are the polyadenylation signal (PAS) AAUAAA and its main variant AUUAAA, typically located ~20-nt upstream of the p(A) site. Mutations in PAS and other auxiliary poly(A) cis-elements in the 3'UTR of several genes have been shown to cause human Mendelian diseases, and to date, only a few common SNPs that regulate APA were associated with complex diseases. Here, we systematically searched for SNPs that affect gene expression and human traits by modulation of 3'UTR APA. First, focusing on the variants most likely to exert the strongest effect, we identified 2,305 SNPs that interrupt the canonical PAS or its main variant. Implementing pA-QTL tests using GTEx RNA-seq data, we identified 330 PAS SNPs (called PAS pA-QTLs) that were significantly associated with the usage of their p(A) site. As expected, PAS-interrupting alleles were mostly linked with decreased cleavage at their p(A) site and the consequential 3'UTR lengthening. However, interestingly, in ~10% of the cases, the PAS-interrupting allele was associated with increased usage of an upstream p(A) site and 3'UTR shortening. As an indication of the functional effects of these PAS pA-QTLs on gene expression and complex human traits, we observed for few dozens of them marked colocalization with eQTL and/or GWAS signals. The PAS-interrupting alleles linked with 3'UTR lengthening were also strongly associated with decreased gene expression, indicating that shorter isoforms generated by APA are generally more stable than longer ones. Last, we carried out an extended, genome-wide analysis of 3'UTR variants and detected thousands of additional pA-QTLs having weaker effects compared to the PAS pA-QTLs.


Conflict of interest statement

The authors have declared that no competing interests exist.

Figures

Fig 1
Fig 1. Systematic identification of PAS SNPs in the human genome.
A. We defined as PAS SNPs those that are located within 40-nt upstream of an annotated 3’UTR p(A) site and have an allele that interrupts the canonical PAS sequence AATAAA or its main variant ATTAAA. We considered all the 3’UTR p(A) sites annotated in poly(A) DB (release 3.2), and all ~37M SNPs included in GTEX v7. We detected 2,305 such SNPs. Each biallelic SNP has a reference allele (the allele that appears in the genome’s reference sequence) and an alternative allele. Among the 2,305 PAS SNPs detected by our screen, 1,708 SNPs have the alternative allele interrupting the PAS sequence and 597 SNPs have the reference allele disrupting the signal. B. An example of a PAS SNP whose alternative allele interrupts the PAS signal (rs16858150 in the 3’UTR of CACNA1E; left) and a PAS SNP whose reference allele interrupts it (rs1866562 in the 3’UTR of RNF169; right).
Fig 2
Fig 2. pA-QTL analysis.
A. We used the p(A) site usage index (pAUI) to quantify cleavage efficiency at each annotated 3’UTR pA site in each RNA-seq sample. The pAUI is defined as the ratio (in log2 scale) between the counts of 3’UTR reads mapped upstream of the pA site (common 3’UTR segment; cUTR) and those mapped downstream of it (alternative 3’UTR segment; aUTR) (Methods). We then used this index to detect PAS SNPs that show a significant association between alleles and pAUI levels of their p(A) site. SNPs showing such association are referred to as pA-QTLs. The expected pattern, as shown in this cartoon, is that the PAS-preserving allele is associated with higher usage of the p(A) site while the PAS-interrupting allele (PIA) is associated with reduced usage of this site (resulting in 3’UTR lengthening). Heterozygotes for such SNPs are expected to show intermediate pAUI levels compared to the two homozygotes. The cartoon illustrates reads coverage on a 3’UTR for three RNA-seq samples of varying levels of pAUI, colored according to the genotype of the PAS SNP. BD. Examples of three PAS SNPs consistently detected as pA-QTLs in multiple tissues. In each example, the left panel shows read coverage in the gene’s 3’UTR from RNA-seq samples of two selected donors from each PAS SNP genotype. The vertical purple line marks the location of the PAS SNP. The genome reference sequence around the PAS SNP is shown below. Violin plots in the middle and left panels show the distribution of pAUI levels in each genotype group for a given tissue (In each plot, homozygotes of the PAS-preserving allele are shown in the left, heterozygotes–in the middle, and homozygotes to the PAS-interrupting allele (PIA)–in the right violin. The number of individuals in each group is indicated in parentheses, shown are nominal p-values obtained using FastQTL linear regression as described in the Methods). (In C, “Brain” refers to “Brain caudal nucleus”, and in D, “Heart AA” refers to “Heart atrial appendage”).
Fig 3
Fig 3. PAS SNPs indicated by CAVIAR as putative causal pA-QTLs.
A. Bars showing the number of pA sites significantly associated with pA-QTLs per tissue, and the proportion of cases in which the corresponding PAS SNP is included in CAVIAR’s credible set. B. Distribution of the number of different tissues in which each PAS SNP was indicated as pA-QTL variant. 49 PAS SNPs were indicated as causal pA-QTLs in at least 10 tissues.
Fig 4
Fig 4. The effect of PAS interrupting alleles (PIAs) on 3’UTR length.
A. Cartoons illustrating the anticipated 3’UTR lengthening effect of PIAs (left) and the unexpected 3’UTR shortening effect, due to elevated usage of an alternative proximal p(A) site (right). Note that in the lengthening case the PIA is associated with decreased pAUI levels whereas in the shortening case, the PIA is associated with elevated pAUI levels. B. An example of a PAS pA-QTL (rs1130319 in the 3’UTR of ADI1) whose PIA is associated with 3’UTR shortening (increased pAUI). Notably, this PAS SNP is detected as a pA-QTL in five different tissues, and in all these cases its PIA is consistently associated with 3’UTR shortening effect (shown in D) (nominal p-values obtained using FastQTL linear regression as described in the Methods). C. A bar chart of the effect of PAS pA-QTL’s PIAs on 3’UTR length per tissue. As expected, in the vast majority of cases the PIA showed a lengthening effect. D. PIA effect on 3’UTR length. Shown are all PAS pA-QTLs detected in at least five tissues. Remarkably, in all these cases, the PIAs showed a consistent effect over all the tissues in which its PAS SNP was detected as a pA-QTL.
Fig 5
Fig 5. Colocalization of pA-QTL and eQTL signals.
A. An example of a PAS SNP (rs14434 in the 3’UTR of EIF2A) that is both a pA-QTL and an eQTL (of this gene). The PIA of rs14434 (which is the C allele) is associated with lower pAUI at the corresponding p(A) site (and thus, 3’UTR lengthening) and lower expression level of EIF2A. Notably, rs14434 consistently showed this same effect in five different tissues (Fig 5D). B. An example of the uncommon case where a PIA (the G allele, in this case) was associated with decreased pAUI of the corresponding p(A) site (that is, 3’UTR lengthening) but with higher expression of the target gene. This PIA showed the same effect in three different tissues (Fig 5D) (pA-QTL nominal p-values calculated using FastQTL linear regression as described in the Methods, eQTL p-values were obtained from GTEx v7). C. A Cleveland dot plot of the PAS pA-QTLs overlapping an eQTL (for the same gene) whose PIA showed a 3’UTR lengthening effect. Arrow indicates the direction of the link between the PIA and gene expression. In all tissues, 3’UTR lengthening was significantly associated with decreased expression (one-tailed binomial tests, p-values < 0.05 in all tissues). D. Association between PIA effect on 3’UTR length (coded by color) and gene expression (shown by an arrow). Cases supported by the colocalization of the pA-QTL and eQTL signals (CLPP > 0.01) are shown in darker colors. (Shown in this heatmap are the PAS pA-QTLs with lengthening/shortening effect in at least seven tissues and that overlapped a GTEx eQTL in at least one tissue. Squares with no color indicate no overlap with eQTL).
Fig 6
Fig 6. Colocalization of pA-QTL, eQTL and GWAS signals.
Examples of PAS pA-QTLs that showed marked colocalization with both eQTL and GWAS signals in the 3’UTRs of the genes: A. BECN1. B. PPP2R1B. C. DIP2B. Dots are colored according to their LD (r2) with the PAS SNP (calculated according to GTEx VCF files for eQTL plots and according to genome 1000 VCFs files for GWAS plots). Diamond shape signifies the PAS SNP. CLPP is colocalization posterior probability calculated using eCaviar (Methods).
Fig 7
Fig 7. Genome-wide pA-QTL analysis of 3’UTR SNPs.
A. Comparison between effect magnitudes (the absolute value of the slope calculated by FastQTL) of PAS pA-QTLs and other 3’UTR pA-QTLs (for both sets, we did not require here inclusion in CAVIAR’s credible set). B. Location distribution of the GUGU motif with respect to 3’UTR p(A) sites (annotated in polyA DB). This motif shows a strong peak at ~20 nt downstream of the cleavage site. C. The effect of pA-QTLs interrupting a GUGU motif on 3’UTR length. (This analysis included the subset of these variants that were contained in CAVIAR’s credible set; *p-value<0.05; calculated using a one-tailed binomial test). D. Association between pA-QTLs interrupting a GUGU motif, 3’UTR length and gene expression (eQTLs). Shown here are variants detected as pA-QTLs in at least three tissues. Colors are as in Fig 5D.

Similar articles

Cited by

References

    1. Tian B, Manley JL: Alternative polyadenylation of mRNA precursors. Nat Rev Mol Cell Biol 2017, 18:18–30. 10.1038/nrm.2016.116 - DOI - PMC - PubMed
    1. Tian B, Hu J, Zhang H, Lutz CS: A large-scale analysis of mRNA polyadenylation of human and mouse genes. Nucleic Acids Res 2005, 33:201–212. 10.1093/nar/gki158 - DOI - PMC - PubMed
    1. Cheng Y, Miura RM, Tian B: Prediction of mRNA polyadenylation sites by support vector machine. Bioinformatics 2006, 22:2320–2325. 10.1093/bioinformatics/btl394 - DOI - PubMed
    1. Derti A, Garrett-Engele P, Macisaac KD, Stevens RC, Sriram S, Chen R, Rohl CA, Johnson JM, Babak T: A quantitative atlas of polyadenylation in five mammals. Genome Res 2012, 22:1173–1183. 10.1101/gr.132563.111 - DOI - PMC - PubMed
    1. Hoque M, Ji Z, Zheng D, Luo W, Li W, You B, Park JY, Yehia G, Tian B: Analysis of alternative cleavage and polyadenylation by 3’ region extraction and deep sequencing. Nat Methods 2013, 10:133–139. 10.1038/nmeth.2288 - DOI - PMC - PubMed

Publication types

MeSH terms