

Modeling time-varying brain networks with a self-tuning optimized Kalman filter
- PMID: 32804971
- PMCID: PMC7451990
- DOI: 10.1371/journal.pcbi.1007566
Modeling time-varying brain networks with a self-tuning optimized Kalman filter
Abstract
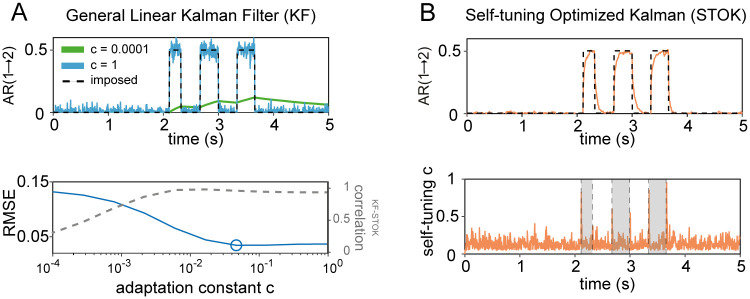
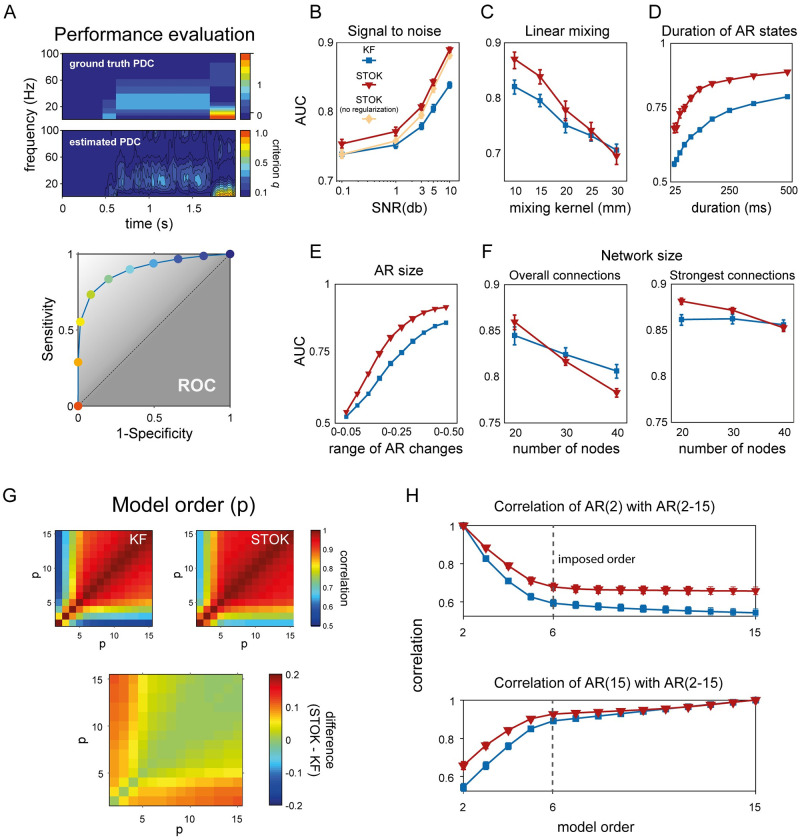
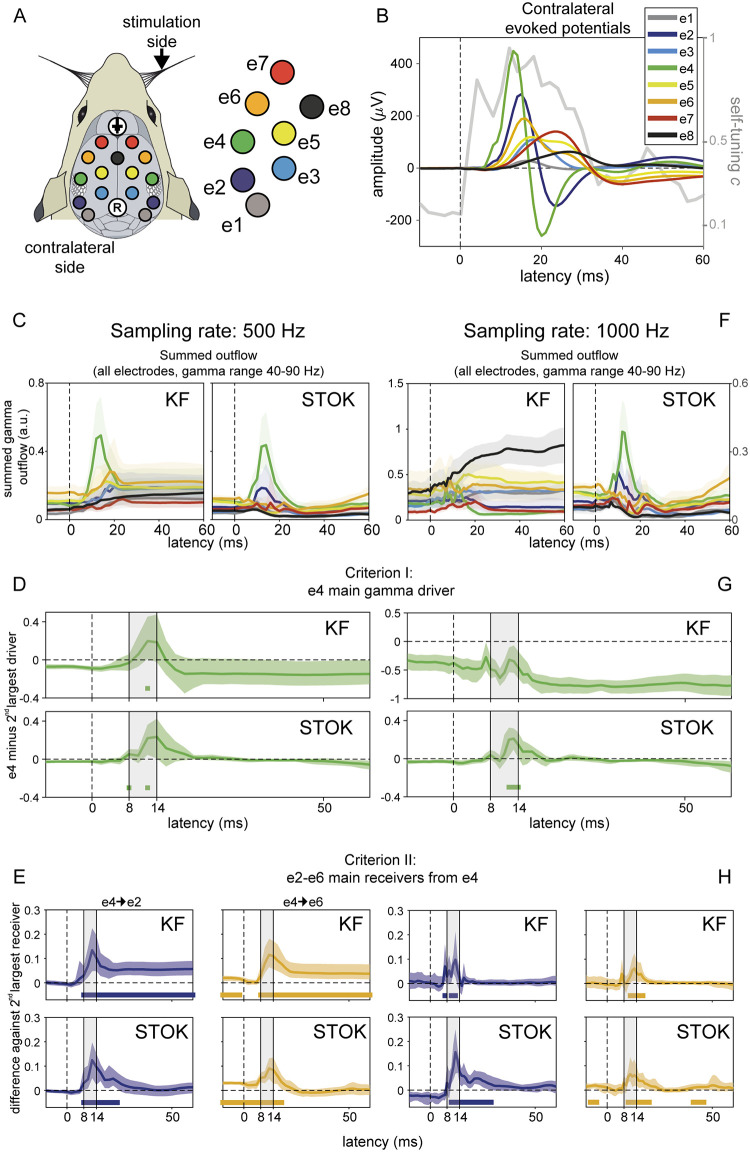
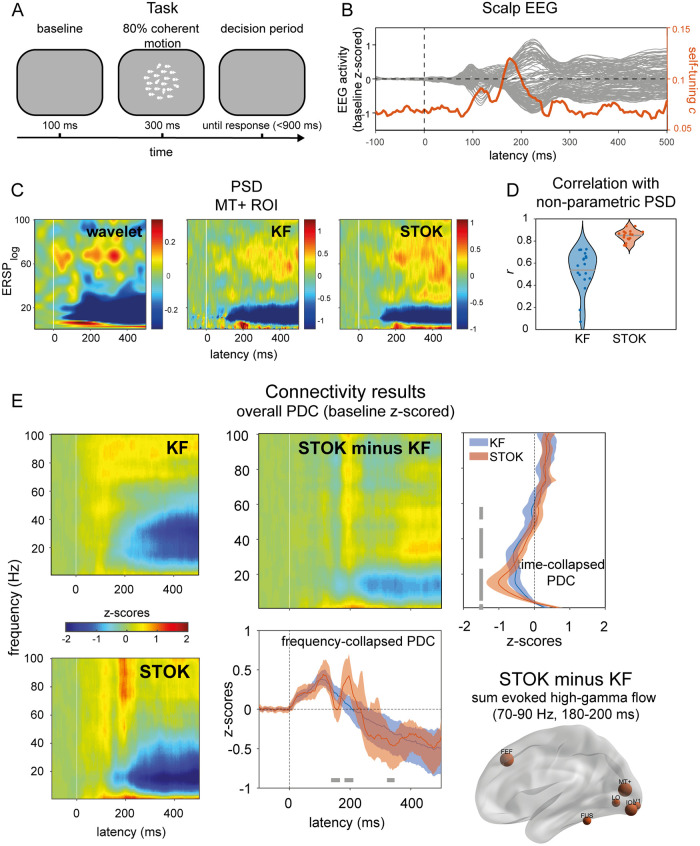
Brain networks are complex dynamical systems in which directed interactions between different areas evolve at the sub-second scale of sensory, cognitive and motor processes. Due to the highly non-stationary nature of neural signals and their unknown noise components, however, modeling dynamic brain networks has remained one of the major challenges in contemporary neuroscience. Here, we present a new algorithm based on an innovative formulation of the Kalman filter that is optimized for tracking rapidly evolving patterns of directed functional connectivity under unknown noise conditions. The Self-Tuning Optimized Kalman filter (STOK) is a novel adaptive filter that embeds a self-tuning memory decay and a recursive regularization to guarantee high network tracking accuracy, temporal precision and robustness to noise. To validate the proposed algorithm, we performed an extensive comparison against the classical Kalman filter, in both realistic surrogate networks and real electroencephalography (EEG) data. In both simulations and real data, we show that the STOK filter estimates time-frequency patterns of directed connectivity with significantly superior performance. The advantages of the STOK filter were even clearer in real EEG data, where the algorithm recovered latent structures of dynamic connectivity from epicranial EEG recordings in rats and human visual evoked potentials, in excellent agreement with known physiology. These results establish the STOK filter as a powerful tool for modeling dynamic network structures in biological systems, with the potential to yield new insights into the rapid evolution of network states from which brain functions emerge.
Conflict of interest statement
The authors have declared that no competing interests exist.
Figures
Similar articles
-
Estimation of effective brain connectivity with dual Kalman filter and EEG source localization methods.Australas Phys Eng Sci Med. 2017 Sep;40(3):675-686. doi: 10.1007/s13246-017-0578-7. Epub 2017 Aug 29. Australas Phys Eng Sci Med. 2017. PMID: 28852979
-
Seizure-Onset Mapping Based on Time-Variant Multivariate Functional Connectivity Analysis of High-Dimensional Intracranial EEG: A Kalman Filter Approach.Brain Topogr. 2017 Jan;30(1):46-59. doi: 10.1007/s10548-016-0527-x. Epub 2016 Oct 8. Brain Topogr. 2017. PMID: 27722839
-
Estimation of time-varying causal connectivity on EEG signals with the use of adaptive autoregressive parameters.Annu Int Conf IEEE Eng Med Biol Soc. 2008;2008:3512-5. doi: 10.1109/IEMBS.2008.4649963. Annu Int Conf IEEE Eng Med Biol Soc. 2008. PMID: 19163466
-
Spatio-temporal modeling of connectome-scale brain network interactions via time-evolving graphs.Neuroimage. 2018 Oct 15;180(Pt B):350-369. doi: 10.1016/j.neuroimage.2017.10.067. Epub 2017 Nov 10. Neuroimage. 2018. PMID: 29102809 Free PMC article. Review.
-
Mapping of the neuronal networks of human cortical brain functions.Adv Tech Stand Neurosurg. 2003;28:91-142. doi: 10.1007/978-3-7091-0641-9_2. Adv Tech Stand Neurosurg. 2003. PMID: 12627809 Review.
Cited by
-
Structurally informed models of directed brain connectivity.Nat Rev Neurosci. 2025 Jan;26(1):23-41. doi: 10.1038/s41583-024-00881-3. Epub 2024 Dec 11. Nat Rev Neurosci. 2025. PMID: 39663407 Review.
-
A Comparative Study of Causality Detection Methods in Root Cause Diagnosis: From Industrial Processes to Brain Networks.Sensors (Basel). 2024 Jul 29;24(15):4908. doi: 10.3390/s24154908. Sensors (Basel). 2024. PMID: 39123955 Free PMC article.
-
A survey of brain network analysis by electroencephalographic signals.Cogn Neurodyn. 2022 Feb;16(1):17-41. doi: 10.1007/s11571-021-09689-8. Epub 2021 Jun 14. Cogn Neurodyn. 2022. PMID: 35126769 Free PMC article.
-
Structure supports function: Informing directed and dynamic functional connectivity with anatomical priors.Netw Neurosci. 2022 Jun 1;6(2):401-419. doi: 10.1162/netn_a_00218. eCollection 2022 Jun. Netw Neurosci. 2022. PMID: 35733424 Free PMC article.
-
Investigating the effect of template head models on Event-Related Potential source localization: a simulation and real-data study.Front Neurosci. 2024 Oct 8;18:1443752. doi: 10.3389/fnins.2024.1443752. eCollection 2024. Front Neurosci. 2024. PMID: 39440187 Free PMC article.
References
-
- Varela F, Lachaux JP, Rodriguez E, Martinerie J. The brainweb: phase synchronization and large-scale integration. Nat Rev Neurosci. aprile 2001;2(4):229–39. - PubMed
-
- Britz J, Van De Ville D, Michel CM. BOLD correlates of EEG topography reveal rapid resting-state network dynamics. NeuroImage. 1 ottobre 2010;52(4):1162–70. - PubMed
Publication types
MeSH terms
LinkOut - more resources
Full Text Sources
