

Objective Biomarkers for Total Added Sugar Intake - Are We on a Wild Goose Chase?
- PMID: 32805008
- PMCID: PMC7666891
- DOI: 10.1093/advances/nmaa093
Objective Biomarkers for Total Added Sugar Intake - Are We on a Wild Goose Chase?
Abstract
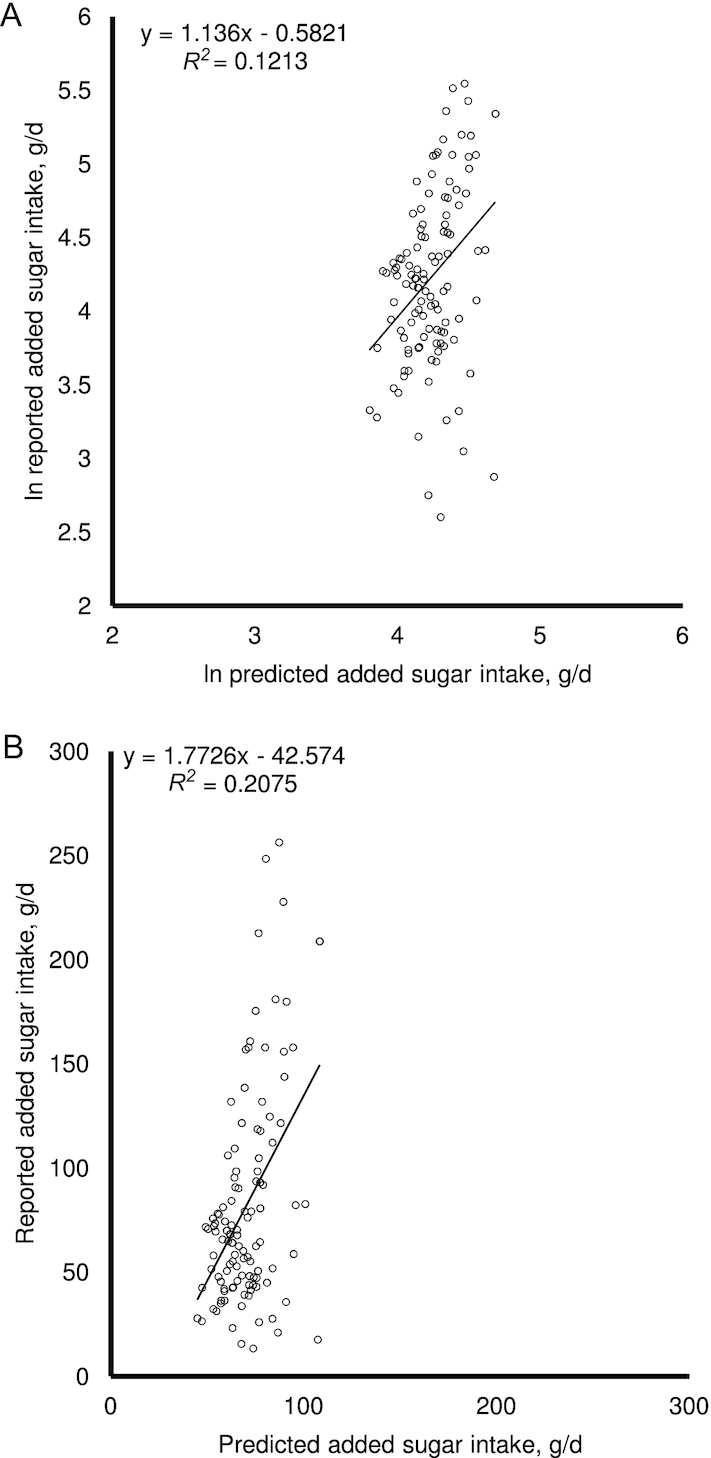
Misreporting of added sugar intake has been the major criticism of studies linking high added sugar consumption to adverse health outcomes. Despite the advancement in dietary assessment methodologies, the bias introduced by self-reporting can never be completely eliminated. The search for an objective biomarker for total added sugar intake has therefore been a topic of interest. In this article, the reasons this search may be a wild goose chase will be outlined and discussed. The limitations and inability of the 2 candidate biomarkers, namely urinary sucrose and fructose and δ¹³C isotope, which are based on the 2 only possible ways (i.e., difference in metabolism and plant sources) to identify added sugar based on current knowledge in human physiology and food and nutritional sciences, are discussed in detail. Validation studies have shown that these 2 candidate biomarkers are unlikely to be suitable for use as a predictive or calibration biomarker for total added sugar intake. Unless advancement in our understanding in human physiology and food and nutritional sciences leads to new potential ways to distinguish between naturally occurring and added sugars, it is extremely unlikely that any accurate objective added sugar biomarker could be found. It may be time to stop the futile effort in searching for such a biomarker, and resources may be better spent on further improving and innovating dietary assessment methods to minimize the bias introduced by self-reporting.
Keywords: added sugars; biomarker; metabolite; urinary sucrose; validity; δ¹³C isotope.
Copyright © The Author(s) on behalf of the American Society for Nutrition 2020.
Figures


References
-
- World Health Organization Guideline: Sugar Intake For Adults and Children. Geneva; 2015. - PubMed
-
- Cottrell RC. Sugar: an excess of anything can harm. Nature. 2012;483(7388):158. - PubMed
-
- Johnson RK, Appel LJ, Brands M, Howard BV, Lefevre M, Lustig RH, Sacks F, Steffen LM, Wylie-Rosett J, American Heart Association Nutrition Committee of the Council on Nutrition PA et al. Dietary sugars intake and cardiovascular health: a scientific statement from the American Heart Association. Circulation. 2009;120(11):1011–20. - PubMed
-
- Watts G. Sugar and the heart: old ideas revisited. BMJ. 2013;346:e7800. - PubMed
