. 2021 Apr 20;37(3):326-333.
doi: 10.1093/bioinformatics/btaa722.

Inferring cancer progression from Single-Cell Sequencing while allowing mutation losses

Affiliations

Inferring cancer progression from Single-Cell Sequencing while allowing mutation losses

Simone Ciccolella et al. Bioinformatics. .

Abstract

Motivation: In recent years, the well-known Infinite Sites Assumption has been a fundamental feature of computational methods devised for reconstructing tumor phylogenies and inferring cancer progressions. However, recent studies leveraging single-cell sequencing (SCS) techniques have shown evidence of the widespread recurrence and, especially, loss of mutations in several tumor samples. While there exist established computational methods that infer phylogenies with mutation losses, there remain some advancements to be made.

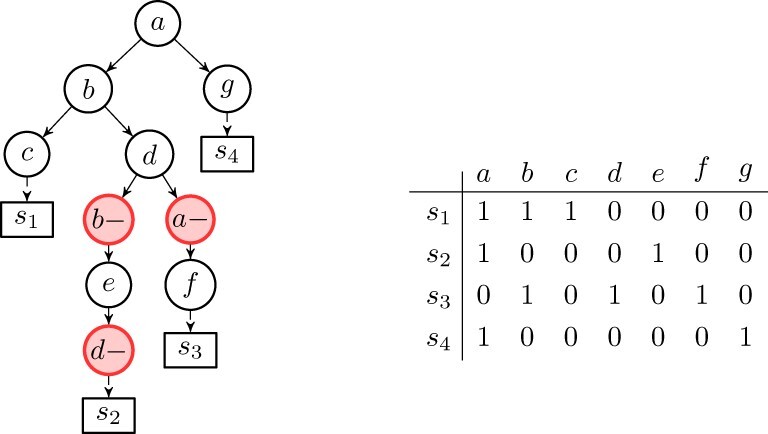
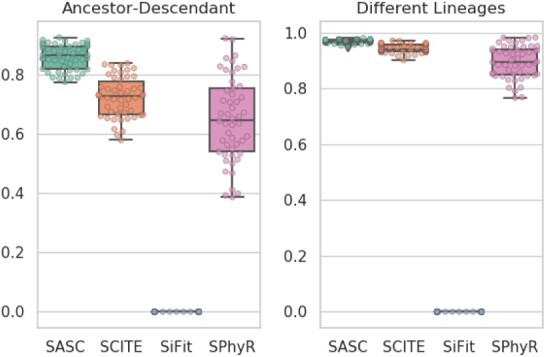
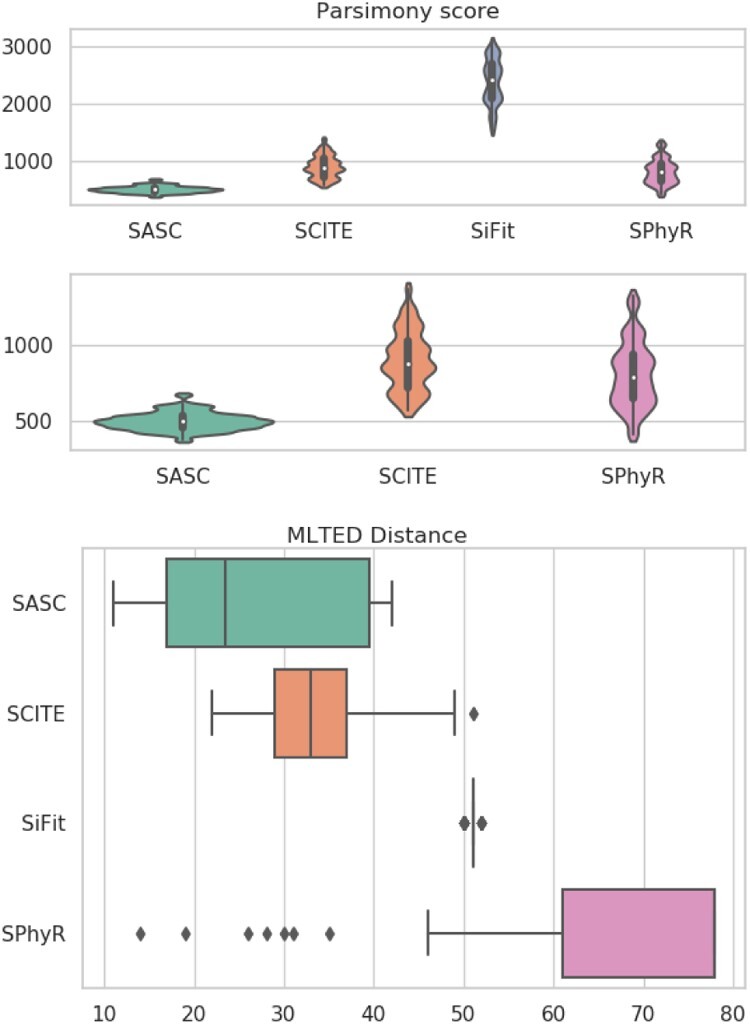
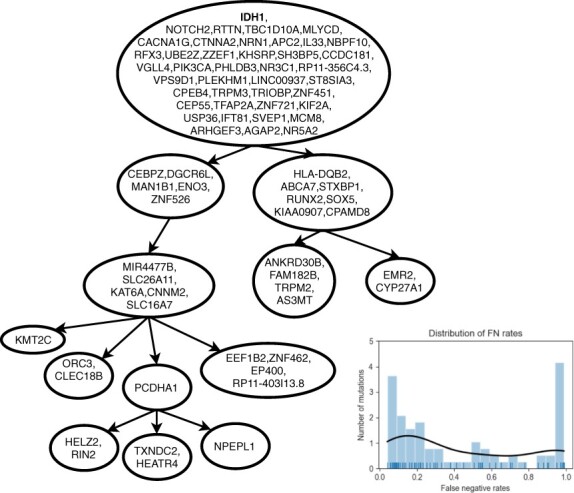
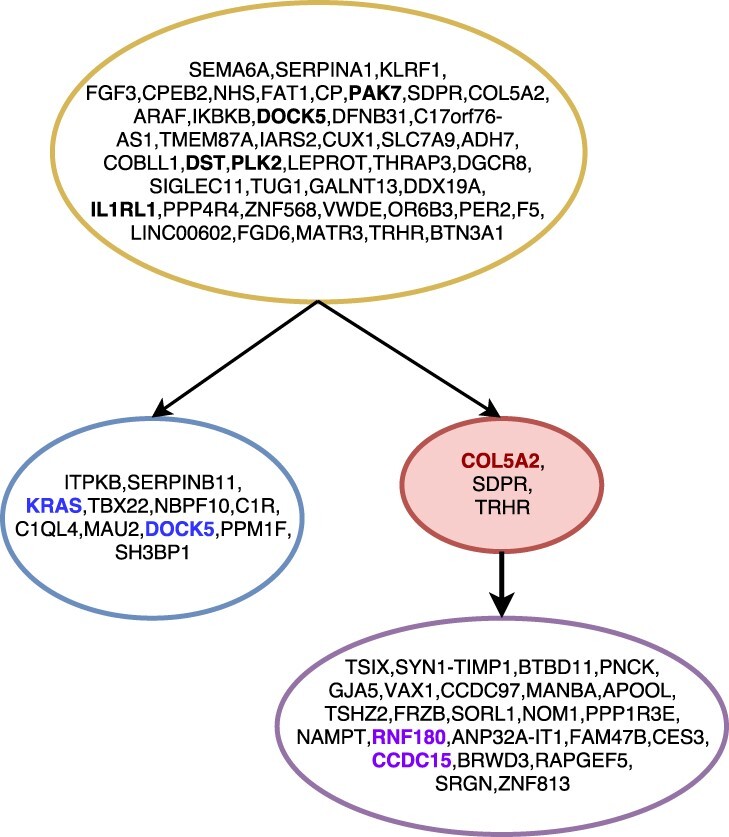
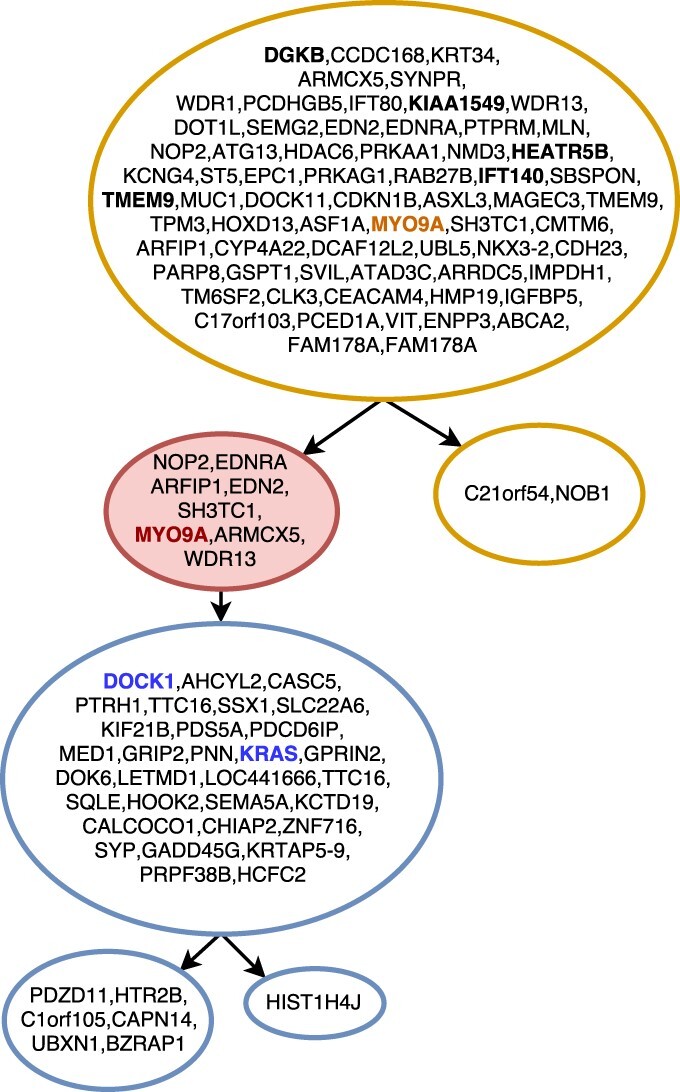
Results: We present Simulated Annealing Single-Cell inference (SASC): a new and robust approach based on simulated annealing for the inference of cancer progression from SCS datasets. In particular, we introduce an extension of the model of evolution where mutations are only accumulated, by allowing also a limited amount of mutation loss in the evolutionary history of the tumor: the Dollo-k model. We demonstrate that SASC achieves high levels of accuracy when tested on both simulated and real datasets and in comparison with some other available methods.

Availability and implementation: The SASC tool is open source and available at https://github.com/sciccolella/sasc.

Supplementary information: Supplementary data are available at Bioinformatics online.


Figures

Fig. 1.
Fig. 1.
Example of a binary matrix E (right) representing a sample of the (n = 4) cells {s1s4} affected by the set C={ag} of mutations. The tree (left) is a cancer phylogeny T explaining this matrix. Note that, the state of the internal node in the tree (left) labeled with (mutation) f has state {b, d, f} (mutation a appears in the root, but was lost in the path to this node), hence the genotype profile D(T,s3) of leaf s3 in the tree is 0101010. Note that Esi=D(T,σsi) holds for the (trivial) mapping σsi=si, hence T (left) encodes E (right). Informally, leaf s1 was ‘attached’ to the internal node labeled by f because genotype profile D(T,s3) of leaf s3 in T matches the row for s3 in E, e.g. Observe that the matrix (right) does not allow a perfect phylogeny, and that the tree (left) is a Dollo-1 phylogeny
Fig. 2.
Fig. 2.
Accuracy results for the simulated experiment. In this experiment, SASC scores better than any other tool in these measures. Once again SiFit is the poorest scoring method. The accuracy of SPhyR lowers when mutation losses are included into the dataset and it is forced to employ a Dollo model. To the contrary, SASC performs the best when it utilizes the full extent of its capabilities, i.e. the handling of heterogeneous false-negative rates and mutation losses. Notice that larger values in both measures are better
Fig. 3.
Fig. 3.
Accuracy results for the simulated experiment. According to these two measures, SASC scores better than any other tool. A clear performance drop is noticed when SPhyR is forced to employ a Dollo model. We represent the results of the parsimony score with and without SiFit, since its results are much different from the other ones. Notice that smaller values of both measures are better
Fig. 4.
Fig. 4.
False-negative rates estimation for the simulated experiment. SASC estimates the false-negative rates better than the other tools, both in terms of average estimation, as well as MSE of the single rates for each mutation. Especially in the latter measure, we can notice a vast discrepancy in the accuracy of the estimation of false-negative rates. The thick red line is the average of the individual false-negative rates of the mutations in the ground truth
Fig. 5.
Fig. 5.
Tree inferred by SASC for the oligodendroglioma IDH-mutated MGH36 from Tirosh et al. (2016). The tree was computed using as input different false-negative rates for each mutation, whose distribution can be seen in the bottom-right corner plot. The picture was drawn using the SASC-viz post-processing tool
Fig. 6.
Fig. 6.
The tree inferred by SASC for Patient 4 of the Childhood Lymphoblastic Leukemia data from Gawad et al. (2014). Different clones are indicated with different colors. Red nodes indicate deletions of mutations, while bold-faced mutations are the mutations indicated as driver in the original sequencing study. Mutations in bold and colored are driver mutations for the clone with the same color. Mutations are clustered by collapsing simple linear paths. The picture was drawn using the SASC-viz post-processing tool
Fig. 7.
Fig. 7.
Tree inferred by SASC for Patient 5 of the Childhood Lymphoblastic Leukemia data from Gawad et al. (2014). Different clones are indicated with different colors, while the red-colored nodes indicate deletions of mutations, and mutations highlighted in bold are the mutations indicated as driver in the original sequencing study. Mutations bold-faced and colored are driver mutations for the same colored clone. Mutations are clustered by collapsing simple linear paths. The picture was drawn using the SASC-viz post-processing tool

References

    1. Bonizzoni P. et al. (2012) The binary perfect phylogeny with persistent characters. Theor. Comput. Sci., 454, 51–63.
    1. Bonizzoni P. et al. (2017) A colored graph approach to perfect phylogeny with persistent characters. Theor. Comput. Sci., 658, 60–73.
    1. Bonizzoni P. et al. (2018) Does relaxing the infinite sites assumption give better tumor phylogenies? An ILP-based comparative approach. IEEE/ACM Trans. Comput. Biol. Bioinform., 16, 1410–1423. - PubMed
    1. Brown D. et al. (2017) Phylogenetic analysis of metastatic progression in breast cancer using somatic mutations and copy number aberrations. Nat. Commun., 8, 14944. - PMC - PubMed
    1. Della Vedova G. et al. (2017) Character-based Phylogeny Construction and Its Application to Tumor Evolution. Lecture Notes in Computer Science. Unveiling Dynamics and Complexity - 13th Conference on Computability in Europe, CiE 2017, Turku, Finland, June 12-16, 2017, Proceedings. Vol. 10307, pp. 3–13.

Publication types