. 2020 Dec;159(6):2146-2162.e33.
doi: 10.1053/j.gastro.2020.08.018. Epub 2020 Aug 15.

The Long Noncoding RNA CCAT2 Induces Chromosomal Instability Through BOP1-AURKB Signaling

Affiliations

The Long Noncoding RNA CCAT2 Induces Chromosomal Instability Through BOP1-AURKB Signaling

Baoqing Chen et al. Gastroenterology. 2020 Dec.

Abstract

Background & aims: Chromosomal instability (CIN) is a carcinogenesis event that promotes metastasis and resistance to therapy by unclear mechanisms. Expression of the colon cancer-associated transcript 2 gene (CCAT2), which encodes a long noncoding RNA (lncRNA), associates with CIN, but little is known about how CCAT2 lncRNA regulates this cancer enabling characteristic.

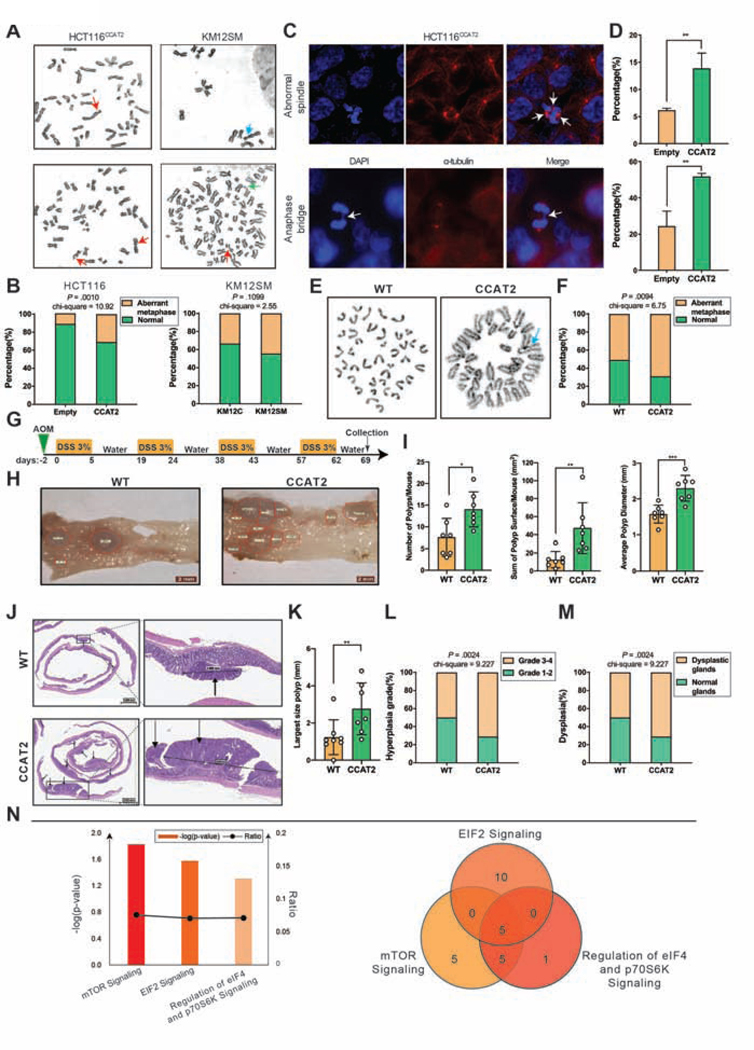
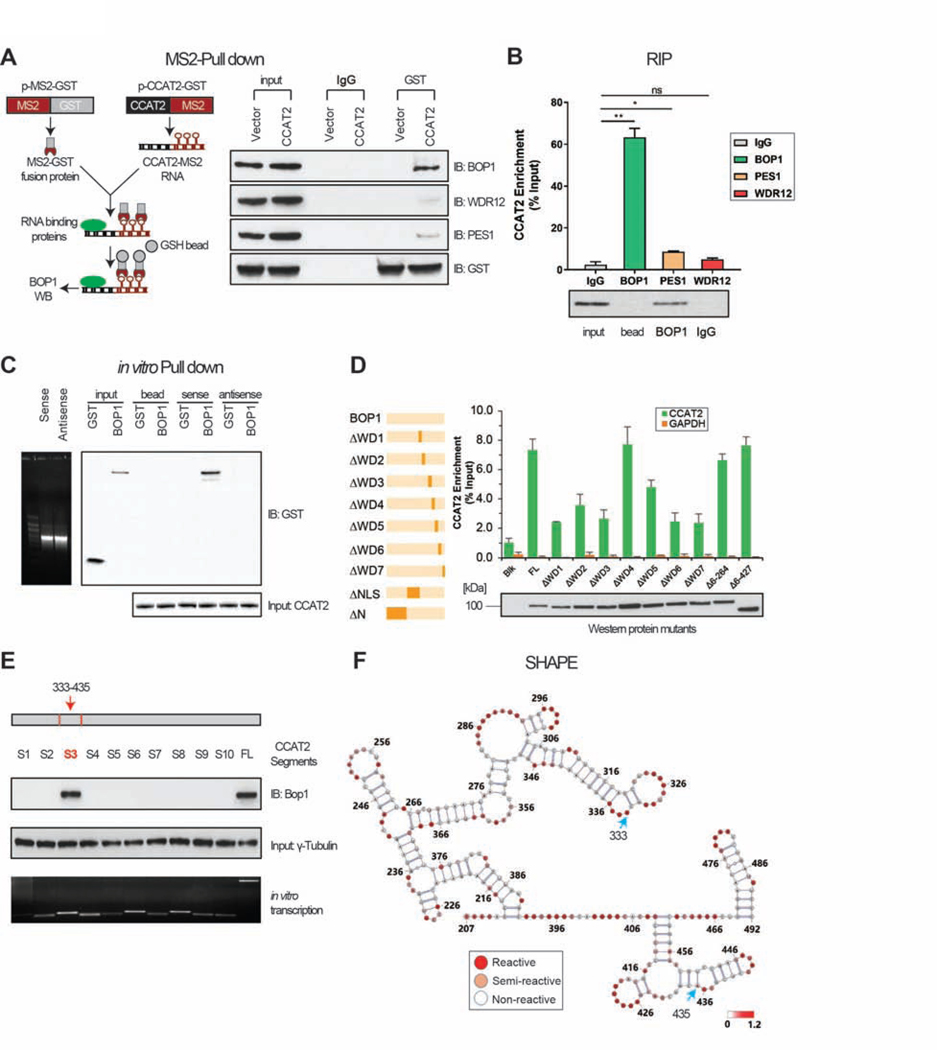
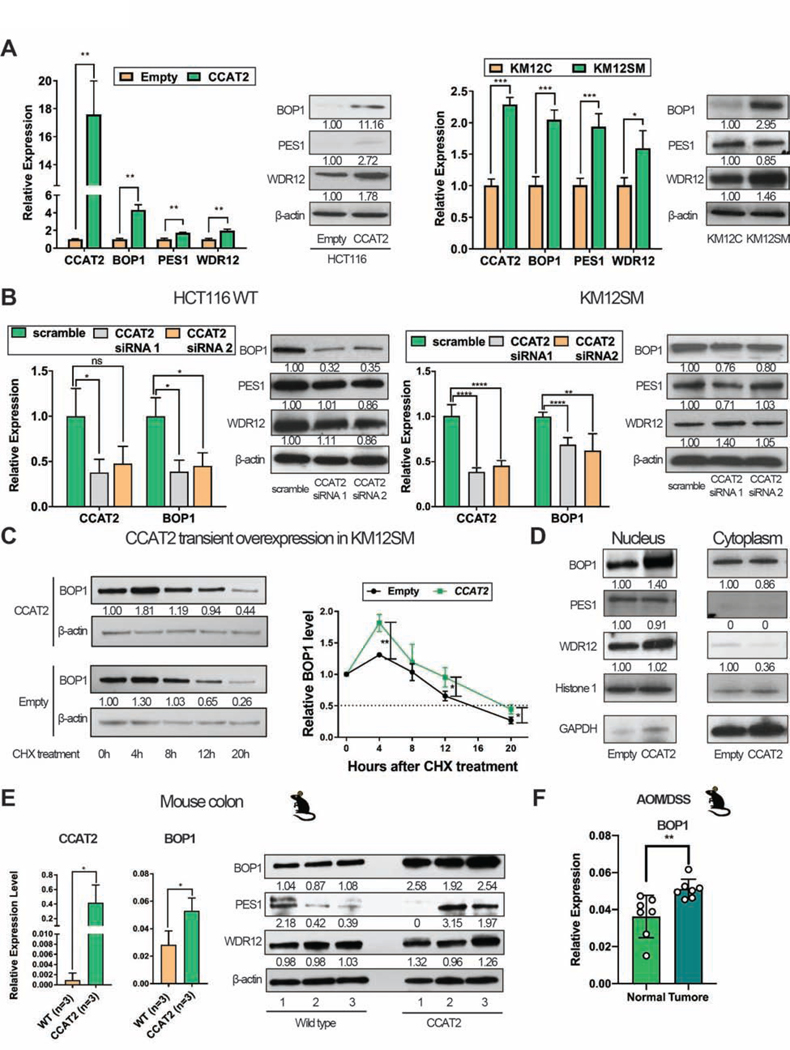
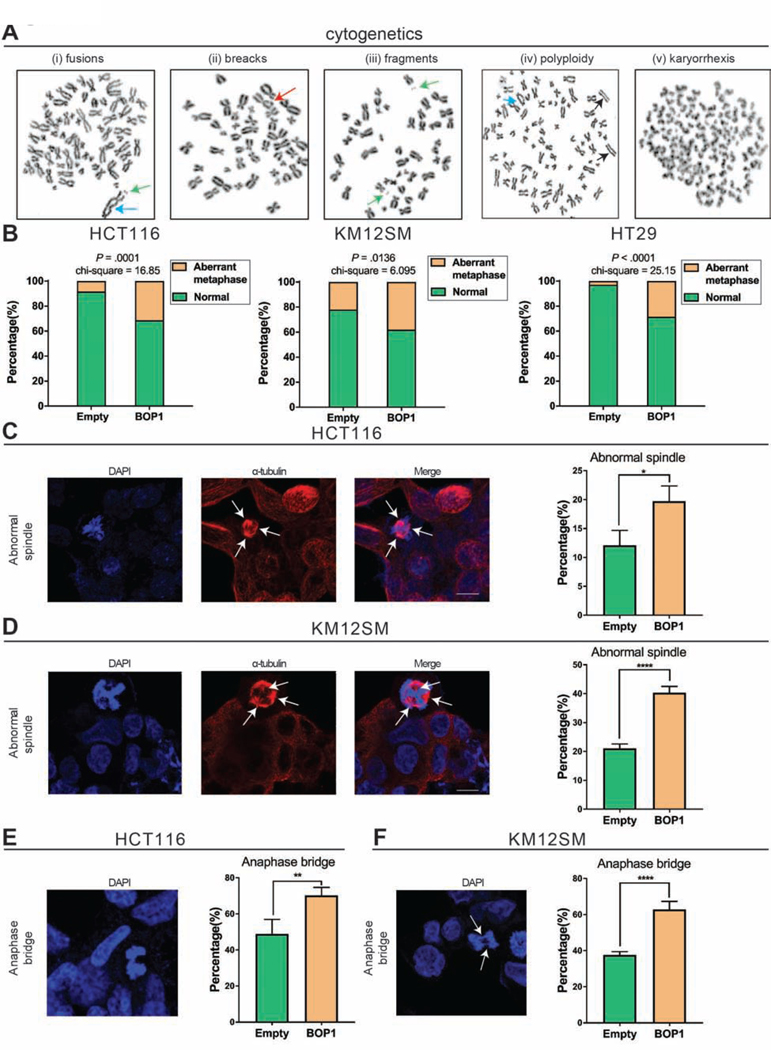
Methods: We performed cytogenetic analysis of colorectal cancer (CRC) cell lines (HCT116, KM12C/SM, and HT29) overexpressing CCAT2 and colon organoids from C57BL/6N mice with the CCAT2 transgene and without (controls). CRC cells were also analyzed by immunofluorescence microscopy, γ-H2AX, and senescence assays. CCAT2 transgene and control mice were given azoxymethane and dextran sulfate sodium to induce colon tumors. We performed gene expression array and mass spectrometry to detect downstream targets of CCAT2 lncRNA. We characterized interactions between CCAT2 with downstream proteins using MS2 pull-down, RNA immunoprecipitation, and selective 2'-hydroxyl acylation analyzed by primer extension analyses. Downstream proteins were overexpressed in CRC cells and analyzed for CIN. Gene expression levels were measured in CRC and non-tumor tissues from 5 cohorts, comprising more than 900 patients.

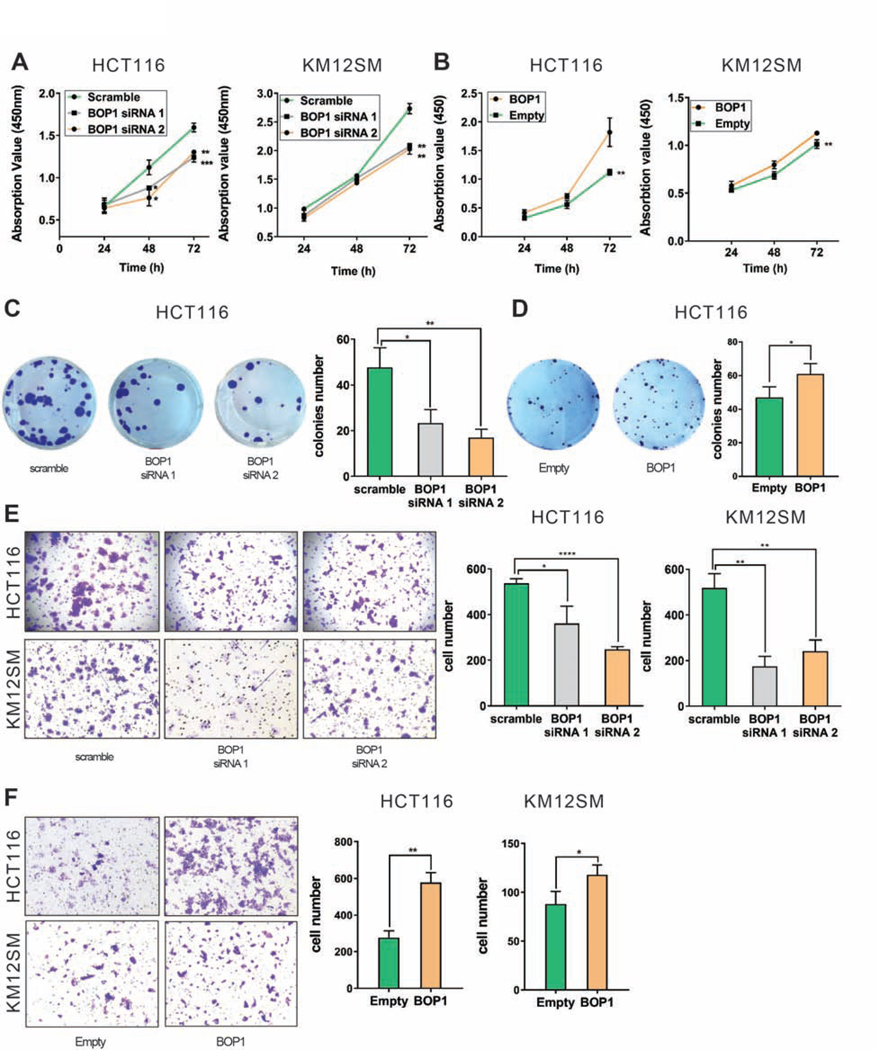
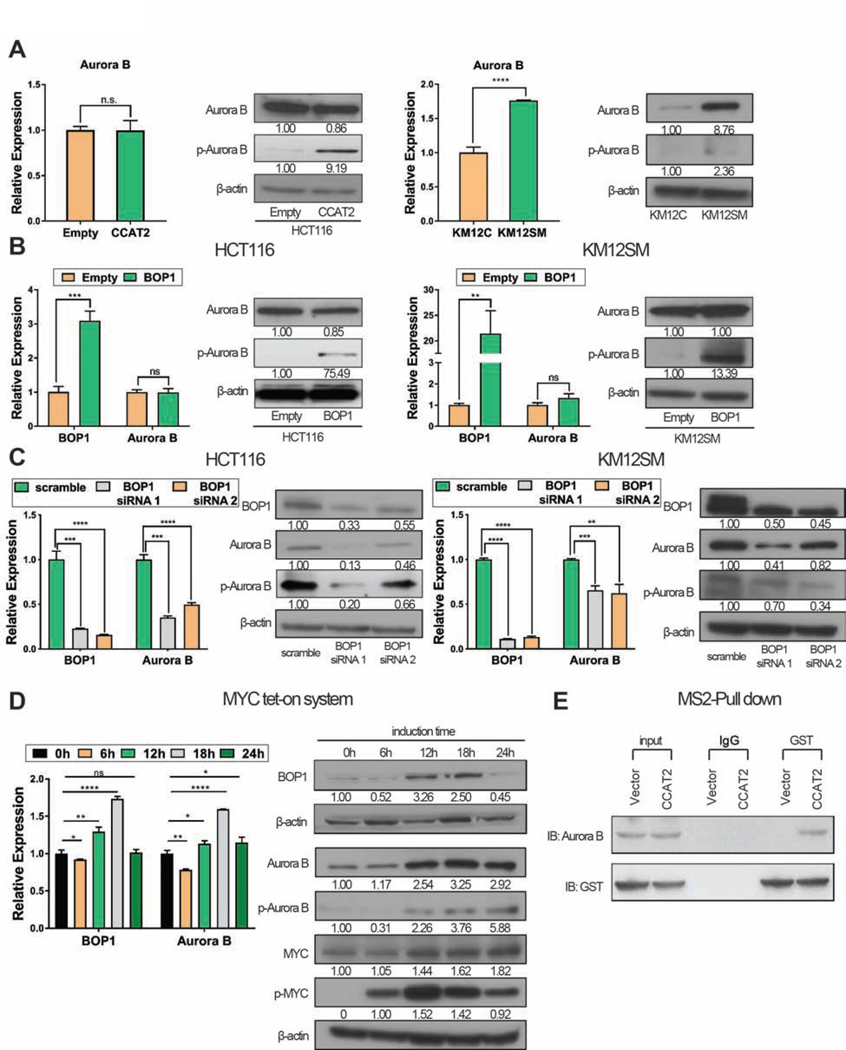
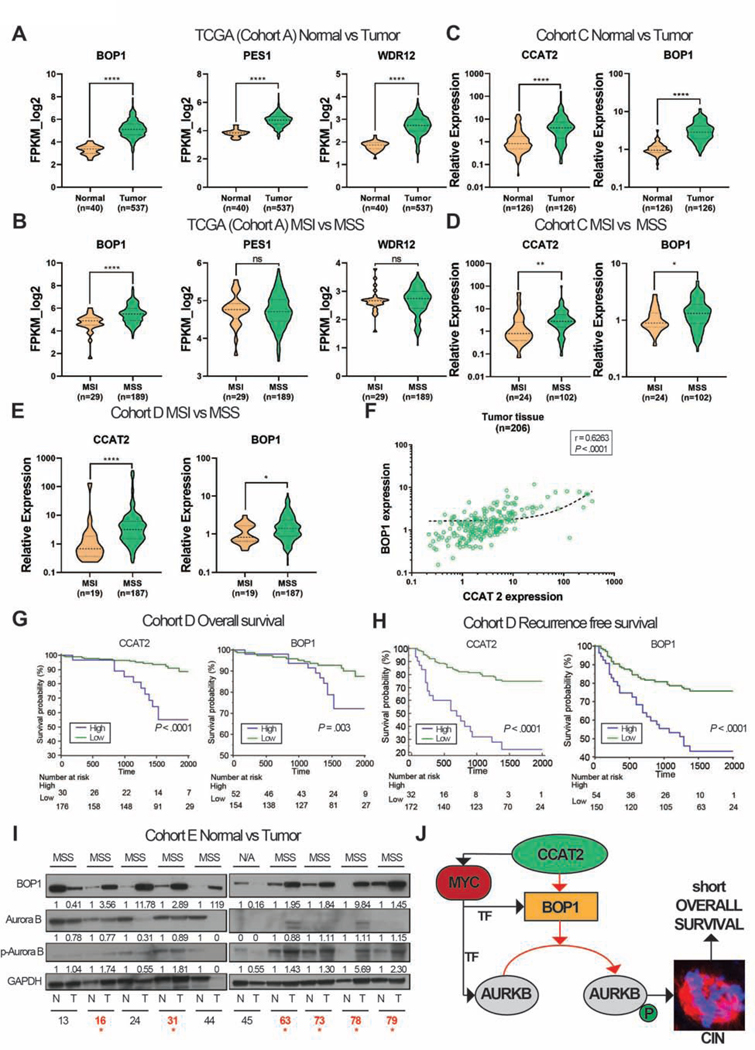
Results: High expression of CCAT2 induced CIN in CRC cell lines and increased resistance to 5-fluorouracil and oxaliplatin. Mice that expressed the CCAT2 transgene developed chromosome abnormalities, and colon organoids derived from crypt cells of these mice had a higher percentage of chromosome abnormalities compared with organoids from control mice. The transgenic mice given azoxymethane and dextran sulfate sodium developed more and larger colon polyps than control mice given these agents. Microarray analysis and mass spectrometry indicated that expression of CCAT2 increased expression of genes involved in ribosome biogenesis and protein synthesis. CCAT2 lncRNA interacted directly with and stabilized BOP1 ribosomal biogenesis factor (BOP1). CCAT2 also increased expression of MYC, which activated expression of BOP1. Overexpression of BOP1 in CRC cell lines resulted in chromosomal missegregation errors, and increased colony formation, and invasiveness, whereas BOP1 knockdown reduced viability. BOP1 promoted CIN by increasing the active form of aurora kinase B, which regulates chromosomal segregation. BOP1 was overexpressed in polyp tissues from CCAT2 transgenic mice compared with healthy tissue. CCAT2 lncRNA and BOP1 mRNA or protein were all increased in microsatellite stable tumors (characterized by CIN), but not in tumors with microsatellite instability compared with nontumor tissues. Increased levels of CCAT2 lncRNA and BOP1 mRNA correlated with each other and with shorter survival times of patients.

Conclusions: We found that overexpression of CCAT2 in colon cells promotes CIN and carcinogenesis by stabilizing and inducing expression of BOP1 an activator of aurora kinase B. Strategies to target this pathway might be developed for treatment of patients with microsatellite stable colorectal tumors.

Keywords: Aneuploidy; MSS; Noncoding RNA; Tumorigenesis.


Figures

Figure 1.
Figure 1.. CCAT2 lncRNA induces CIN and activates pathways associated with ribosomal proteins.
(A) Cytogenetic analysis showing chromosomal aberrations in HCT116CCAT2 cells (left) and KM12SM cells (right). Red arrows indicate breaks, blue arrows indicate fusions and green arrows indicate fragments. (B) The frequency of aberrant metaphases in HCT116Empty versus HCT116CCAT2 and KM12C versus KM12SM. At least 35 metaphases were analyzed for each clone. (C) Immunofluorescence images and (D) frequency of abnormal spindle (upper lane) and anaphase bridge (lower lane) in HCT116CCAT2 cells. At least 200 interphase cells were analyzed for each clone. (E) Cytogenetic analysis showing chromosomal aberrations in organoids from WT (left) and CCAT2 mice (right). Blue arrow indicates fusions. (F) The frequency of aberrant metaphases in organoids from WT versus CCAT2 mice. At least 35 metaphases were analyzed for each organoid. (G) Schematic illustration of the AOM/DSS colon cancer model. (H) Images of colon mucosa from WT and CCAT2 mice after treatment with AOM/DSS. Red delineation indicates polyps’ area. (I) Total number of polyps, total surface area of colon polyps, and average polyp diameter size in WT and CCAT2 transgenic mice at the end of the AOM/DSS treatment (n = 7 per group). (J) H&E images of the colon from WT and CCAT2 transgenic mice after treatment with AOM/DSS. Black arrows indicate polyps. (K) Largest size polyp according to H&E analysis in WT and CCAT2 transgenic mice. (L) The percentage of WT and CCAT2 transgenic mice with grade 1–2 versus grade 3–4 hyperplasia, and (M) with normal glands versus dysplastic glands. (N) IPA analysis showing significantly enriched pathways in CCAT2 transgenic mouse model (left Y axis represents negative log P values; right Y axis represents the ratio of molecules in the dataset mapping to the number of molecules in the canonical pathways) (left panel). Venn diagram showing overlapping genes related to the ribosomal proteins from the canonical pathways (right panel). Mean ± SD. (**P < .01).
Figure 2.
Figure 2.. CCAT2 lncRNA interact with BOP1.
(A) Schematic illustration of MS2-pull down assay (left panel) and immuno-blotting results of BOP1, PES1, and WDR12 (right panel). (B) RIP assay was performed to check the enrichment of CCAT2 lncRNA in COLO320. (C) In vitro RNA pull-down using GST-tagged CCAT2 lncRNA and recombinant BOP1 protein. (D) Determination of the interaction between ΔBOP1 domains and CCAT2 lncRNA by in vitro RNA pull down. (E) In vitro RNA pull-down using multiple CCAT2 lncRNA segments (S1 to S10). (F) SHAPE assay showing the structure of the CCAT2 lncRNA region from nucleotide 207 to 492. Blue arrows indicate the start and the end of segment 3. Mean ± SD. (*P < .05), (**P < .01).
Figure 3.
Figure 3.. CCAT2 lncRNA up-regulates BOP1 in vitro and in vivo.
(A) Expression of PeBoW complex components in HCT116Empty and HCT116CCAT2 (left panel), and in KM12C and KM12SM (right panel). (B) Expression of PeBoW complex components in HCT116 WT (left panel) and KM12SM (right panel) after CCAT2 knock-down. (C) The half-life of BOP1 protein in KM12SM cells with transient CCAT2 overexpression or empty vector (left panel). Data from three experiments were quantified and are depicted as a graphic (right panel). (D) The nuclear and cytoplasmic localization of PeBoW complex in HCT116Empty and HCT116CCAT2. (E) Expression of CCAT2 lncRNA and PeBoW complex components in the colon of CCAT2 mice. (F) The expression of BOP1 in normal colon tissues and colon polyps of CCAT2 mice after AOM/DSS treatment (n = 7). Mean ± SD. (ns, not significant), (*P < .05), (**P < .01); (***P < .001), (****P < .0001).
Figure 4.
Figure 4.. Overexpression of BOP1 promotes CIN.
(A) Cytogenetic analysis showing chromosomal aberrations in cells with overexpression of BOP1. In panels (i), (ii) and (iii) are representative images of HCT116BOP1, with fusion (blue arrow), break (red arrow), and fragments (green arrows). In panel (iv) is an image of KM12SMBOP1 with polyploidy and acentric chromosomes (black arrows) and fusion (blue arrow), and in panel (v) is an image of HT29BOP1 with c-anaphase morphology. (B) The frequency of cells exhibiting chromosome abnormalities in HCT116, KM12SM, and HT29 Empty versus BOP1 overexpressed clones. At least 35 metaphases were analyzed for each clone. (C, D) Images and frequencies of abnormal spindles in HCT116 (C) and KM12SM (D) with BOP1 overexpression. At least 200 interphase nuclei were analyzed for each clone. (E, F) Images and frequency of anaphase bridges in HCT116 (E) and KM12SM (F) with BOP1 overexpression. At least 200 cells were analyzed for each clone. Mean ± SD. (*P < .05), (**P < .01), (****P < .0001).
Figure 5.
Figure 5.. BOP1 plays an oncogenic role in CRC.
(A) Proliferation rate of HCT116 (left) and KM12SM (right) after siRNA knock-down of BOP1. (B) Proliferation rate of HCT116Empty and HCT116BOP1 (left) and KM12SMEmpty and KM12SMBOP1 (right). (C, D) Representative images of colony formation assay in HCT116 with BOP1 knock-down (C) and HCT116 with stable overexpression of BOP1 (D). Quantitative analysis of colony numbers (right side of panels C and D). (E) Invasion potential of HCT116 and KM12SM cells after transfection with BOP1 siRNA. Representative images of invasion assay for HCT116 (upper panel) and KM12SM (lower panel). Quantitative analysis of invading cell (right panel). (F) Invasion potential in cells with stable overexpression of BOP1. Representative images of invasion assay for HCT116 (upper panel) and KM12SM (lower panel). Quantitative analysis of invading cell (right panel). Mean ± SD. (*P < .05), (**P < .01); (***P < .001), (****P < .0001).
Figure 6.
Figure 6.. BOP1 modulates the function of AURKB.
(A) Expression of AURKB and pAURKB in HCT116Empty and HCT116CCAT2 (left panel) and KM12C and KM12SM (right panel). (B) Expression of BOP1, AURKB, and pAURKB analyzed in HCT116Empty and HCT116BOP1 (left panel) and KM12SMEmpty and KM12SMBOP1 (right panel). (C) Expression of BOP1, AURKB, and pAURKB analyzed in HCT116 (left panel) and KM12SM (right panel) after BOP1 knock-down with siRNA. (D) Expression of BOP1 and AURKB at 0, 6, 12, 18, and 24 hours in HCT116 cells with inducible c-MYC expression system. (E) MS2-pull down assay to identify if AURKB interacts with MS2-labeled CCAT2 in HCT116. Mean ± SD. (ns, not significant), (**P < .01); (***P < .001), (****P < .0001).
Figure 7.
Figure 7.. CCAT2 and BOP1 are overexpressed in MSS CRC.
(A) The expression levels of PeBoW complex in Cohort A. (B) The expression levels of the PeBoW complex in MSI and MSS primary CRC in Cohort A. (C) The expression of CCAT2 lncRNA and BOP1 mRNA in tumor and adjacent normal tissues from Cohort C. (D) The expression of CCAT2 lncRNA and BOP1 mRNA in MSI and MSS CRC from Cohort C. (E) The expression of CCAT2 lncRNA and BOP1 mRNA in MSI and MSS CRC from Cohort D. (F) Correlation between the RNA expression of CCAT2 and BOP1 in patients from Cohort D. (G) Kaplan–Meier OS curves of CRC patients from Cohort D, CCAT2 lncRNA (left panel) and BOP1 mRNA (right panel). (H) Kaplan–Meier RFS curves of CRC patients from Cohort D, of CCAT2 lncRNA (left panel) and BOP1 mRNA (right panel). Time is expressed in days. (I) Western blot analysis of BOP1, AURKB, and pAURKB protein expression in paired CRC samples (Cohort E). N=normal tissue, T=tumor tissue, N/A=not available microsatellite status. The samples in which both BOP1 and pAURKB proteins are up-regulated in tumor versus normal tissues are marked with red stars. (J) A model of CCAT2 involvement in CIN (red arrows – new interactions; black arrows – available data). Data are represented as violin plots. (ns) not significant, (*P < .05), (**P < .01); (***P < .001), (****P < .0001).

References

    1. Gordon DJ, Resio B, Pellman D. Causes and consequences of aneuploidy in cancer. Nat Rev Genet 2012;13:189–203. - PubMed
    1. Boveri M. Über Mitosen bei einseitiger Chromosomenbindung. Jenaische Zeitschrift für Naturwissenschaft 1903;37:401–443.
    1. Negrini S, Gorgoulis VG, Halazonetis TD. Genomic instability--an evolving hallmark of cancer. Nat Rev Mol Cell Biol 2010;11:220–8. - PubMed
    1. Gronroos E, Lopez-Garcia C. Tolerance of Chromosomal Instability in Cancer: Mechanisms and Therapeutic Opportunities. Cancer Res 2018;78:6529–6535. - PubMed
    1. Galimberti F, Thompson SL, Ravi S, et al. Anaphase catastrophe is a target for cancer therapy. Clin Cancer Res 2011;17:1218–22. - PMC - PubMed

Publication types

MeSH terms