

CTLA-4 immunotherapy exposes differences in immune response along with different tumor progression in colorectal cancer
- PMID: 32805718
- PMCID: PMC7467381
- DOI: 10.18632/aging.103765
CTLA-4 immunotherapy exposes differences in immune response along with different tumor progression in colorectal cancer
Abstract
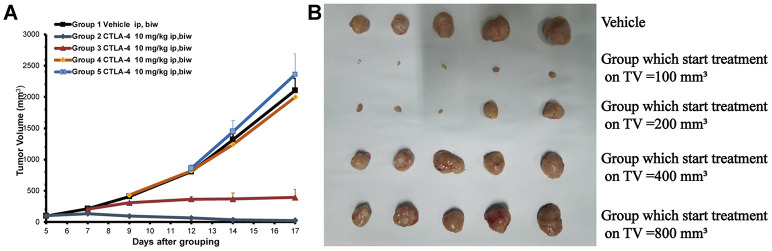
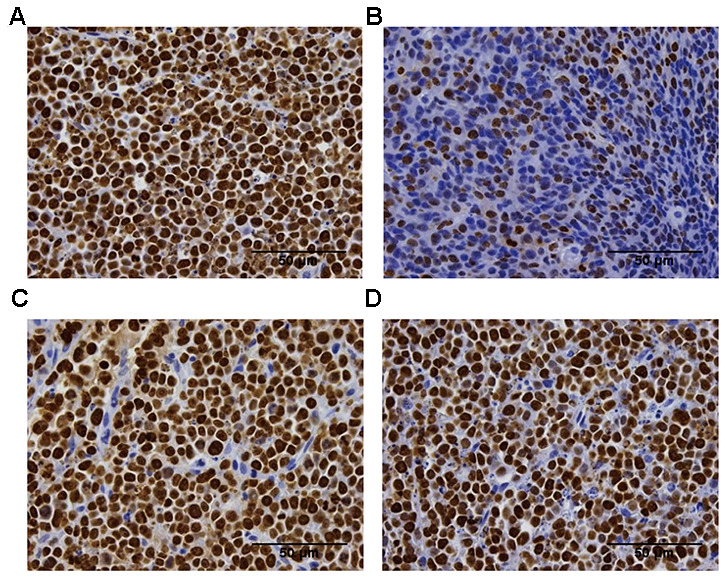
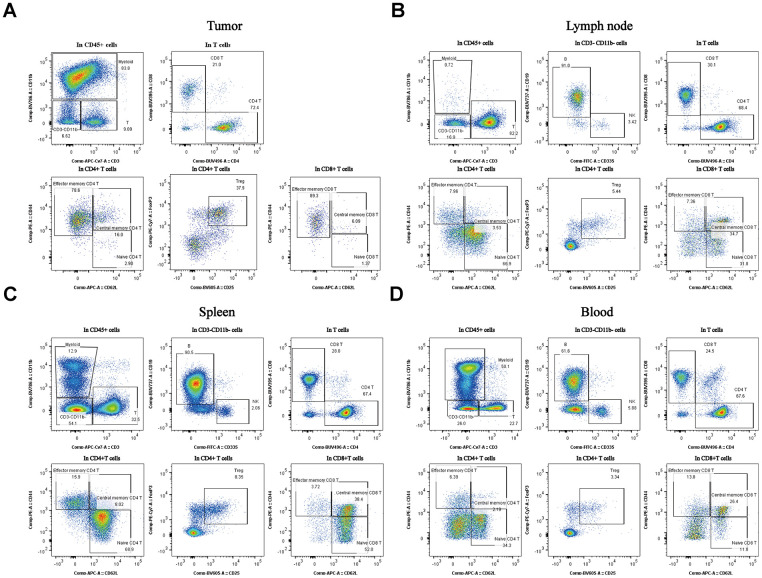
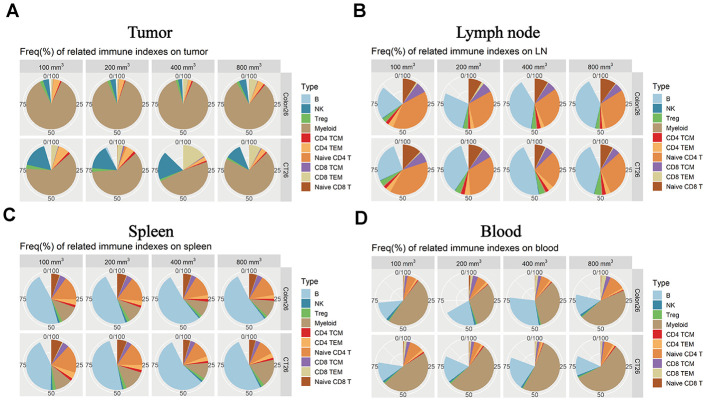
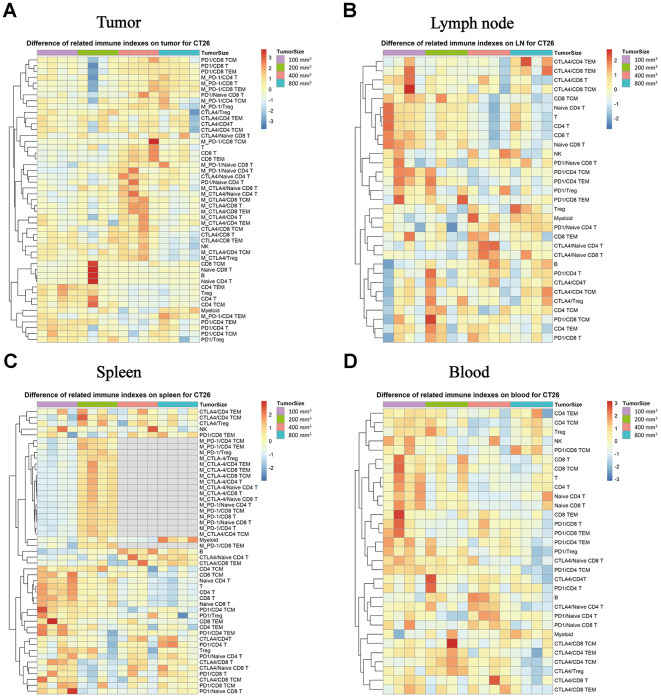
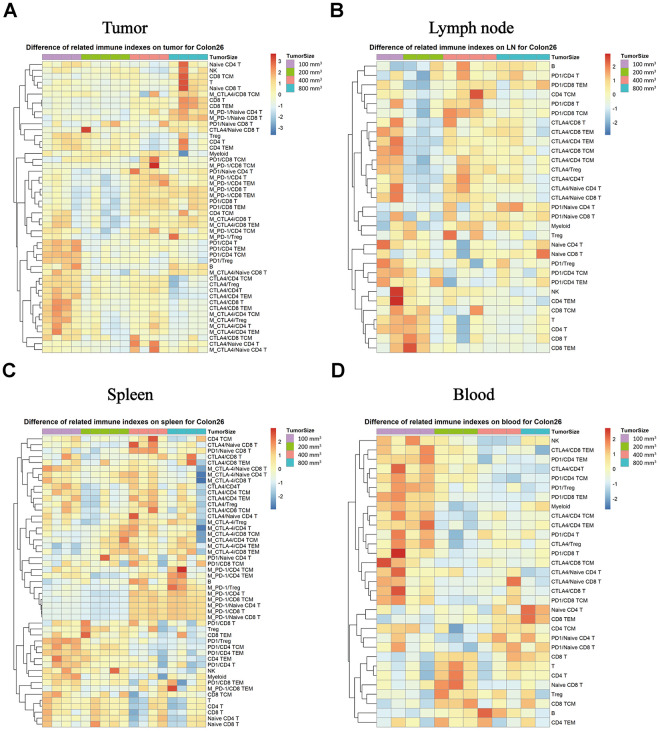
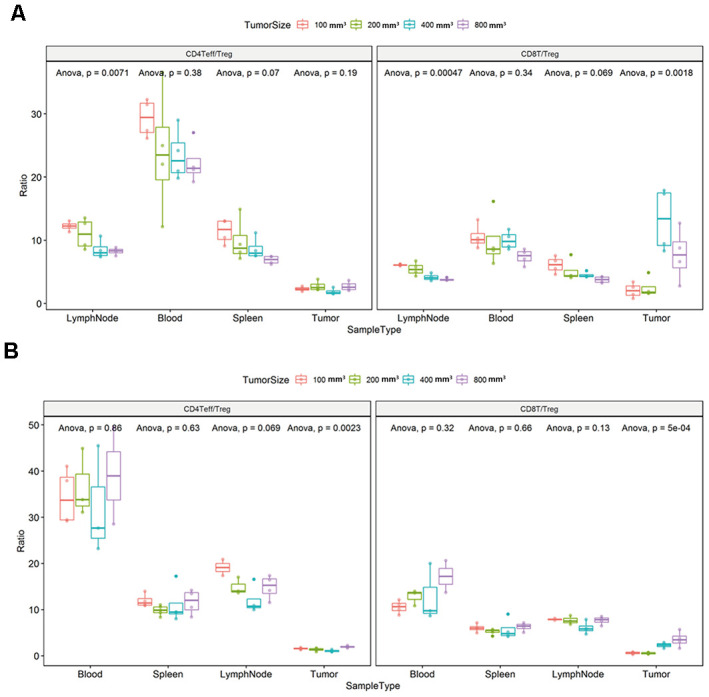
Tumor growth is accompanied by a changing tumor microenvironment and mutations that increase the resistance to therapy. Here, we used syngeneic models to evaluate the drug response of tumors of the same type of different sizes. We used the in vivo efficacy and Ki-67 immunohistochemistry (IHC) assay to assess the difference in responses in response to treatment with the same concentration of anti-CTLA-4. Flow cytometry analysis revealed changes in the immune subpopulations changes the spleen, peripheral blood, lymph node, and tumor tissue across different tumor growth phases. For example, naive CD4+T, CD4+TCM, CD8+TEM, T, B, Treg, CD8+TCM exhibited different percentages depending on the specific immune organ. To further expose the changes in the immune microenvironment, the level of expression of PD-1 and CTLA-4 showed statistically significant difference in related subsets for each four immune tissues in different tumor sizes. In addition, the ratios of CD4 + Teff/ CD4 + Treg and CD8 + T/Treg in corresponding immune tissue were also associated with statistically significant differences alongside tumor growth in different animal models. These results reveal the ongoing changes in the immune microenvironment during tumor progression and anti-CTLA-4 antibody immunotherapy effect depends on the expression level of immune factors.
Keywords: CTLA-4; central memory T cell (TCM); effector memory T cell (TEM); tumor-immune microenvironment.
Conflict of interest statement
Figures
Similar articles
-
Differential control of human Treg and effector T cells in tumor immunity by Fc-engineered anti-CTLA-4 antibody.Proc Natl Acad Sci U S A. 2019 Jan 8;116(2):609-618. doi: 10.1073/pnas.1812186116. Epub 2018 Dec 26. Proc Natl Acad Sci U S A. 2019. PMID: 30587582 Free PMC article.
-
Oncolytic virus expressing PD-1 inhibitors activates a collaborative intratumoral immune response to control tumor and synergizes with CTLA-4 or TIM-3 blockade.J Immunother Cancer. 2022 Jun;10(6):e004762. doi: 10.1136/jitc-2022-004762. J Immunother Cancer. 2022. PMID: 35688558 Free PMC article.
-
Targeting interferon signaling and CTLA-4 enhance the therapeutic efficacy of anti-PD-1 immunotherapy in preclinical model of HPV+ oral cancer.J Immunother Cancer. 2019 Sep 18;7(1):252. doi: 10.1186/s40425-019-0728-4. J Immunother Cancer. 2019. PMID: 31533840 Free PMC article.
-
At the bench: preclinical rationale for CTLA-4 and PD-1 blockade as cancer immunotherapy.J Leukoc Biol. 2013 Jul;94(1):25-39. doi: 10.1189/jlb.1212621. Epub 2013 Apr 26. J Leukoc Biol. 2013. PMID: 23625198 Free PMC article. Review.
-
Treg-mediated acquired resistance to immune checkpoint inhibitors.Cancer Lett. 2019 Aug 10;457:168-179. doi: 10.1016/j.canlet.2019.05.003. Epub 2019 May 9. Cancer Lett. 2019. PMID: 31078738 Review.
Cited by
-
Recent Advances in Monoclonal Antibody Therapy for Colorectal Cancers.Biomedicines. 2021 Jan 5;9(1):39. doi: 10.3390/biomedicines9010039. Biomedicines. 2021. PMID: 33466394 Free PMC article. Review.
-
Differential Gene Expression of Checkpoint Markers and Cancer Markers in Mouse Models of Spontaneous Chronic Colitis.Cancers (Basel). 2023 Sep 29;15(19):4793. doi: 10.3390/cancers15194793. Cancers (Basel). 2023. PMID: 37835487 Free PMC article.
-
Acquired resistance for immune checkpoint inhibitors in cancer immunotherapy: challenges and prospects.Aging (Albany NY). 2022 Jan 17;14(2):1048-1064. doi: 10.18632/aging.203833. Epub 2022 Jan 17. Aging (Albany NY). 2022. PMID: 35037899 Free PMC article. Review.
-
Identification of VISTA regulators in macrophages mediating cancer cell survival.Sci Adv. 2024 Nov 29;10(48):eadq8122. doi: 10.1126/sciadv.adq8122. Epub 2024 Nov 27. Sci Adv. 2024. PMID: 39602545 Free PMC article.
-
The exploration of mitochondrial-related features helps to reveal the prognosis and immunotherapy methods of colorectal cancer.Cancer Rep (Hoboken). 2024 Jan;7(1):e1914. doi: 10.1002/cnr2.1914. Epub 2023 Oct 30. Cancer Rep (Hoboken). 2024. PMID: 37903487 Free PMC article.
References
-
- Takada T, Kato K, Yagita H, Hamada H, Okumura K. Effects of immunization with tumor cells double transfected with interleukin-2 (IL-2) and interleukin-12 (IL-12) genes on artificial metastasis of colon26 cells in BALB/c mice. Clin Exp Metastasis. 1999; 17:125–30. 10.1023/a:1006569317551 - DOI - PubMed
-
- Fang WM, Chen C. Progress in Research on Cytotoxic T Lymphocyte-Associated Antigen 4 (CTLA-4) and Bladder Cancer. Annals of Urologic Oncology. 2019:1–7. 10.32948/auo.2019.01.22 - DOI
Publication types
MeSH terms
Substances
LinkOut - more resources
Full Text Sources
Medical
Research Materials
