. 2020 Dec;588(7838):498-502.
doi: 10.1038/s41586-020-2665-2. Epub 2020 Aug 17.

Structures and distributions of SARS-CoV-2 spike proteins on intact virions

Affiliations

Structures and distributions of SARS-CoV-2 spike proteins on intact virions

Zunlong Ke et al. Nature. 2020 Dec.

Abstract

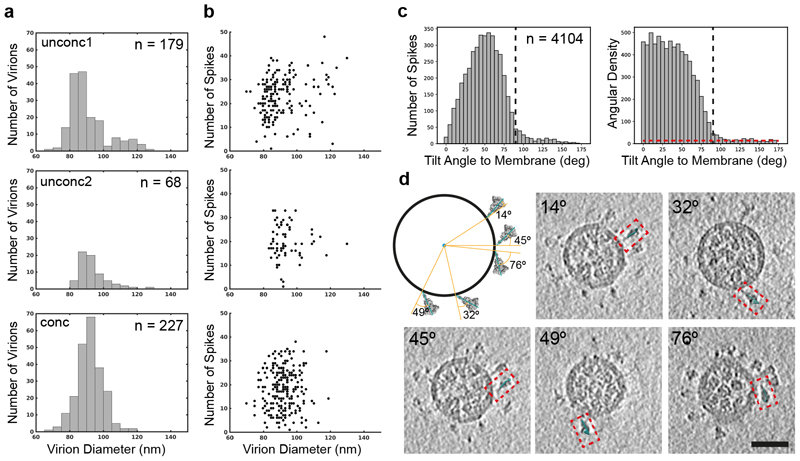
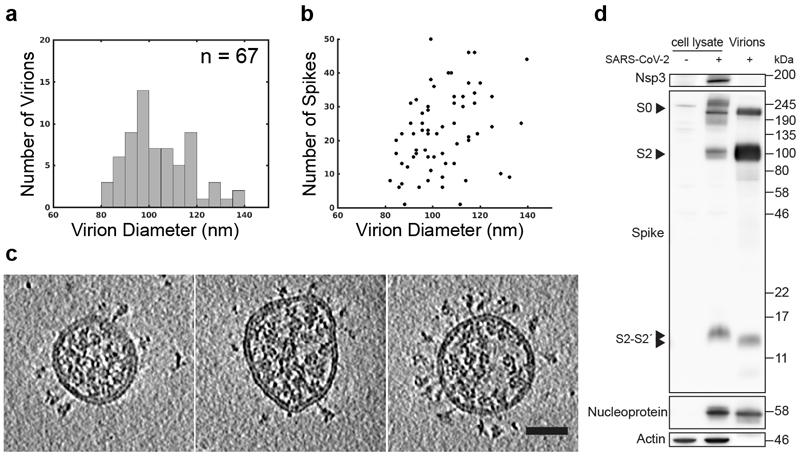
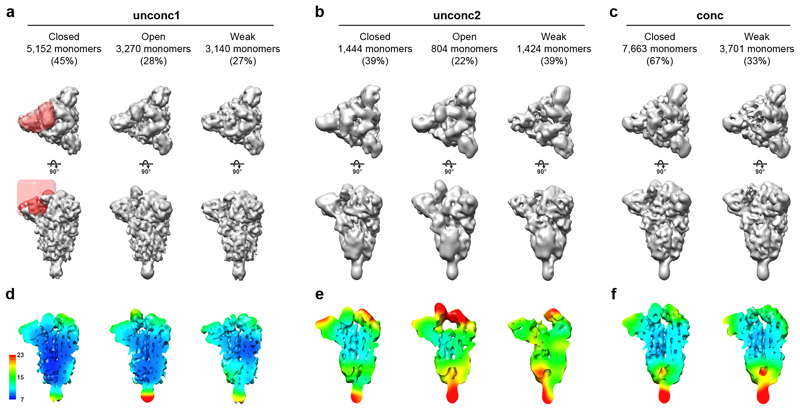
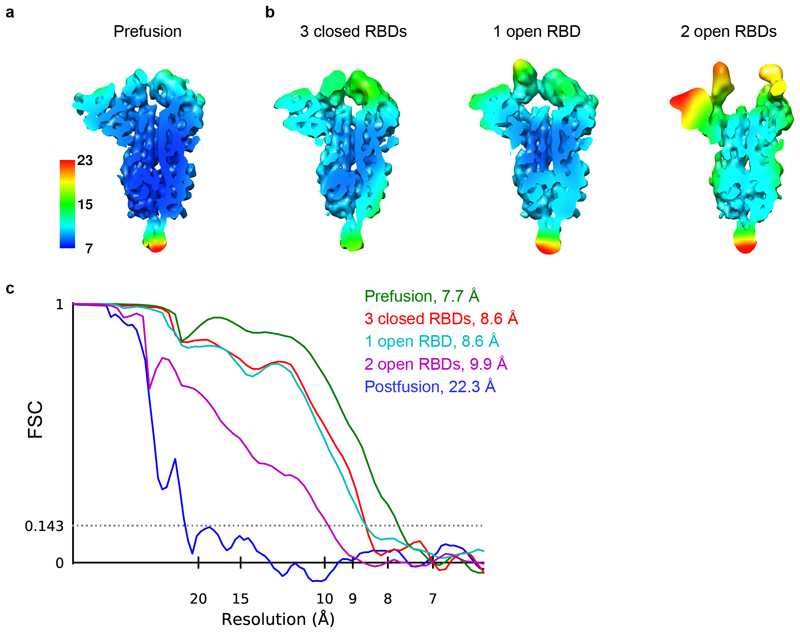
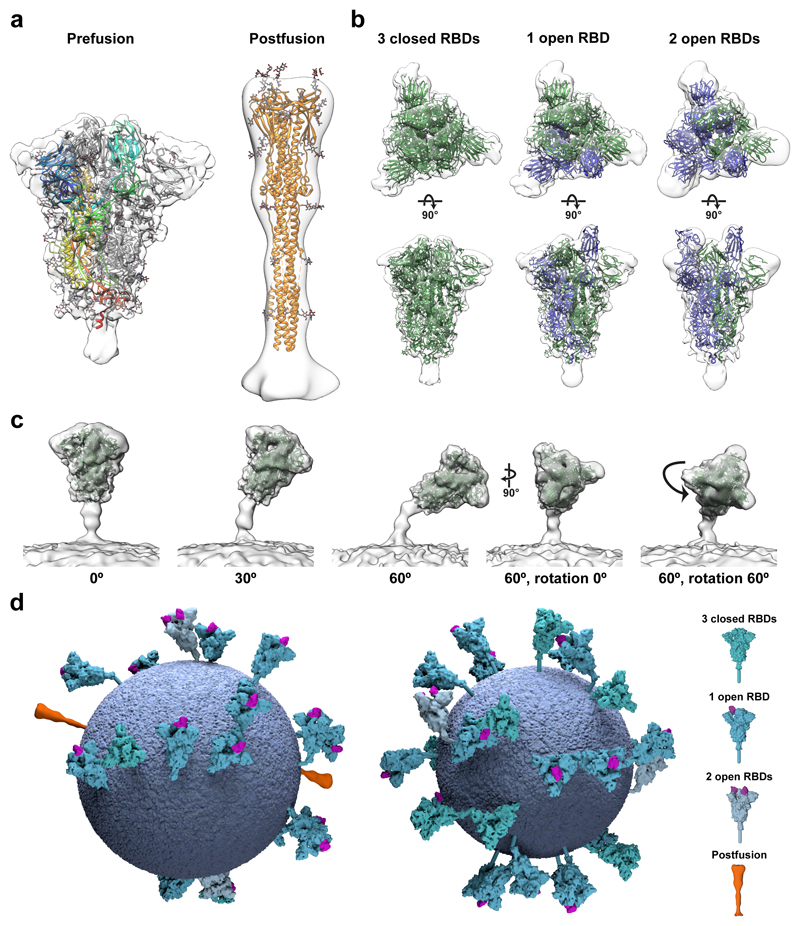
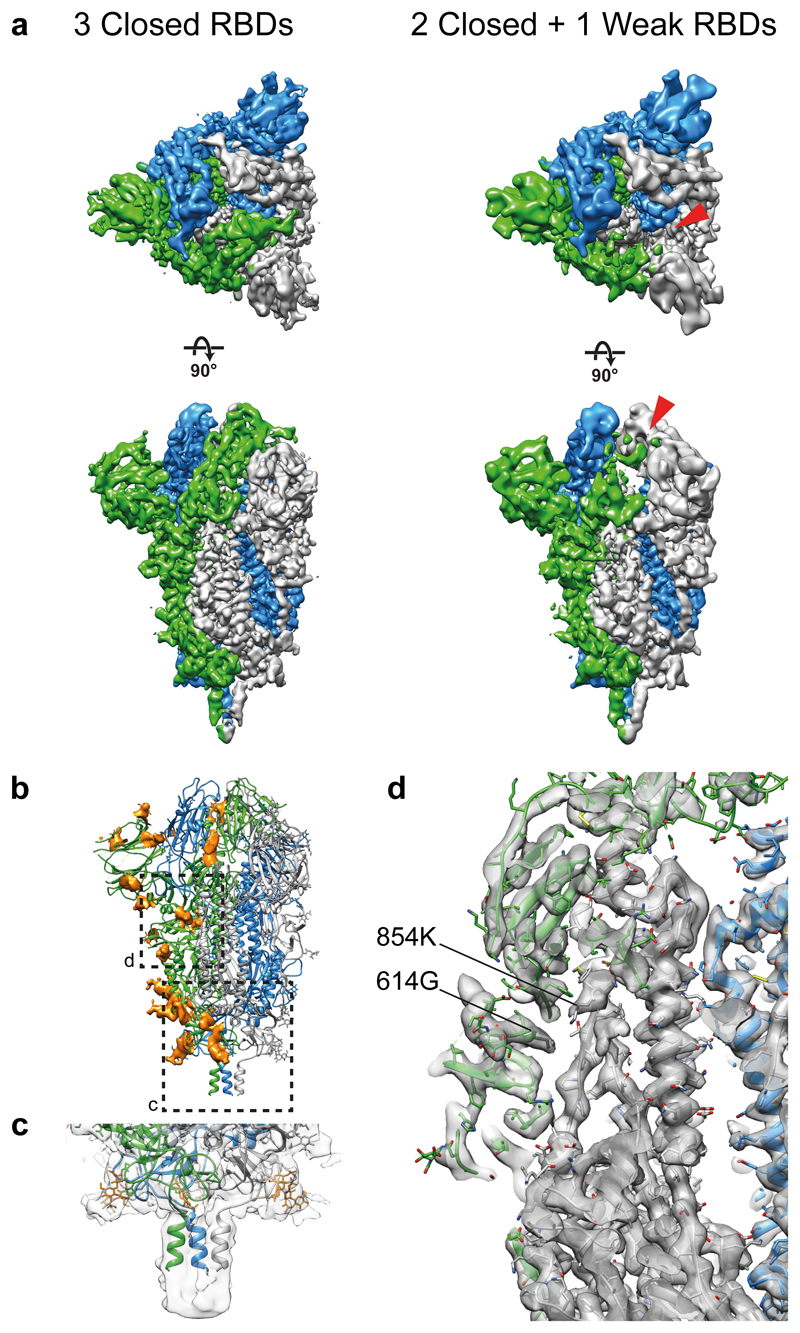
Severe acute respiratory syndrome coronavirus 2 (SARS-CoV-2) virions are surrounded by a lipid bilayer from which spike (S) protein trimers protrude1. Heavily glycosylated S trimers bind to the angiotensin-converting enzyme 2 receptor and mediate entry of virions into target cells2-6. S exhibits extensive conformational flexibility: it modulates exposure of its receptor-binding site and subsequently undergoes complete structural rearrangement to drive fusion of viral and cellular membranes2,7,8. The structures and conformations of soluble, overexpressed, purified S proteins have been studied in detail using cryo-electron microscopy2,7,9-12, but the structure and distribution of S on the virion surface remain unknown. Here we applied cryo-electron microscopy and tomography to image intact SARS-CoV-2 virions and determine the high-resolution structure, conformational flexibility and distribution of S trimers in situ on the virion surface. These results reveal the conformations of S on the virion, and provide a basis from which to understand interactions between S and neutralizing antibodies during infection or vaccination.


Conflict of interest statement

Competing interests: The authors have no competing interests.

Figures

Extended Data Fig. 1
Extended Data Fig. 1. Characterization of SARS-CoV-2 virion morphology.
(a) Histogram of virion diameters for unconcentrated extracellular virions in the supernatant of two independent preparations (top and middle), and for extracellular virions after concentration through a sucrose cushion (bottom). After concentration the virions become less spherical. Mean and standard deviation for diameters are 91 ± 11 nm (n=179), 94 ± 9 nm (n=68) and 92 ± 8 nm (n=227) for the three preparations. (b) Scatter plot of number of spikes identified per virion during subtomogram averaging against virion diameter for the same virions shown in panel (a). Visual inspection indicates that almost all spikes were identified for virions in the supernatant, but that not all spikes are identified in the concentrated preparation leading to an underestimate of the number of spikes. (c) Histogram of spike tilt angle towards the membrane for the larger supernatant virus dataset (unconc1). The vertical black dashed line indicates 90°. 97% of particles have tilts below 90°; particles with tilts above 90° were not included in image analysis. The angular density (right) is calculated by dividing the number of spikes by the sine of the determined angle. If spikes were unconstrained in tilt, this distribution would be uniform. The angular density decreases from ~50°, indicating that higher tilts are disfavoured. The horizontal red dashed line indicates the angular distribution of noise (spikes which have failed to align), estimated based on the angular density between 140° and 180°. (d) Schematic diagram and examples of individual tilted spikes on virions. The schematic indicates the angle that was measured. Five examples of individual tilted spikes are marked on tomographic slices through an intact virion, with their associated angle. Scale bar 50 nm.
Extended Data Fig. 2
Extended Data Fig. 2. Morphology of SARS-CoV-2 virions released from infected Calu-3 cells.
As in Extended Data Fig. 1, (a) Histogram of virion diameters. Mean and standard deviation for diameters are 104 ± 13 nm (n=67). (b) Scatter plot of number of spikes identified per virion during subtomogram averaging against virion diameter for the same virions shown in panel a. (c) central slices through three representative viruses from 67 imaged in one experiment. Virions from Calu-3 cells had a slightly broader diameter distribution than those from VeroE6 cells. Scale bar 50 nm. (d) Western blot analysis of SARS-CoV-2 nsp3, S and N in cell lysates and in virus preparations. In released virions, S is present in both cleaved (S2, 73%) and uncleaved forms (S0, 27%).
Extended Data Fig. 3
Extended Data Fig. 3. Classification of SARS-CoV-2 spike RBDs.
(a) Class averages obtained after focussed classification on the RBD of the left monomer after symmetry expansion of the unconc1 dataset. Top views and side views are shown for closed, open and weak classes. The region subjected to classification is indicated by a transparent red mask surface in the left hand panel. (b) Equivalent analysis for a smaller, independent dataset (unconc2). (c) Equivalent analysis for a dataset obtained after concentrating virus through a sucrose cushion (conc). Only closed and weak classes were obtained. (d-f) Cut-open local resolution maps for structures shown in (a-c).
Extended Data Fig. 4
Extended Data Fig. 4. Resolution assessment of subtomogram averaging structures.
(a) Local resolution map for the consensus structure obtained for the prefusion S trimers. (b) Local resolution maps for the prefusion S trimer in three different conformations. (c) Global resolution assessment by Fourier shell correlation (FSC) at the 0.143 criterion for the four structures shown in a and b, as well as the postfusion S trimer.
Extended Data Fig. 5
Extended Data Fig. 5. Single particle cryo-EM image processing workflow.
Automatically picked particles (green circles) were subjected to 3D classification. Scale bar 100 nm. Selected 3D classes are indicated by black boxes. RBDs from individual asymmetric units from the S trimer (red dashed circles) were locally classified to sort different conformations of RBD. The asymmetric unit subjected to local classification is shown in a top view, the RDB of the green monomer is weak in the right-hand class (red arrowhead). S trimers with all three RBDs in the closed state were further refined with C3 symmetry. S trimers where one RBD had weak density were refined with C1 symmetry. For further details see materials and methods.
Extended Data Fig. 6
Extended Data Fig. 6. Single particle Cryo-EM structure validation.
(a) Cut-open cryo-EM maps obtained using all prefusion S trimers, S trimers with 3 closed RBDs or S trimers with 2 closed and 1 weak RBDs, coloured according to the local resolution. (b) FSC curves for the three structures in (a), and for the atomic model against the map.
Extended Data Fig. 7
Extended Data Fig. 7. Structural comparison of in situ structure with recombinant soluble structure.
Structural superposition of S trimer modelled into the structure of the trimer with three closed RBDs (green, this study) with the published structure of recombinant, soluble closed trimer (blue, PDB 6VXX). Top and side views are shown. The structures are very similar.
Fig .1
Fig .1. Characterization of virus production and images of SARS-CoV-2 virions.
(a) Western blot analysis of SARS-CoV-2 nsp3, S and N in lysates of VeroE6 cells and in virus preparations, representative of 3 experiments. In released virions, S is present in both cleaved and uncleaved forms. The positions of S0, S2 and the S2-S2’ cleavage product are marked. (b) Four representative tomographic slices of SARS-CoV-2 virions from the supernatant of infected cells. Virions are approximately spherical, contain granular density corresponding to N-packaged genome, and have S trimers protruding at variable angles from their surfaces. Scale bar 50 nm. (c) Three example S trimers from the dataset shown as projections through the trimer to illustrate variable tilt towards the membrane. Scale bar 10 nm.
Fig. 2
Fig. 2. Structural analysis of SARS-CoV-2 S trimers on intact virions.
(a) Structures of the prefusion (left) and postfusion (right) trimer from intact virions determined by subtomogram averaging. Structures are shown as transparent grey isosurfaces fitted with structures of the closed, prefusion trimer (PDB 6VXX) and the postfusion trimer (PDB 6XRA). One prefusion monomer is colored from blue (N terminus) to red (C terminus). The N-terminal domain is blue, the RBD appears cyan. The NTD does not fully occupy the EM density because some loops are not resolved or built in PDB 6VXX. (b) Three conformations of the prefusion trimer observed on intact virions: all RBDs in the closed position (left, fitted with PDB 6VXX); one RBD in the open position (center, fitted with PDB 6VYB); two RBDs in the open position (right, fitted with PDB 6X2B which lacks modelled glycans). The two-open conformation has only been observed in vitro after inserting multiple stabilizing mutations. S monomers with closed RBDs are green, and with open RBDs are blue. (c) Averaging of subsets of trimers grouped according to their orientation relative to the membrane shows flexibility in the stalk region. Examples are shown for pools centered at 0°, 30° and 60° from the perpendicular, and for two rotations of the trimer relative to the tilt direction. (d) 3D models of two individual SARS-CoV-2 virions with a membrane (blue) of the measured radius, and all spike proteins shown in the conformations, positions and orientations determined by subtomogram averaging. Different S conformations are distributed over the virion surface and can be tilted by up to ~90° relative to the membrane (Extended Data Fig. 1c,d).
Fig. 3
Fig. 3. Structures of SARS-CoV-2 S trimers on intact virions by single particle reconstruction.
(a) Top and side views of trimers with three closed RBDs (left, 3.5 Å resolution) and one weaker RBD (right, 4.1 Å resolution). Compare the left and right panels to see the weaker density for the RBD from the green monomer in the region indicated by the red arrowheads. Individual monomers are coloured white, blue and green. (B) Glycosylation profile of the S protein. Colour scheme as in (a), glycans are shown in orange. Boxes indicates the regions shown in c and d. (c) Close up of the base of the trimer at lower isosurface threshold to highlight the glycan ring and the extended C-terminal density. (d) Close up of the region of the spike where the D614G variation abolishes a salt bridge to 854K.

Comment in

References

    1. Neuman BW, Buchmeier MJ. Supramolecular Architecture of the Coronavirus Particle. Advances in Virus Research. 2016;96:1–27. - PMC - PubMed
    1. Walls AC, et al. Structure, Function, and Antigenicity of the SARS-CoV-2 Spike Glycoprotein. Cell. 2020;181:281–292.e6. - PMC - PubMed
    1. Hoffmann M, et al. SARS-CoV-2 Cell Entry Depends on ACE2 and TMPRSS2 and Is Blocked by a Clinically Proven Protease Inhibitor. Cell. 2020;181:271–280.e8. - PMC - PubMed
    1. Shang J, et al. Structural basis of receptor recognition by SARS-CoV-2. Nature. 2020;581:221–224. - PMC - PubMed
    1. Wang Q, et al. Structural and Functional Basis of SARS-CoV-2 Entry by Using Human ACE2. Cell. 2020;181:894–904.e9. - PMC - PubMed

Publication types

MeSH terms

Substances