. 2020 Aug 12;12(8):515.
doi: 10.3390/toxins12080515.

The Influence of NaCl and Glucose Content on Growth and Ochratoxin A Production by Aspergillus ochraceus, Aspergillus carbonarius and Penicillium nordicum

Affiliations

The Influence of NaCl and Glucose Content on Growth and Ochratoxin A Production by Aspergillus ochraceus, Aspergillus carbonarius and Penicillium nordicum

Yan Wang et al. Toxins (Basel). .

Abstract

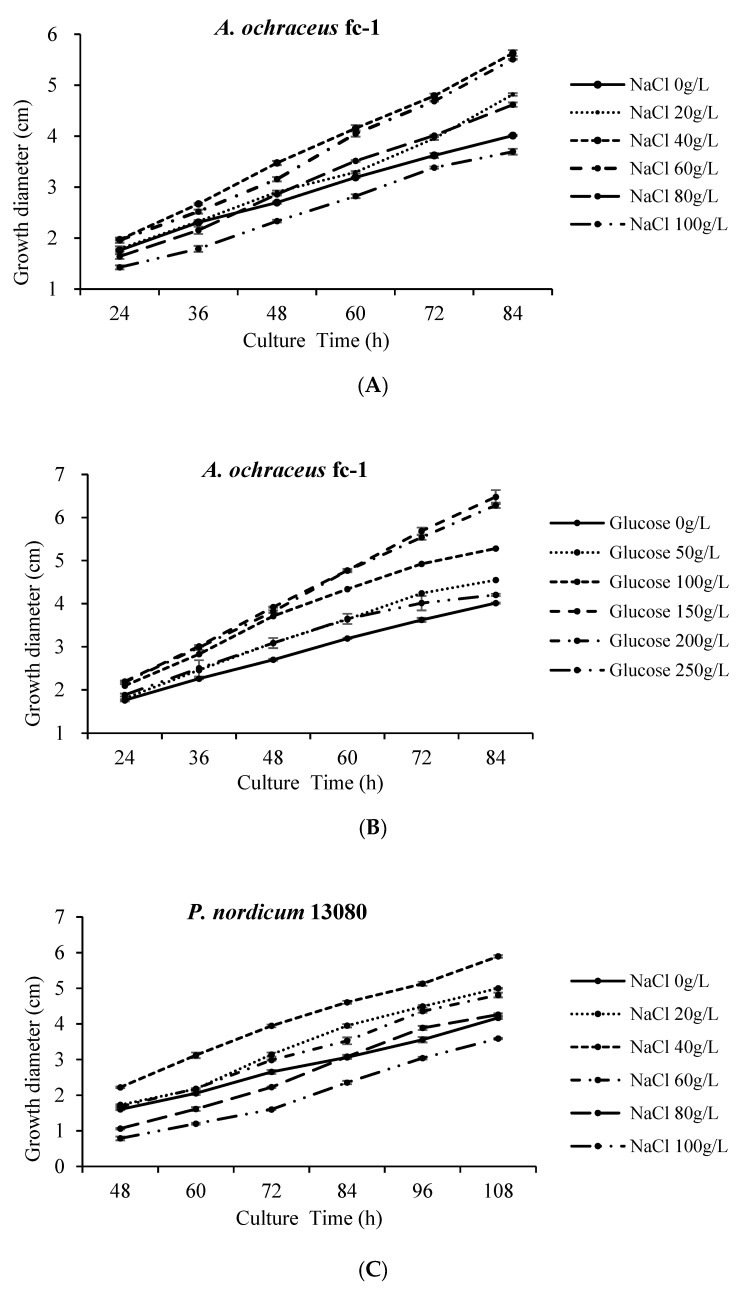
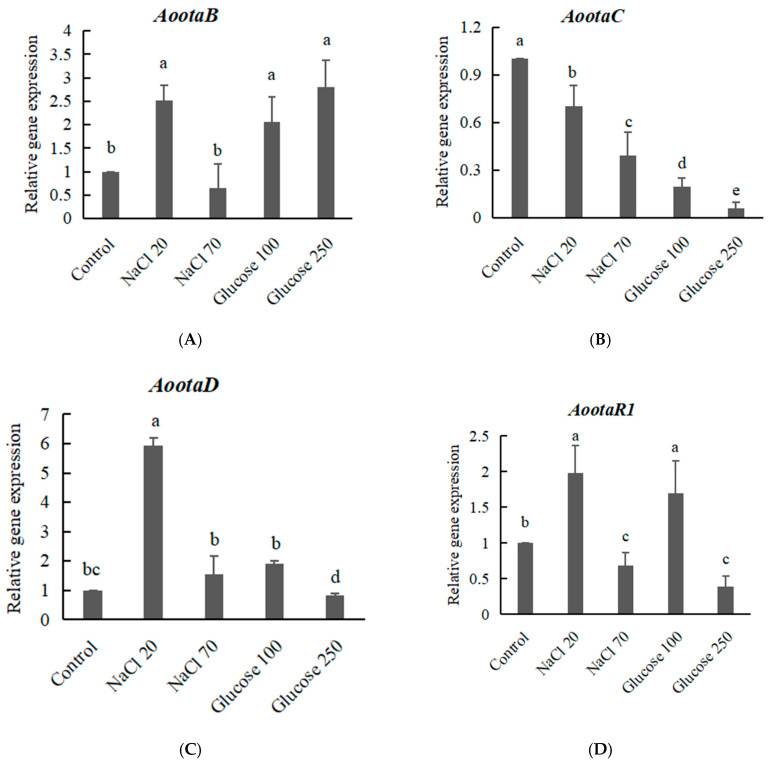
Ochratoxin A (OTA) is a nephrotoxic mycotoxin, which deserves particular attention for its widespread contamination of a variety of food and feed. Aspergillus ochraceus, Aspergillus carbonarius, and Penicillium nordicum are an important source of OTA in three different kinds of food commodities, including cereals, grape and dried fruit products, and dry-cured meat products. Deeper knowledge of OTA production and mycelium growth related to the high-sugar or NaCl-rich environments was gained in this manuscript. A. ochraceus and P. nordicum were likely to have greater growth rates in medium supplied with certain concentrations of NaCl (0-80 g/L), and the colony diameter was the largest at the salt content of 40 g/L. P. nordicum was more suitable to grow in NaCl-riched medium, the OTA production was increased to 316 ppb from 77 ppb when 20 g/L NaCl was added. The capability of OTA production was inhibited when salt content was 40 g/L and 60 g/L in A. ochraceus and P. nordicum, respectively. As the glucose content increased to 250 g/L, the capacity of mycelium growth and sporulation was increased significantly in A. ochraceus and A. carbonarius. A. carbonarius was more suitable to grow in high-sugar grape products. OTA production was significantly promoted with an added 100 g/L glucose in A. carbonarius. OTA production was inhibited when glucose content was 150 g/L and in 200 g/L in A. ochraceus and A. carbonarius, respectively. NaCl and glucose have an effect on fungal growth and OTA production, and the activation of biosynthetic genes of OtaA. These results would allow designing new strategies to prevent OTA accumulation on sugar or NaCl-riched foodstuffs and achieve the objective to manufacture cereals, dried vine fruits and dry-cured ham, free of OTA.

Keywords: A. carbonarius; A. ochraceus; NaCl-riched; P. nordicum; high-sugar; ochratoxin A.


Conflict of interest statement

The authors declare no competing financial interest.

Figures

Figure 1
Figure 1
The colony of A. ochraceus fc-1, A. carbonarius 5010, P. nordicum 13080 after 4 days of incubation at 28 °C: (A) Colonies of A. ochraceus fc-1 grown on 0, 20, 40, 60, 80, 100 g/L NaCl-supplemented Potato Dextrose Agar (PDA) plates. Colonies of P. nordicum 13080 grown on NaCl-supplemented Malt Extract Agar (MEA) plates. (B) Colonies of A. ochraceus fc-1 grown on 0, 50, 100, 150, 200, 250 g/L glucose-supplemented PDA plates. Colonies of A. carbonarius 5010 grown on glucose-supplemented Yeast Extract Sucrose Agar (YES) plates.
Figure 2
Figure 2
The colony diameter of A. ochraceus fc-1, A. carbonarius 5010, P. nordicum 13080 after 4 days of incubation at 28 °C: (A) The colony diameter of A. ochraceus fc-1grown on NaCl-supplemented PDA plates at different culture times; (B) The colony diameter of A. ochraceus fc-1grown on glucose-supplemented PDA plates at different culture times; (C) The colony diameter of P. nordicum 13080 grown on NaCl-supplemented MEA plates at different culture times; (D) The colony diameter of A. carbonarius 5010 grown on glucose-supplemented YES plates at different culture times.
Figure 2
Figure 2
The colony diameter of A. ochraceus fc-1, A. carbonarius 5010, P. nordicum 13080 after 4 days of incubation at 28 °C: (A) The colony diameter of A. ochraceus fc-1grown on NaCl-supplemented PDA plates at different culture times; (B) The colony diameter of A. ochraceus fc-1grown on glucose-supplemented PDA plates at different culture times; (C) The colony diameter of P. nordicum 13080 grown on NaCl-supplemented MEA plates at different culture times; (D) The colony diameter of A. carbonarius 5010 grown on glucose-supplemented YES plates at different culture times.
Figure 3
Figure 3
Spore production of A. ochraceus fc-1, A. carbonarius 5010 and P. nordicum 13080. (A) Spores were collected from A. ochraceus fc-1grown on 0, 20, 40, 60, 80, 100 g/L NaCl-supplemented PDA plates; (B) Spores were collected from A. ochraceus fc-1grown on 0, 50, 100, 150, 200, 250 g/L glucose-supplemented PDA plates; (C) Spores were collected from P. nordicum 13080 grown on NaCl-supplemented MEA plates; (D) Spores were collected from A. carbonarius 5010 grown on glucose-supplemented YES plates. Different letters indicate a significant difference between the corresponding values (p < 0.05).
Figure 4
Figure 4
The Ochratoxin A (OTA) production of A. ochraceus fc-1, A. carbonarius 5010 and P. nordicum 13080 after 5 days of incubation. (A) The OTA production of A. ochraceus fc-1grown on NaCl-supplemented PDA plates; (B) The OTA production of A. ochraceus fc-1grown on glucose-supplemented PDA plates; (C) The OTA production of P. nordicum 13080 grown on NaCl-supplemented MEA plates; (D) The OTA production of A. carbonarius 5010 grown on glucose-supplemented YES plates. Different letters indicate a significant difference between the corresponding values (p < 0.05).
Figure 5
Figure 5
The relative expression level of OTA biosynthetic genes AootaA in A. ochraceus fc-1, AcotaA in A. carbonarius 5010 and PnotaA in P. nordicum 13080 at high osmotic conditions after 5 days of incubation. (A) The relative expression level of otaA on NaCl-supplemented medium; (B) The relative expression level of otaA on glucose-supplemented medium. Different letters indicate a significant difference between the corresponding values (p < 0.05).
Figure 6
Figure 6
The relative expression level of OTA biosynthetic genes AootaB (A), AootaC (B) and AootaD (C), and regulatory gene AootaR1 (D) in A. ochraceus fc-1 at high osmotic conditions after 5 days of incubation. Different letters indicate a significant difference between the corresponding values (p < 0.05).

Similar articles

Cited by

References

    1. Ostry V., Malir F., Ruprich J. Producers and important dietary sources of ochratoxin A and citrinin. Toxins. 2013;5:1574–1586. doi: 10.3390/toxins5091574. - DOI - PMC - PubMed
    1. Wang Y., Wang L., Liu F., Wang Q., Selvaraj J.N., Xing F., Zhao Y., Liu Y. Ochratoxin A producing fungi, biosynthetic pathway and regulatory mechanisms. Toxins. 2016;8:83. doi: 10.3390/toxins8030083. - DOI - PMC - PubMed
    1. Zhao T., Shen X.L., Chen W., Liao X., Yang J., Wang Y., Zou Y., Fang C. Advances in research of nephrotoxicity and toxic antagonism of Ochratoxin A. Toxin Rev. 2017;36:39–44. doi: 10.1080/15569543.2016.1243560. - DOI
    1. Northolt M.D., Van Egmond H.P., Paulsch W.E. Ochratoxin A production by some fungal species in relation to water activity and temperature. J. Food Protect. 1979;42:485–490. doi: 10.4315/0362-028X-42.6.485. - DOI - PubMed
    1. Ramos A.J., Labernia N., Marín S., Sanchis V., Magan N. Effect of water activity and temperature on growth and ochratoxin production by three strains of Aspergillus ochraceus on a barley extract medium and on barley grains. Int. J. Food Microbiol. 1998;44:133–140. doi: 10.1016/S0168-1605(98)00131-7. - DOI - PubMed

Publication types

Supplementary concepts