. 2020 Aug 12;9(8):736.
doi: 10.3390/antiox9080736.

Systemic Insulin Resistance and Metabolic Perturbations in Chow Fed Inducible Nitric Oxide Synthase Knockout Male Mice: Partial Reversal by Nitrite Supplementation

Affiliations

Systemic Insulin Resistance and Metabolic Perturbations in Chow Fed Inducible Nitric Oxide Synthase Knockout Male Mice: Partial Reversal by Nitrite Supplementation

Hobby Aggarwal et al. Antioxidants (Basel). .

Abstract

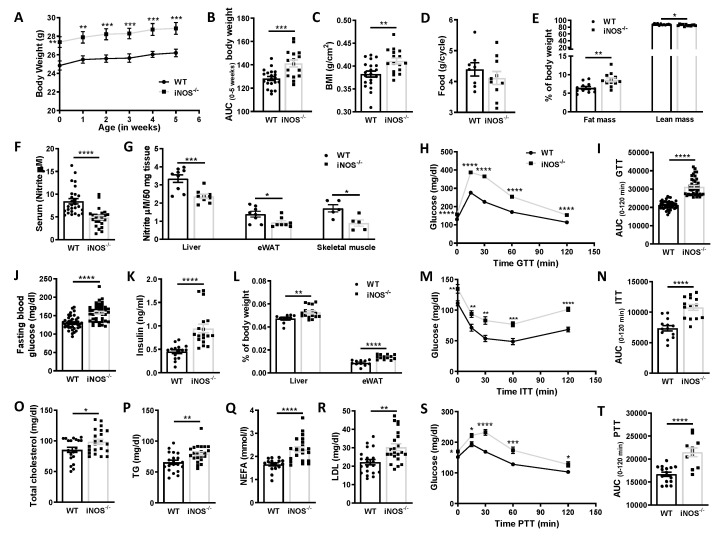
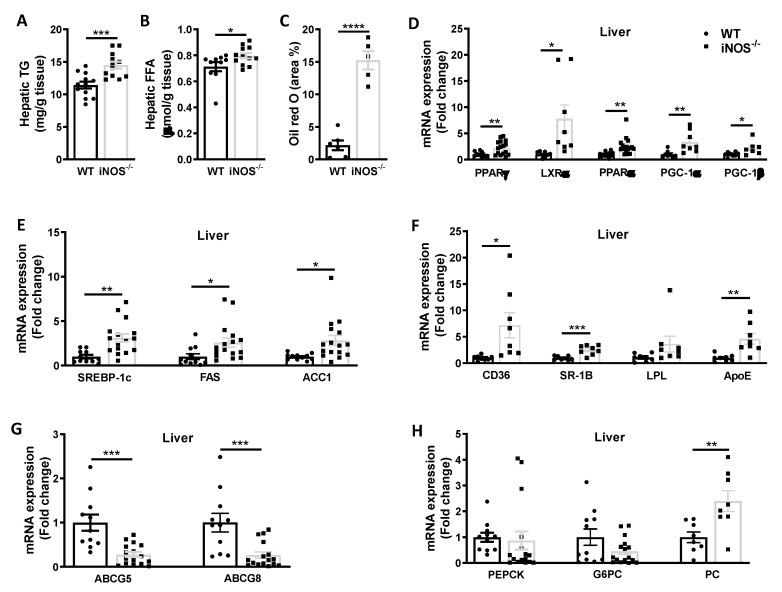
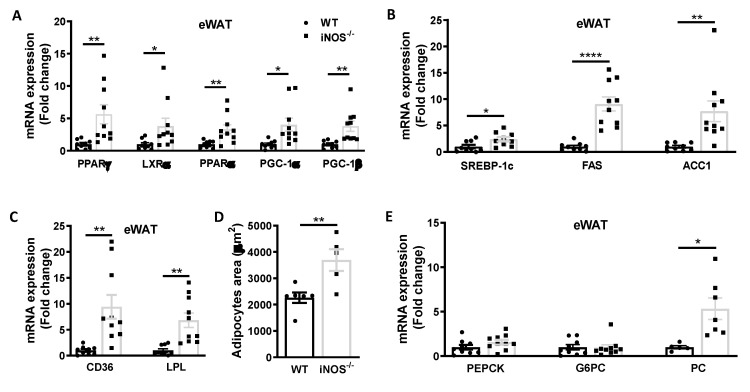
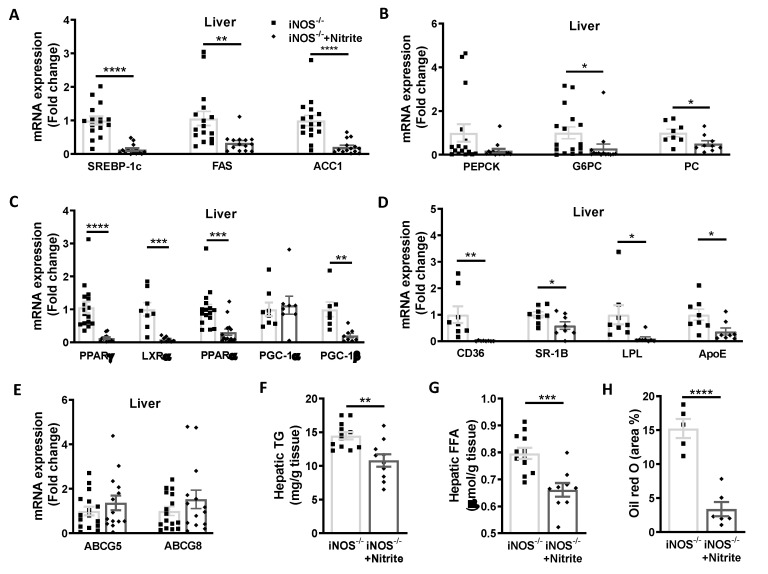
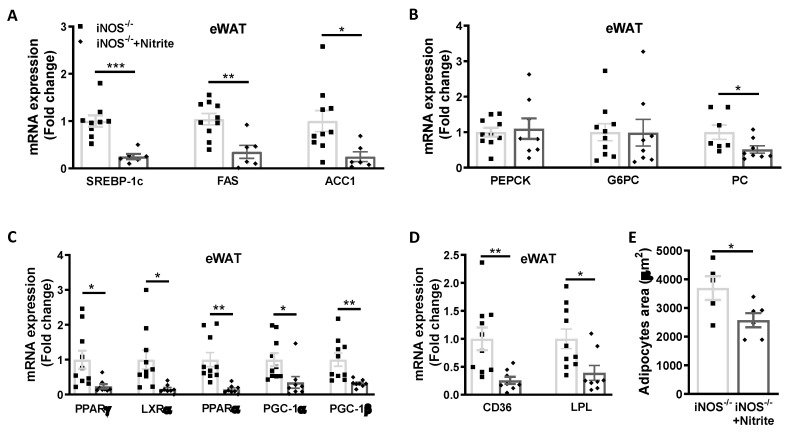
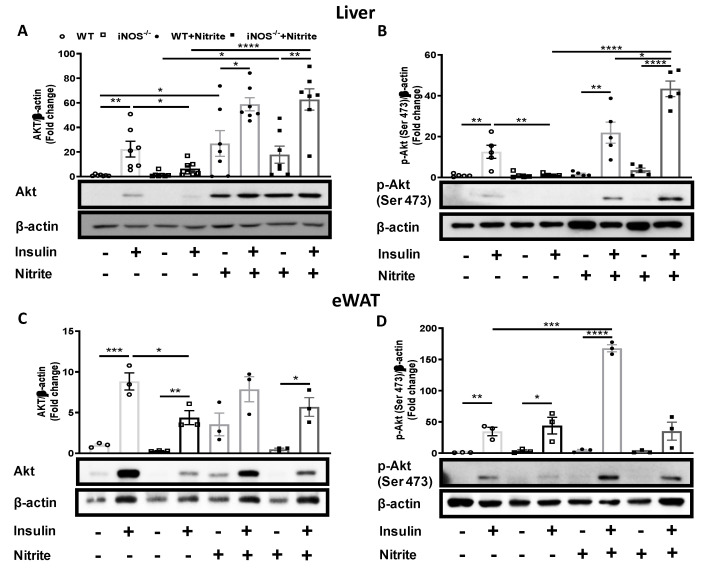
iNOS, an important mediator of inflammation, has emerged as an important metabolic regulator. There are conflicting observations on the incidence of insulin resistance (IR) due to hyperglycemia/dyslipidemia in iNOS-/- mice. There are reports that high fat diet (HFD) fed mice exhibited no change, protection, or enhanced susceptibility to IR. Similar observations were also reported for low fat diet (LFD) fed KO mice. In the present study chow fed iNOS-/- mice were examined for the incidence of IR, and metabolic perturbations, and also for the effect of sodium nitrite supplementation (50 mg/L). In IR-iNOS-/- mice, we observed significantly higher body weight, BMI, adiposity, blood glucose, HOMA-IR, serum/tissue lipids, glucose intolerance, enhanced gluconeogenesis, and disrupted insulin signaling. Expression of genes involved in hepatic and adipose tissue lipid uptake, synthesis, oxidation, and gluconeogenesis was upregulated with concomitant downregulation of genes for hepatic lipid excretion. Nitrite supplementation restored NO levels, significantly improved systemic IR, glucose tolerance, and also reduced lipid accumulation by rescuing hepatic insulin sensitivity, glucose, and lipid homeostasis. Obesity, gluconeogenesis, and adipose tissue insulin signaling were only partially reversed in nitrite supplemented iNOS-/- mice. Our results thus demonstrate that nitrite supplementation to iNOS-/- mice improves insulin sensitivity and metabolic homeostasis, thus further highlighting the metabolic role of iNOS.

Keywords: adipose tissue; dyslipidemia; iNOS−/−; insulin resistance; liver; metabolism; nitric oxide; nitrite.


Conflict of interest statement

The authors declare no conflict of interest. The funders had no role in the design of the study; in the collection, analyses, or interpretation of data; in the writing of the manuscript, or in the decision to publish the results.

Figures

Figure 1
Figure 1
Gross parameters, systemic glucose tolerance, insulin sensitivity, gluconeogenesis, and circulating lipids in chow fed wild type (WT) and iNOS−/− mice. (A) Body weight from the initiation (0 week) to study termination (5 weeks) (WT: n = 20, iNOS−/−: n = 16). (B) Area under the curve (AUC) calculated from the gradual change in the body weight of WT and iNOS−/− (WT: n = 20, iNOS−/−: n = 16) mice. (C) Body mass index (BMI) (WT: n = 20, iNOS−/−: n = 16), (D) food consumption (WT: n = 8, iNOS−/−: n = 10), (E) whole body fat mass and lean mass (%) (n = 12), (F) total nitrite levels in serum (n = 24), (G) total nitrite levels in insulin sensitive tissues—liver (n = 9), white adipose tissue (n = 8), and skeletal muscle (n = 5). (H) Intraperitoneal glucose tolerance test (GTT) and (I) area under the curve (AUC) calculated from IPGTT data (n = 40). (J) Fasting blood glucose levels (n = 40), (K) fasting serum insulin levels (WT: n = 16, iNOS−/−: n = 18), (L) relative liver weight (WT: n = 10, iNOS−/−: n = 16), and epididymal white adipose tissue weight (eWAT) (WT: n = 11, iNOS−/−: n = 12). (M) Intraperitoneal insulin tolerance test (ITT) and (N) AUC calculated from ITT (WT: n = 12, iNOS−/−: n = 10). Serum lipid levels after 6 h fasting (WT: n = 16, iNOS−/−: n = 22). (O) Total cholesterol (TC), (P) triglycerides (TG), (Q) non-esterified free fatty acids (NEFA), (R) low density lipoprotein (LDL). (S) Intraperitoneal pyruvate tolerance test (PTT) and (T) AUC calculated from PTT (WT: n = 12, iNOS−/−: n = 10) in chow fed WT and iNOS−/− mice. Data are represented as mean ± SEM. Black circles: WT, black squares: iNOS−/− mice. * p < 0.05, ** p < 0.01, *** p < 0.001, **** p < 0.0001 vs. WT.
Figure 2
Figure 2
Metabolic homeostasis in liver of chow fed WT and iNOS−/− mice. Lipid accumulation in liver. (A) Hepatic triglycerides (n = 12), (B) hepatic free fatty acids (WT: n = 10, iNOS−/−, n = 12) and (C) hepatic Oil red O staining (WT: n = 6, iNOS−/−, n = 5). (D) qPCR expressions of transcriptional regulators involved in lipid synthesis: PPARy (WT: n = 11, iNOS−/−, n = 16) and LXRα (n = 8) and genes involved in fatty acids oxidation: PPARα (n = 11–16), PGC-1α, and PGC-1β (n = 8). (E) qPCR expression of genes involved in lipid synthesis (WT: n = 11, iNOS−/−, n = 16): SREBP-1c, FAS, and ACC1. (F) qPCR expression of genes involved in lipid uptake (n = 8): CD36, SR-B, ApoE, and LPL. (G) qPCR expression of genes involved in lipid efflux (WT: n = 11, iNOS−/−, n = 16): ABCG5 and ABCG8. (H) qPCR expression of genes involved in gluconeogenesis (WT: n = 11, iNOS−/−, n = 16): PEPCK, G6PC, and PC (n = 8) in chow fed WT and iNOS−/− mice. Data are represented as mean ± SEM. Black circles: WT, black squares: iNOS−/− mice. * p < 0.05, ** p < 0.01, *** p < 0.001, **** p < 0.0001 vs. WT.
Figure 3
Figure 3
Metabolic homeostasis in adipose tissue of chow fed WT and iNOS−/− mice. (A) qPCR expressions of transcriptional regulators involved in lipid synthesis (WT: n = 9, iNOS−/−: n = 10): PPARy and LXRα and genes involved in fatty acids oxidation: PPARα, PGC-1α, and PGC-1β. (B) qPCR expression of genes involved in lipid synthesis (WT: n = 9, iNOS−/−: n = 10): SREBP-1c, FAS, and ACC1. (C) qPCR expression of genes involved in lipid uptake (WT: n = 9, iNOS−/−: n = 10): CD36 and LPL. (D) Mean adipocyte area (WT: n = 6, iNOS−/−: n = 5). (E) qPCR expression of genes involved in gluconeogenesis (WT: n = 9, iNOS−/−: n = 10): PEPCK, G6PC, and PC (WT: n = 5, iNOS−/−: n = 7) in chow fed WT and iNOS−/− mice. Data are represented as mean ± SEM. Black circles: WT, black squares: iNOS−/− mice. * p < 0.05, ** p < 0.01, **** p < 0.0001 vs. WT.
Figure 4
Figure 4
Metabolic homeostasis in liver of chow fed iNOS−/− mice with and without nitrite supplementation. (A) qPCR expression of genes involved in lipid synthesis (iNOS−/−: n = 16, iNOS−/− + Nitrite: n = 14): SREBP-1c, FAS, and ACC1. (B) qPCR expression of genes involved in gluconeogenesis (iNOS−/−: n = 16, iNOS−/− + Nitrite: n = 14): PEPCK, G6PC, and PC (n = 8). (C) qPCR expressions of transcriptional regulators involved in lipid synthesis: PPARy (iNOS−/−: n = 16, iNOS−/− + Nitrite: n = 14) and LXRα (n = 8) and genes involved in fatty acids oxidation: PPARα (iNOS−/−: n = 16, iNOS−/− + Nitrite: n = 14), PGC-1α, and PGC-1β (n = 8). (D) qPCR expression of genes involved in lipid uptake (n = 8): CD36, SR-B, ApoE, and LPL. (E) qPCR expression of genes involved in lipid efflux (iNOS−/−: n = 16, iNOS−/− + Nitrite: n = 14): ABCG5 and ABCG8. Lipid accumulation in liver, (F) hepatic triglycerides (iNOS−/−: n = 12, iNOS−/− + Nitrite: n = 10), (G) hepatic free fatty acids (iNOS−/−: n = 12, iNOS−/− + Nitrite: n = 10), and (H) hepatic Oil red O staining (iNOS−/−: n = 5, iNOS−/− + Nitrite: n = 6) in chow fed iNOS−/− mice with or without nitrite supplementation. Data are represented as mean ± SEM. Black squares: iNOS−/− mice without nitrite supplementation, black diamonds: iNOS−/− mice with nitrite supplementation. * p < 0.05, ** p < 0.01, *** p < 0.001, **** p < 0.0001 vs. iNOS−/−.
Figure 5
Figure 5
Metabolic homeostasis in adipose tissue of chow fed WT and iNOS−/− mice with and without nitrite supplementation. (A) qPCR expression of genes involved in lipid synthesis (iNOS−/−: n = 10, iNOS−/− + Nitrite: n = 6): SREBP-1c, FAS, and ACC1. (B) qPCR expression of genes involved in gluconeogenesis (iNOS−/−: n = 10, iNOS−/− + Nitrite: n = 8): PEPCK, G6PC, and PC (iNOS−/−: n = 7, iNOS−/− + Nitrite: n = 8). (C) qPCR expressions of transcriptional regulators involved in lipid synthesis (iNOS−/−: n = 10, iNOS−/− + Nitrite: n = 8): PPARy and LXRα and genes involved in fatty acids oxidation: PPARα, PGC-1α, and PGC-1β. (D) qPCR expression of genes involved in lipid uptake (iNOS−/−: n = 10, iNOS−/− + Nitrite: n = 8): CD36 and LPL. (E) Mean adipocyte area (iNOS−/−: n = 5, iNOS−/− + Nitrite: n = 6) in chow fed iNOS−/− mice with or without nitrite supplementation. Data are represented as mean ± SEM. Black squares: iNOS−/− mice without nitrite supplementation, black diamonds: iNOS−/− mice with nitrite supplementation. * p < 0.05, ** p < 0.01, *** p < 0.001vs. iNOS−/−.
Figure 6
Figure 6
Insulin signaling in chow fed WT and iNOS−/− mice and its alteration by nitrite treatment. Immunoblots of liver (A) Akt-1/2/3 (n = 7) and (B) p-Akt-1/2/3 (n = 5). Immunoblots of adipose tissue (n = 3) (C) Akt-1/2/3 and (D) p-Akt-1/2/3. Bar diagrams represent mean ± SEM in chow fed, control, or nitrite treated WT and iNOS−/− mice in both basal and insulin stimulated conditions. White circles: WT; black circles: WT supplemented with nitrite; white squares: iNOS−/−; black squares: iNOS−/− supplemented with nitrite. * p < 0.05, ** p < 0.01, *** p < 0.001, **** p < 0.0001 between indicated groups.

Similar articles

Cited by

References

    1. Anavi S., Tirosh O. iNOS as a metabolic enzyme under stress conditions. Free Radic. Biol. Med. 2020;146:16–35. doi: 10.1016/j.freeradbiomed.2019.10.411. - DOI - PubMed
    1. Villanueva C., Giulivi C. Subcellular and cellular locations of nitric oxide synthase isoforms as determinants of health and disease. Free Radic. Biol. Med. 2010;49:307–316. doi: 10.1016/j.freeradbiomed.2010.04.004. - DOI - PMC - PubMed
    1. Wong J.M., Billiar T.R. Regulation and Function of Inducible Nitric Oxide Synthase during Sepsis and Acute Inflammation. Adv. Pharmacol. 1995;34:155–170. doi: 10.1016/S1054-3589(08)61084-4. - DOI - PubMed
    1. Kröncke K.D., Fehsel K., Kolb-Bachofen V. Inducible nitric oxide synthase in human diseases. Clin. Exp. Immunol. 1998;113:147–156. doi: 10.1046/j.1365-2249.1998.00648.x. - DOI - PMC - PubMed
    1. House L.M., Morris R.T., Barnes T.M., Lantier L., Cyphert T.J., McGuinness O.P., Otero Y.F. Tissue inflammation and nitric oxide-mediated alterations in cardiovascular function are major determinants of endotoxin-induced insulin resistance. Cardiovasc. Diabetol. 2015;14:56. doi: 10.1186/s12933-015-0223-2. - DOI - PMC - PubMed