. 2020 Aug 12;9(8):1892.
doi: 10.3390/cells9081892.

Repetitive Intermittent Hyperglycemia Drives the M1 Polarization and Inflammatory Responses in THP-1 Macrophages Through the Mechanism Involving the TLR4-IRF5 Pathway

Affiliations

Repetitive Intermittent Hyperglycemia Drives the M1 Polarization and Inflammatory Responses in THP-1 Macrophages Through the Mechanism Involving the TLR4-IRF5 Pathway

Fatema Al-Rashed et al. Cells. .

Abstract

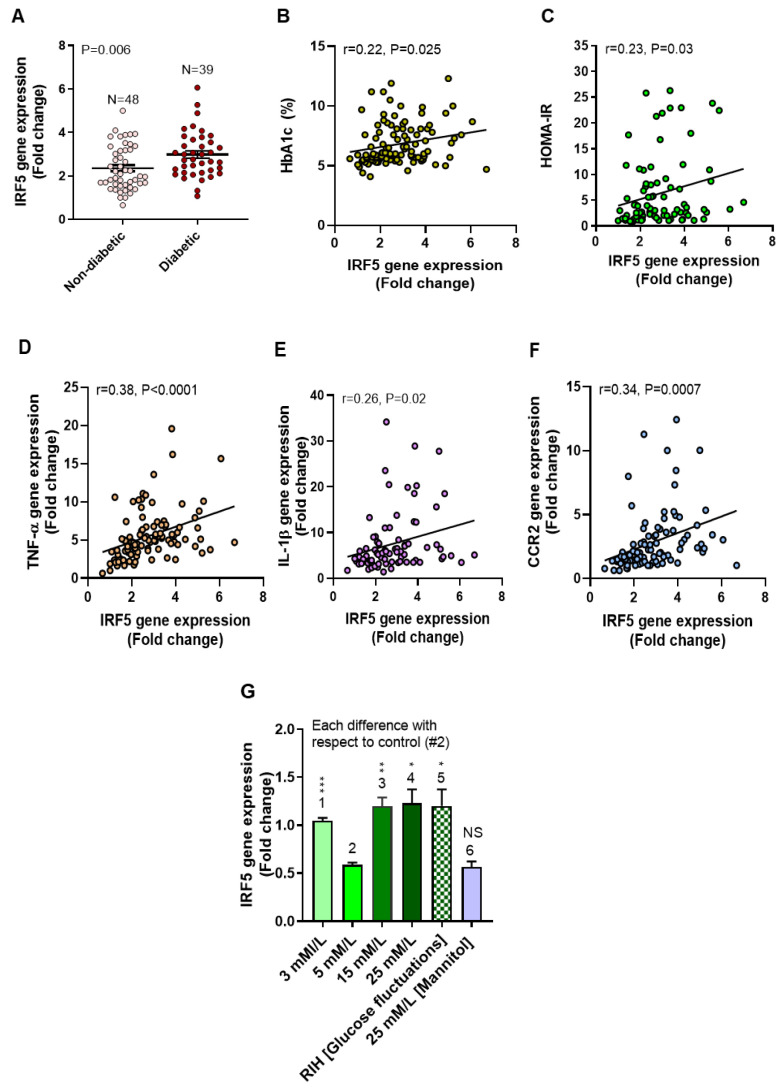
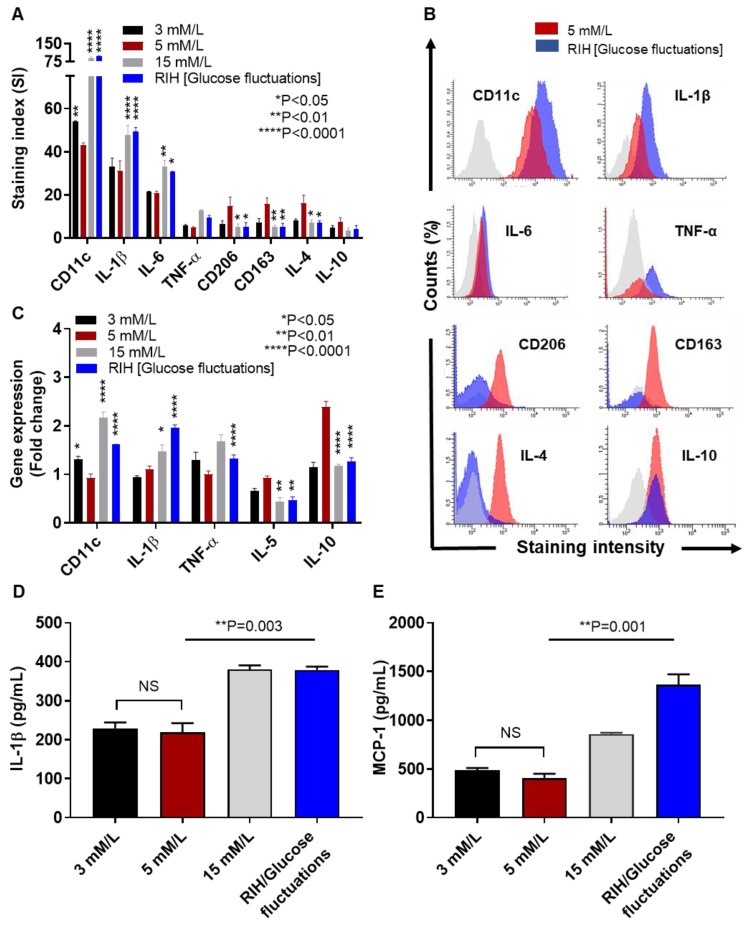
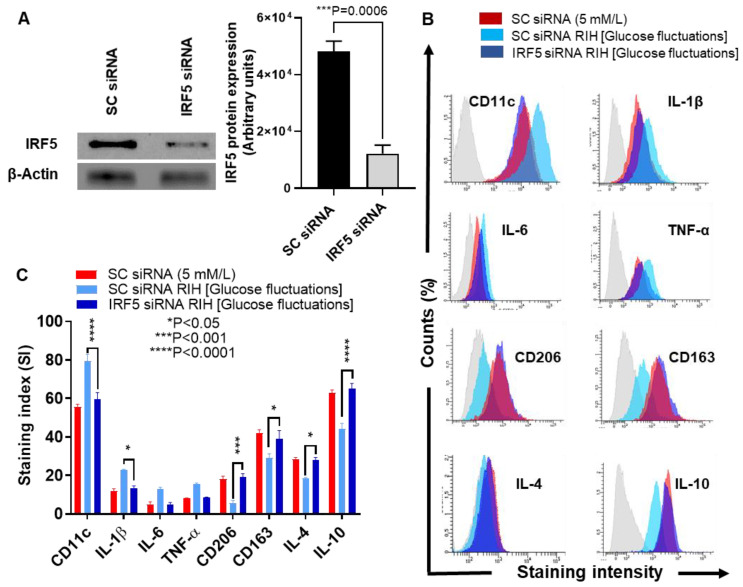
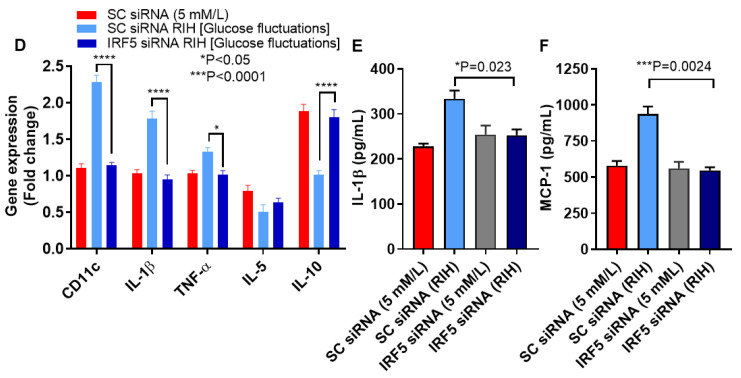
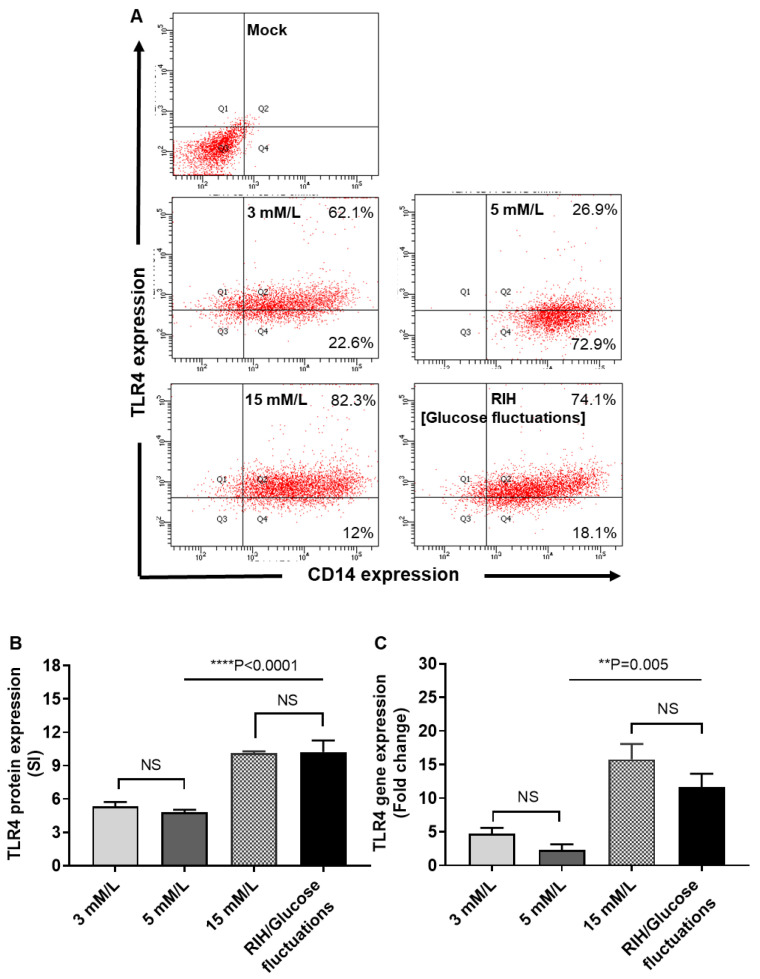
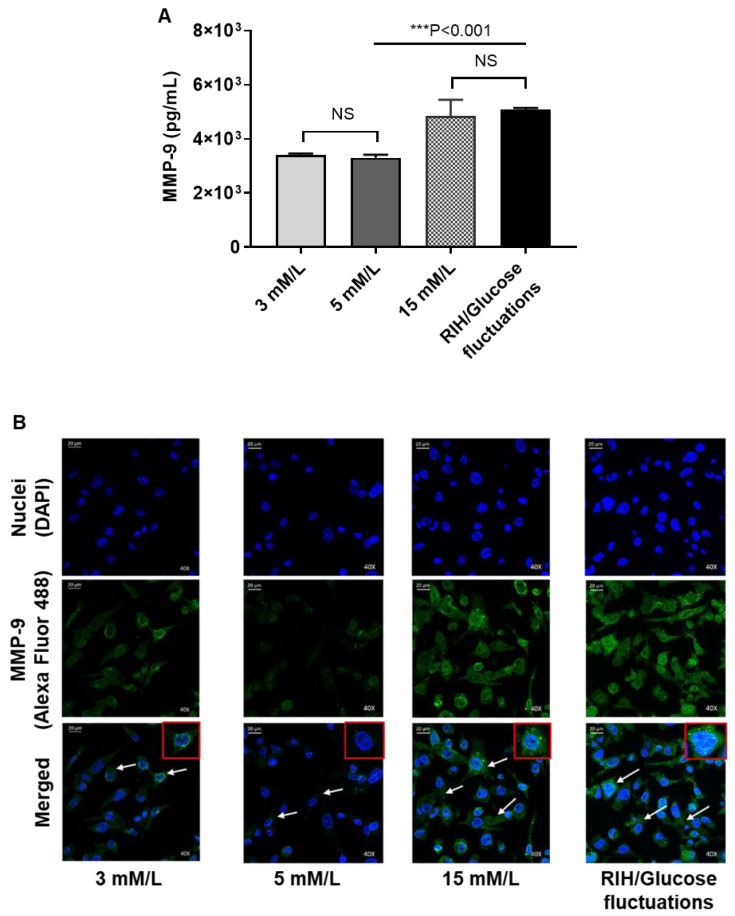
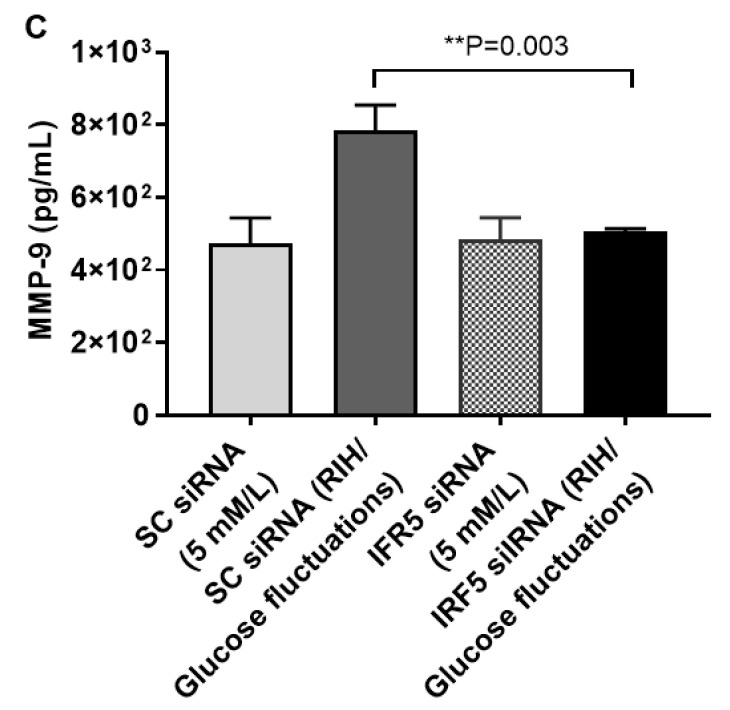
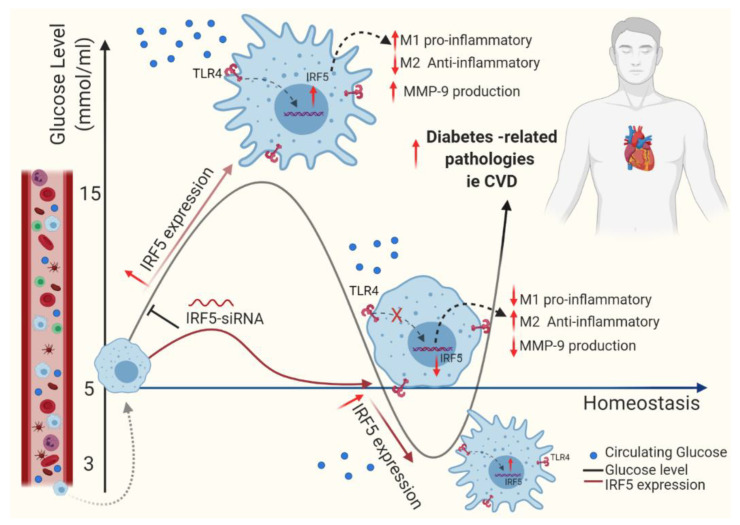
Repetitive intermittent hyperglycemia (RIH) is an independent risk factor for complications associated with type-2 diabetes (T2D). Glucose fluctuations commonly occur in T2D patients with poor glycemic control or following intensive therapy. Reducing blood glucose as well as glucose fluctuations is critical to the control of T2D and its macro-/microvascular complications. The interferon regulatory factor (IRF)-5 located downstream of the nutrient sensor toll-like receptor (TLR)-4, is emerging as a key metabolic regulator. It remains unclear how glucose fluctuations may alter the IRF5/TLR4 expression and inflammatory responses in monocytes/macrophages. To investigate this, first, we determined IRF5 gene expression by real-time qRT-PCR in the white adipose tissue samples from 39 T2D and 48 nondiabetic individuals. Next, we cultured THP-1 macrophages in hypo- and hyperglycemic conditions and compared, at the protein and transcription levels, the expressions of IRF5, TLR4, and M1/M2 polarization profile and inflammatory markers against control (normoglycemia). Protein expression was assessed using flow cytometry, ELISA, Western blotting, and/or confocal microscopy. IRF5 silencing was achieved by small interfering RNA (siRNA) transfection. The data show that adipose IRF5 gene expression was higher in T2D than nondiabetic counterparts (P = 0.006), which correlated with glycated hemoglobin (HbA1c) (r = 0.47/P < 0.001), homeostatic model assessment of insulin resistance (HOMA-IR) (r = 0.23/P = 0.03), tumor necrosis factor (TNF)-α (r = 0.56/P < 0.0001), interleukin (IL)-1β (r = 0.40/P = 0.0009), and C-C motif chemokine receptor (CCR)-2 (r = 0.49/P < 0.001) expression. IRF5 expression in macrophages was induced/upregulated (P < 0.05) by hypoglycemia (3 mM/L), persistent hyperglycemia (15 mM/L-25 mM/L), and RIH/glucose fluctuations (3-15 mM/L) as compared to normoglycemia (5 mM/L). RIH/glucose fluctuations also induced M1 polarization and an inflammatory profile (CD11c, IL-1β, TNF-α, IL-6, and monocyte chemoattractant protein (MCP)-1) in macrophages. RIH/glucose fluctuations also drove the expression of matrix metalloproteinase (MMP)-9 (P < 0.001), which is a known marker for cardiovascular complication in T2D patients. Notably, all these changes were counteracted by IRF5 silencing in macrophages. In conclusion, RIH/glucose fluctuations promote the M1 polarization and inflammatory responses in macrophages via the mechanism involving TLR4-IRF5 pathway, which may have significance for metabolic inflammation.

Keywords: IRF5; TLR4; glucose fluctuations; macrophages; metabolic inflammation; repetitive intermittent hyperglycemia; type-2 diabetes.


Conflict of interest statement

The authors declare that there are no conflicts of interest involved.

Figures

Figure 1
Figure 1
Adipose IRF5 gene expression is upregulated in type-2 diabetic patients as well as in macrophages cultured under low, high, and repetitive intermittent hyperglycemia (RIH). Adipose tissue samples from nondiabetic (N = 48) and diabetic (N = 39) individuals were analyzed for transcripts of interferon regulatory factor (IRF5), tumor necrosis factor (TNF)-α, interleukin (IL)-1β, and C-C motif chemokine receptor (CCR)-2 using real-time qRT-PCR as described in the Materials and Methods section. Glycated hemoglobin (HbA1c) levels were determent by biochemical analysis of whole blood samples. In addition, THP-1 monocytic cells were differentiated into macrophages and cultured for 3 days under conditions of hypoglycemia (3 mM/L), normoglycemia (5 mM/L), persistent medium and strong hyperglycemia (15 mM/L and 25 mM/L, respectively), and RIH/glucose fluctuations (3–15 mM/L). Macrophages were cultured with mannitol (25 mM/L) for osmolar control. (A) Adipose IFR5 mRNA expression was found to be higher in diabetic than nondiabetic individuals (p = 0.006). The increased adipose IRF5 expression correlated positively with (B) HbA1c (r = 0.47, p < 0.0001), (C) Homeostatic Model Assessment of Insulin Resistance (HOMA-IR) (r = 0.23, p = 0.03), (D) TNF-α (r = 0.56, p < 0.0001), (E) IL-1β (r = 0.40, p = 0.0009), and (F) CCR2 (r = 0.49, p < 0.0001). (G) IRF5 gene expression was upregulated in THP-1 macrophages following exposure to hypoglycemia, persistent medium and strong hyperglycemia, and RIH/glucose fluctuations as compared to control (normoglycemia). All data are expressed as mean ± SEM values. * p ≤ 0.05, ** p ≤ 0.01, *** p ≤ 0.001, and NS: nonsignificant.
Figure 2
Figure 2
IRF5 upregulation is accompanied by increased M1 macrophage polarization markers and pro-inflammatory cytokines expression. THP-1 transformed macrophages were cultured for 3 days under conditions of hypoglycemia (3 mM/L), normoglycemia (5 mM/L), persistent medium hyperglycemia (15 mM/L), and RIH/glucose fluctuations (3–15 mM/L). Cells were harvested and stained with fluorescent antibodies against M1/M2 macrophage markers and selected pro-inflammatory and anti-inflammatory cytokines as described in the Materials and Methods section. IL-1β and monocyte chemoattractant protein (MCP)-1 levels in culture supernatants were measured by ELISA. Cells were also harvested for measuring gene expression of M1/M2 polarization and inflammatory markers using real-time qRT-PCR. (A) Representative flow cytometry data from three independent determinations with similar results are presented as bar graphs of mean staining index (SI). (B) Representative flow cytometry data from three independent determinations with similar results are presented as histograms. (C) Representative qRT-PCR data from three independent determinations with similar results are presented as bar graphs showing selected gene expression as fold change over control gene expression taken as 1. (D,E) Representative ELISA data from three independent determinations with similar results are presented as bar graphs showing secreted protein levels of IL-1β and MCP-1, respectively, in macrophage culture supernatants. All data are expressed as mean ± SEM values. * p ≤ 0.05, ** p ≤ 0.01, **** p ≤ 0.0001, and NS: nonsignificant.
Figure 3
Figure 3
IRF5 silencing prevents the expression of M1 markers and inflammatory cytokines/chemokine in THP-1 macrophages cultured under repetitive intermittent hyperglycemia (RIH). THP-1 monocytes were transfected with scrambled siRNA (mock/negative control) or IRF5 siRNA and incubated for 36 h for transformation into macrophages following standard protocol. THP-1 macrophages were then cultured for 36 h under conditions of normoglycemia (5 mM/L) and RIH/glucose fluctuations (3–15 mM/L). Cells were harvested and stained with fluorescent antibodies against M1/M2 macrophage markers and selected pro-inflammatory and anti-inflammatory cytokines as described in the Materials and Methods section. IRF5 protein expression in transfected cells was measured by Western blot. IL-1β and MCP-1 levels in culture supernatants were measured by ELISA. Cells were also harvested for measuring gene expression of M1/M2 polarization and inflammatory markers using real-time qRT-PCR as described in the Materials and Methods section. (A) Representative data from three independent determinations with similar results show the diminished IRF5 protein expression in transfected cells compared with the mock cells (p = 0.0006). (B) Representative flow cytometry data from three independent determinations with similar results are presented as histograms. (C) Representative flow cytometry data from three independent determinations with similar results are presented as bar graphs of protein expression, shown as mean staining index (SI). (D) Representative qRT-PCR data from three independent determinations with similar results are presented as bar graphs showing selected gene expression as fold change over control gene expression taken as 1. (E,F) Representative ELISA data from three independent determinations with similar results are presented as bar graphs showing secreted protein levels of IL-1β and MCP-1, respectively, in macrophage culture supernatants. All data are expressed as mean ± SEM values. * p ≤ 0.05, *** p ≤ 0.001, and **** p ≤ 0.0001.
Figure 3
Figure 3
IRF5 silencing prevents the expression of M1 markers and inflammatory cytokines/chemokine in THP-1 macrophages cultured under repetitive intermittent hyperglycemia (RIH). THP-1 monocytes were transfected with scrambled siRNA (mock/negative control) or IRF5 siRNA and incubated for 36 h for transformation into macrophages following standard protocol. THP-1 macrophages were then cultured for 36 h under conditions of normoglycemia (5 mM/L) and RIH/glucose fluctuations (3–15 mM/L). Cells were harvested and stained with fluorescent antibodies against M1/M2 macrophage markers and selected pro-inflammatory and anti-inflammatory cytokines as described in the Materials and Methods section. IRF5 protein expression in transfected cells was measured by Western blot. IL-1β and MCP-1 levels in culture supernatants were measured by ELISA. Cells were also harvested for measuring gene expression of M1/M2 polarization and inflammatory markers using real-time qRT-PCR as described in the Materials and Methods section. (A) Representative data from three independent determinations with similar results show the diminished IRF5 protein expression in transfected cells compared with the mock cells (p = 0.0006). (B) Representative flow cytometry data from three independent determinations with similar results are presented as histograms. (C) Representative flow cytometry data from three independent determinations with similar results are presented as bar graphs of protein expression, shown as mean staining index (SI). (D) Representative qRT-PCR data from three independent determinations with similar results are presented as bar graphs showing selected gene expression as fold change over control gene expression taken as 1. (E,F) Representative ELISA data from three independent determinations with similar results are presented as bar graphs showing secreted protein levels of IL-1β and MCP-1, respectively, in macrophage culture supernatants. All data are expressed as mean ± SEM values. * p ≤ 0.05, *** p ≤ 0.001, and **** p ≤ 0.0001.
Figure 4
Figure 4
Repetitive intermittent hyperglycemia (RIH) promotes the expression of TLR4 on THP-1 macrophages. THP-1 transformed macrophages were cultured for 3 days under conditions of hypoglycemia (3 mM/L), normoglycemia (5 mM/L), persistent medium hyperglycemia (15 mM/L), and RIH/glucose fluctuations (3–15 mM/L). Cells were harvested and stained with fluorescent antibodies against CD14 and TLR4 along with isotype matched controls. TLR4 gene expression were measured using real-time qRT-PCR as described in the Materials and Methods section. (A) Representative flow cytometry data from three independent determinations with similar results are presented as dot blot for TLR4 vs. CD14 expression in macrophages. (B) Representative flow cytometry data from three independent determinations with similar results are presented as bar graph of mean staining index (SI). (C) Representative qRT-PCR data from three independent determinations with similar results are presented as bar graphs showing TLR4 gene expression as fold change over control gene expression taken as 1. All data are expressed as mean ± SEM values. ** p ≤ 0.01, **** p ≤ 0.0001, and NS: nonsignificant.
Figure 5
Figure 5
Repetitive intermittent hyperglycemia (RIH) induces IRF5-dependent expression of matrix metalloproteinase (MMP)-9 in THP-1 macrophages. THP-1-derived macrophages grown on coverslips were cultured for 3 days under conditions of hypoglycemia (3 mM/L), normoglycemia (5 mM/L), persistent medium hyperglycemia (15 mM/L), and RIH/glucose fluctuations (3–15 mM/L). MMP-9 intracellular expression and MMP-9 secreted protein in culture supernatants were determined by confocal microscopy and ELISA, respectively, as described in the Materials and Methods section. In IRF5 silencing assays, THP-1 monocytes were transfected with scrambled siRNA (mock/negative control) or IRF5 siRNA and incubated for 36h. Later, THP-1 transformed macrophages were cultured for 36 h under conditions of normoglycemia (5 mM/L) and RIH/glucose fluctuations (3–15 mM/L), and supernatants were collected for measuring MMP-1 secreted protein expression by ELISA. (A) Representative ELISA data from three independent determinations with similar results are presented as bar graph of MMP-9 secreted protein expression (pg/mL) in culture supernatants. (B) Representative images from five independent determinations with similar results, showing MMP-9 protein expression in macrophages cultured under various glucose concentration in the medium. Images are shown at 40× magnification; Scale bar = 20 µM. (C) Representative ELISA data from three independent determinations with similar results are presented as bar graph showing MMP-9 secreted protein expression (pg/mL) in supernatants of macrophages cultured under normoglycemia and RIH/glucose fluctuations, with or without IRF5 silencing. All data are expressed as mean ± SEM values. ** p ≤ 0.01, *** p ≤ 0.001, and NS: nonsignificant.
Figure 5
Figure 5
Repetitive intermittent hyperglycemia (RIH) induces IRF5-dependent expression of matrix metalloproteinase (MMP)-9 in THP-1 macrophages. THP-1-derived macrophages grown on coverslips were cultured for 3 days under conditions of hypoglycemia (3 mM/L), normoglycemia (5 mM/L), persistent medium hyperglycemia (15 mM/L), and RIH/glucose fluctuations (3–15 mM/L). MMP-9 intracellular expression and MMP-9 secreted protein in culture supernatants were determined by confocal microscopy and ELISA, respectively, as described in the Materials and Methods section. In IRF5 silencing assays, THP-1 monocytes were transfected with scrambled siRNA (mock/negative control) or IRF5 siRNA and incubated for 36h. Later, THP-1 transformed macrophages were cultured for 36 h under conditions of normoglycemia (5 mM/L) and RIH/glucose fluctuations (3–15 mM/L), and supernatants were collected for measuring MMP-1 secreted protein expression by ELISA. (A) Representative ELISA data from three independent determinations with similar results are presented as bar graph of MMP-9 secreted protein expression (pg/mL) in culture supernatants. (B) Representative images from five independent determinations with similar results, showing MMP-9 protein expression in macrophages cultured under various glucose concentration in the medium. Images are shown at 40× magnification; Scale bar = 20 µM. (C) Representative ELISA data from three independent determinations with similar results are presented as bar graph showing MMP-9 secreted protein expression (pg/mL) in supernatants of macrophages cultured under normoglycemia and RIH/glucose fluctuations, with or without IRF5 silencing. All data are expressed as mean ± SEM values. ** p ≤ 0.01, *** p ≤ 0.001, and NS: nonsignificant.
Figure 6
Figure 6
This illustration represents a proposed model of metabolic inflammation in support of the data presented, wherein RIH or glucose fluctuations in vitro upregulate the expression of TLR4-IRF5 together with markers of inflammation and the cardiovascular disease marker MMP-9 in macrophages. These data support the notion that controlling glucose fluctuations and/or IRF5 silencing could be beneficial to alleviate metabolic inflammation.

References

    1. Ceriello A., Ihnat M.A. ‘Glycaemic variability’: A new therapeutic challenge in diabetes and the critical care setting. Diabet. Med. 2010;27:862–867. doi: 10.1111/j.1464-5491.2010.02967.x. - DOI - PubMed
    1. Butler S.O., Btaiche I.F., Alaniz C. Relationship Between Hyperglycemia and Infection in Critically Ill Patients. Pharmacother. J. Hum. Pharmacol. Drug Ther. 2005;25:963–976. doi: 10.1592/phco.2005.25.7.963. - DOI - PubMed
    1. Ghazali N., O’brien J.M., Dungan K., Phillips G., Marsh C.B., Lemeshow S., Connors A.F., Preiser J.-C. Glucose variability and mortality in patients with sepsis*. Crit. Care Med. 2008;36:2316–2321. doi: 10.1097/ccm.0b013e3181810378. - DOI - PMC - PubMed
    1. Huang J., Zhang X., Li J., Tang L., Jiao X., Lv X. Impact of glucose fluctuation on acute cerebral infarction in type 2 diabetes. Can. J. Neurol. Sci./J. Can. des Sci. Neurol. 2014;41:486–492. doi: 10.1017/S0317167100018539. - DOI - PubMed
    1. Yoo S., Lee H.-J., Lee H., Ryu H.G. Association Between Perioperative Hyperglycemia or Glucose Variability and Postoperative Acute Kidney Injury After Liver Transplantation. Anesthesia Analg. 2017;124:35–41. doi: 10.1213/ANE.0000000000001632. - DOI - PubMed

Publication types

MeSH terms