

Higher Resolution Charge Detection Mass Spectrometry
- PMID: 32806905
- PMCID: PMC8587657
- DOI: 10.1021/acs.analchem.0c02133
Higher Resolution Charge Detection Mass Spectrometry
Abstract
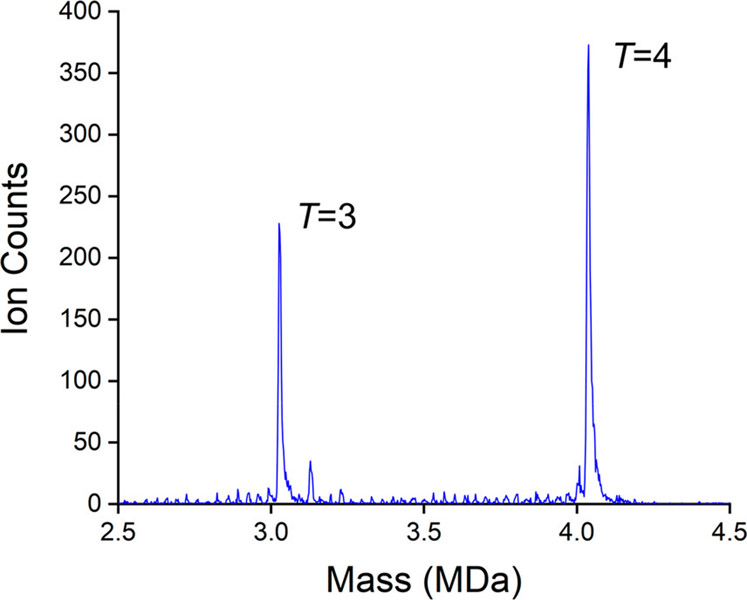
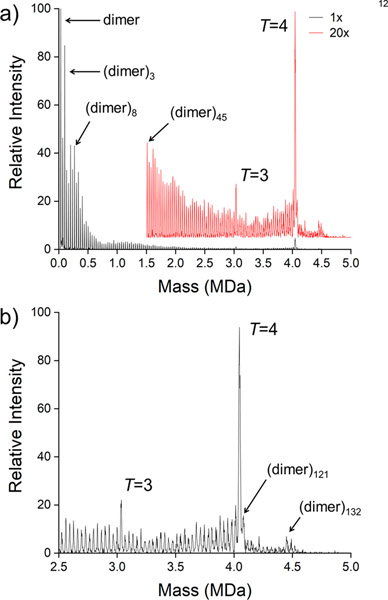
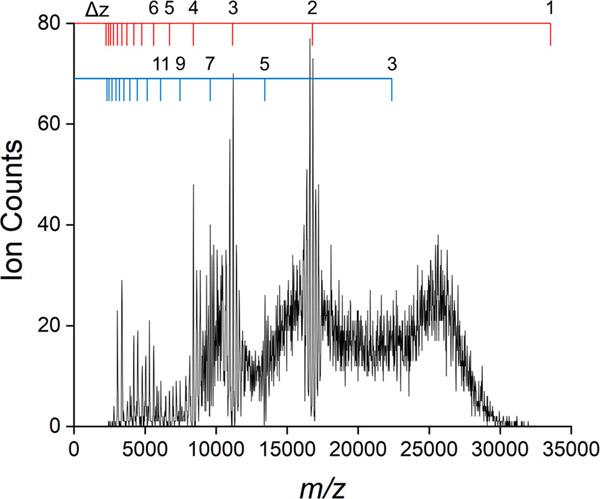
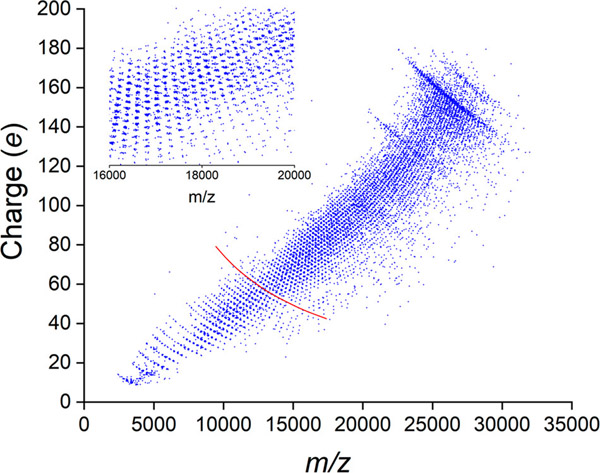
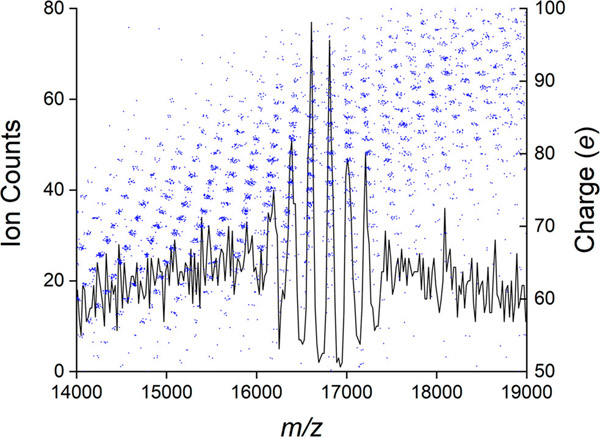
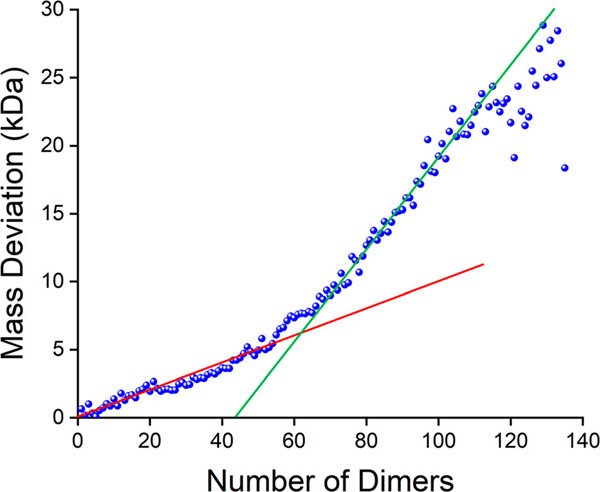
Charge detection mass spectrometry is a single particle technique where the masses of individual ions are determined from simultaneous measurements of each ion's m/z ratio and charge. The ions pass through a conducting cylinder, and the charge induced on the cylinder is detected. The cylinder is usually placed inside an electrostatic linear ion trap so that the ions oscillate back and forth through the cylinder. The resulting time domain signal is analyzed by fast Fourier transformation; the oscillation frequency yields the m/z, and the charge is determined from the magnitudes. The mass resolving power depends on the uncertainties in both quantities. In previous work, the mass resolving power was modest, around 30-40. In this work we report around an order of magnitude improvement. The improvement was achieved by coupling high-accuracy charge measurements (obtained with dynamic calibration) with higher resolution m/z measurements. The performance was benchmarked by monitoring the assembly of the hepatitis B virus (HBV) capsid. The HBV capsid assembly reaction can result in a heterogeneous mixture of intermediates extending from the capsid protein dimer to the icosahedral T = 4 capsid with 120 dimers. Intermediates of all possible sizes were resolved, as well as some overgrown species. Despite the improved mass resolving power, the measured peak widths are still dominated by instrumental resolution. Heterogeneity makes only a small contribution. Resonances were observed in some of the m/z spectra. They result from ions with different masses and charges having similar m/z values. Analogous resonances are expected whenever the sample is a heterogeneous mixture assembled from a common building block.
Conflict of interest statement
The authors declare the following competing financial interest(s): The authors, except A.Z. and M.F.J., declare no competing financial interest. A.Z. is associated with a company that is developing antiviral compounds. M.F.J. is associated with a company developing charge detection mass spectrometry.
Figures
References
-
- Yamashita M; Fenn JB J. Phys. Chem. 1984, 88, 4451–4459.
-
- Tanaka K; Waki H; Ido Y; Akita S; Yoshida Y; Yoshida T; Matsuo T Rapid Commun. Mass Spectrom. 1988, 2, 151–153.
-
- Loo JA Mass Spectrom. Rev. 1997, 16, 1–23. - PubMed
-
- van den Heuvel RHH; Heck AJ R. Curr. Opin. Chem. Biol. 2004, 8, 519–526. - PubMed
-
- Pukala TL; Ruotolo BT; Zhou M; Politis A; Stefanescu R; Leary JA; Robinson CV Structure 2009, 17, 1235–1243. - PubMed
Publication types
MeSH terms
Substances
Grants and funding
LinkOut - more resources
Full Text Sources
Other Literature Sources
