. 2020 Aug 17;17(1):25.
doi: 10.1186/s12977-020-00533-1.

Dynamic nanopore long-read sequencing analysis of HIV-1 splicing events during the early steps of infection

Affiliations

Dynamic nanopore long-read sequencing analysis of HIV-1 splicing events during the early steps of infection

Nam Nguyen Quang et al. Retrovirology. .

Abstract

Background: Alternative splicing is a key step in Human Immunodeficiency Virus type 1 (HIV-1) replication that is tightly regulated both temporally and spatially. More than 50 different transcripts can be generated from a single HIV-1 unspliced pre-messenger RNA (pre-mRNA) and a balanced proportion of unspliced and spliced transcripts is critical for the production of infectious virions. Understanding the mechanisms involved in the regulation of viral RNA is therefore of potential therapeutic interest. However, monitoring the regulation of alternative splicing events at a transcriptome-wide level during cell infection is challenging. Here we used the long-read cDNA sequencing developed by Oxford Nanopore Technologies (ONT) to explore in a quantitative manner the complexity of the HIV-1 transcriptome regulation in infected primary CD4+ T cells.

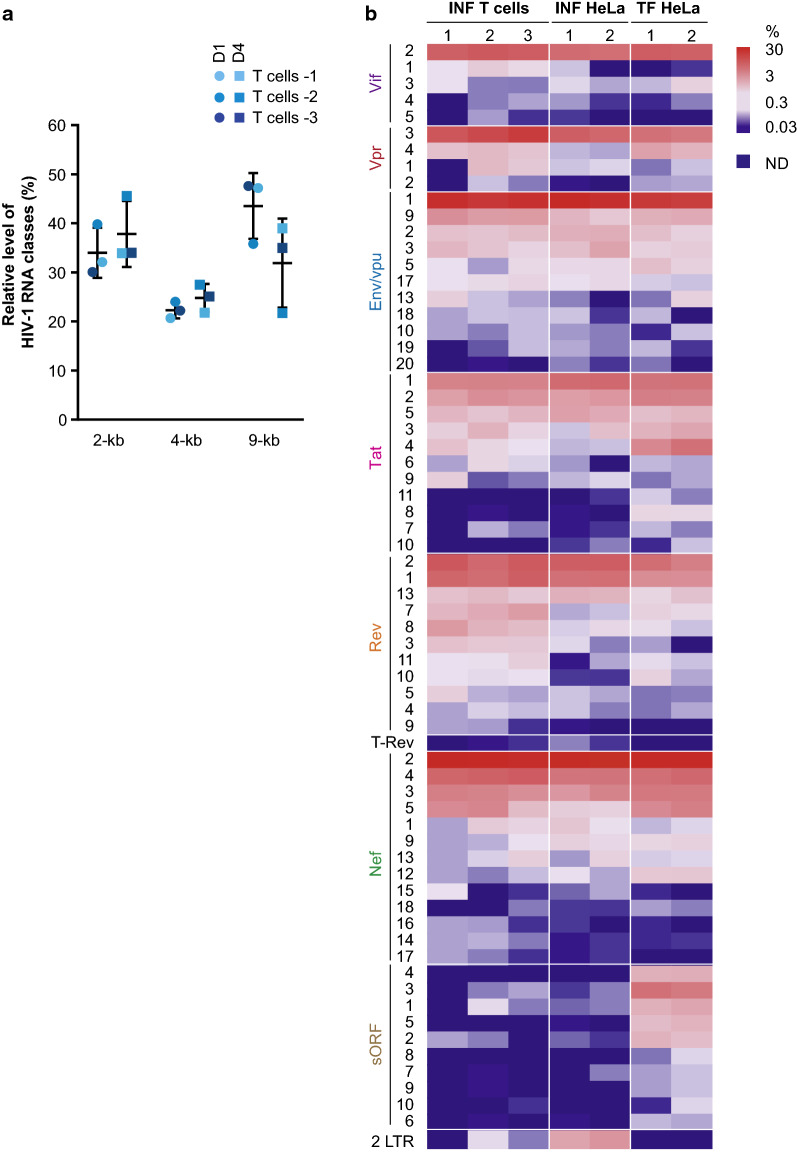
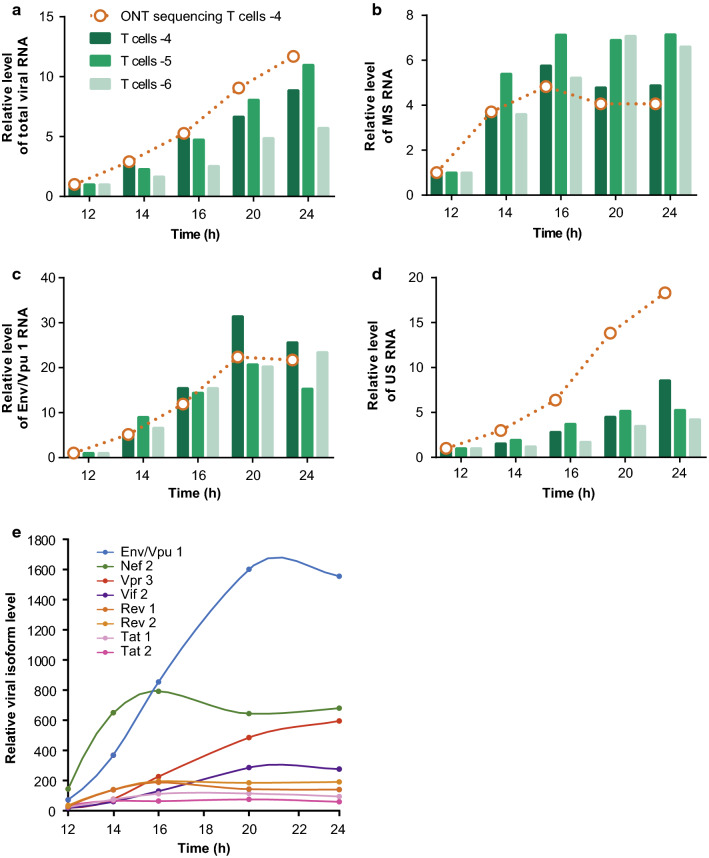
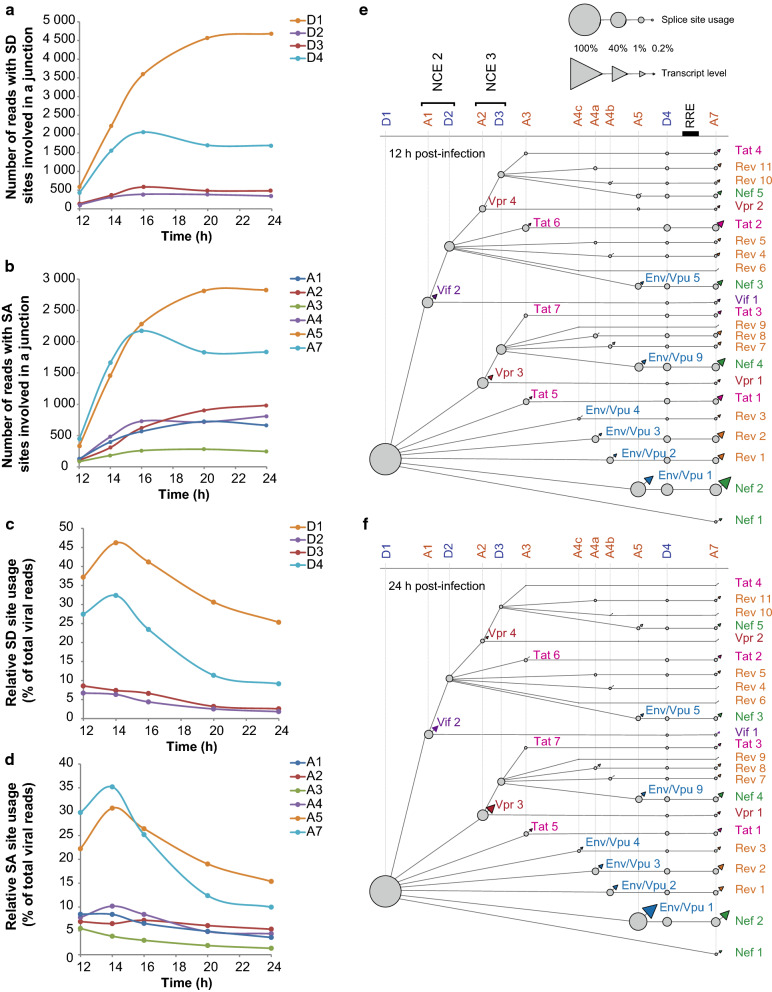
Results: ONT reads mapping to the viral genome proved sufficiently long to span all possible splice junctions, even distant ones, and to be assigned to a total of 150 exon combinations. Fifty-three viral RNA isoforms, including 14 new ones were further considered for quantification. Relative levels of viral RNAs determined by ONT sequencing showed a high degree of reproducibility, compared favourably to those produced in previous reports and highly correlated with quantitative PCR (qPCR) data. To get further insights into alternative splicing regulation, we then compiled quantifications of splice site (SS) usage and transcript levels to build "splice trees", a quantitative representation of the cascade of events leading to the different viral isoforms. This approach allowed visualizing the complete rewiring of SS usages upon perturbation of SS D2 and its impact on viral isoform levels. Furthermore, we produced the first dynamic picture of the cascade of events occurring between 12 and 24 h of viral infection. In particular, our data highlighted the importance of non-coding exons in viral RNA transcriptome regulation.

Conclusion: ONT sequencing is a convenient and reliable strategy that enabled us to grasp the dynamic of the early splicing events modulating the viral RNA landscape in HIV-1 infected cells.

Keywords: Alternative splicing; HIV RNA; ONT long-read sequencing; Viral transcriptome.


Conflict of interest statement

The authors declare that they have no competing interests.

Figures

Fig. 1
Fig. 1
Annotation and usage of HIV-1 splice sites by ONT sequencing in infected T cells. a Sashimi plots for flanking and alternatively spliced exons determined by ONT sequencing in infected CD4+ T cells from 3 donors were visualized in IGV. Exon boundaries between putative SD and SA sites are symbolized in grey lines. Organization of HIV NL4-3 genome is indicated. b SD (in blue) and SA (in red) sites considered in the rest of the analysis are presented. Enlarged representations allow the observation of previously reported cryptic SS as well as putative new SS (indicated by a black dot). Values represent the sum of reads mapping to each SS across the three T cell samples
Fig. 2
Fig. 2
Schematic representation of HIV-1 RNA population detected by ONT sequencing in infected T cells. Organization of HIV NL4-3 genome as well as position of SD and SA sites identified in Fig. 1 are indicated. Nomenclatures of introns and exons are according to [4, 5]. Only transcripts that were detected by ONT sequencing at least 5 times across infected CD4+ T cells are represented. Thick boxes correspond to retained exons and thin lines excised introns. Transcripts known or susceptible to encode the same viral proteins were grouped together and their ORF were color-coded (blue for Env/Vpu, green for Nef, yellow for Rev, pink for Tat, purple for Vif and red for Vpr). RNA species were named as indicated on the left side according to [4, 5, 10]. Putative new isoforms are indicated by black dots on the right side
Fig. 3
Fig. 3
Quantification of viral isoforms produced in different HIV-1 expression models determined by ONT sequencing. a Relative abundance of viral RNA classes estimated either at D1 SS (dots) or at D4 SS (square) in infected CD4+ T cells from 3 different donors. Relative abundances of MS (2-kb), IS (4-kb) and US (9-kb) RNA classes were based on the number of reads harbouring or not a splice junction at D1 or D4 amongst all annotated reads as described in Additional file 8: Figure S3. Mean values and standard deviations are indicated. b Quantification of viral spliced isoforms expressed at 24 hpi in CD4+ T cells (INF T cells), HeLa cells (INF HeLa) or 24 h after transfection of HeLa cells (TF HeLa) according to ONT sequencing. Heatmap indicates the relative level of viral isoforms as a percentage of reads mapping to this particular transcript amongst reads mapping to all viral spliced transcripts. Only transcripts that were represented at least 5 times across replicates were considered. ND not detected
Fig. 4
Fig. 4
Characterization of HIV-1 RNA populations in HeLa cells expressing either wild-type or U1 D2upEx snRNA by ONT sequencing. HeLa cells were transfected with either the wild-type U1 snRNA or the modified U1 D2upEx snRNA enhancing SS D2 usage. 48 h later, cells were harvested, RNA was extracted and cDNA libraries were prepared. ONT sequencing and analyses were performed as described in Fig. 1. a Usage of SD and SA sites are expressed as a percentage of the occurrence of all SS within each condition. Data are presented as mean (n = 3). P values were calculated using an unpaired t-test (*p < 0.05, **p < 0.01, ***p < 0.001 and ****p < 0.0001). b Isoform expression levels were calculated for both wild-type and U1 D2upEx snRNA conditions. Heatmap represents the fold enrichment of isoforms expressed in U1 D2upEx snRNA expressing cells over wild-type U1 snRNA condition according to the coloured scale. For strongly downregulated RNAs that were not detectable anymore by ONT sequencing in U1D2upEx snRNA conditions, a correction of 0.0075% corresponding to the lowest  % calculated for the detection of a single read, was added. c Relative expression of 12 viral isoforms were measured by qPCR in WT and U1D2upEx snRNA expressing samples and fold changes were calculated as in b. US RNA levels were estimated at D1. Correlation curve was plotted using a linear regression model supplied by Prism 7. Pearson correlation coefficient r is indicated. p < 0.0001
Fig. 5
Fig. 5
Effect of artificially enhanced splicing at D2 on HIV-1 alternative splicing regulation. Splice trees were drawn on Cytoscape based on ONT quantifications of SS usages and spliced isoform levels in a WT U1 snRNA and b U1D2upEx snRNA conditions. Only expression of transcripts that were found at least 5 times across the replicates and produced by usage of major SS were considered. Usage of SS are represented by nodes, lines symbolize splice junctions between SD and SA sites and the resulting isoforms are represented by triangles. Names of isoforms are indicated only if they could be detected in the condition. Sizes of nodes are function of relative SS usage and sizes of triangles are function of transcript levels as indicated by the scale. As D1 is present in all spliced isoforms, value of D1 was set at 100%. Non-coding exon (NCE) 2 and 3 are indicated
Fig. 6
Fig. 6
Relative abundance of viral transcripts expressed at early time points of T cell infection, determined by ONT sequencing. Primary CD4+ T cells were infected with HIV NL4-3 VSV-G pseudotyped virus and harvested at 12, 14, 16, 20 and 24 hpi for RNA extraction. Relative abundance of a Total, b MS, c Env/Vpu 1 and d US RNA was monitored by qPCR for three different donors using the ΔΔCq method and normalized with GAPDH and β-Actin as reference genes. ONT sequencing and mapping were performed on RNA extracted from donor 4 (orange lines). Read counts were normalized with DESeq 2 included in the Eoulsan’s pipeline. Abundance of viral RNA classes was calculated as in Fig. 3. All values were expressed as fold enrichment over the 12 h point. e Relative levels of the most abundant viral isoforms detected between 12 and 24 hpi were calculated as in Fig. 3, normalized using DESeq 2 and expressed as fold enrichment over the 12 h point
Fig. 7
Fig. 7
HIV-1 alternative splicing program in primary T cells at the early times of infection. Usage of SD (a) and SA (b) sites during a time course of infection of CD4+ T cells from donor 4 was based on the number of reads harbouring these particular SS involved in a splice junction and normalized with DESeq2 included in the Eoulsan’s pipeline. Usage of SD (c) and SA (d) sites was then expressed as % of the total number of viral annotated reads at each time point. Splice tree representations of HIV-1 alternative splicing regulation at 12 (e) and 24 (f) hpi were drawn on Cytoscape as in Fig. 5 based on ONT quantification of SS usage and spliced isoform levels at each time point. Only transcripts that were found at least 5 times in a sample and produced by usage of major SS were considered. Size of nodes is function of relative SS usage and size of triangles is function of transcript level as indicated by the scale. As D1 is present in all spliced isoforms, value of D1 was set at 100%. Non-coding exons (NCE) 2 and 3 are indicated
Fig. 8
Fig. 8
Detailed analysis of the balance of IS and MS isoforms during early times of CD4+ T cell infection. Relative level of IS RNA Env/Vpu 1 (a) and MS RNA Nef 2 (b) at different times post-infection of CD4+ T cells from three different donors were monitored by qPCR using the ΔΔCq method and normalized to the level of total viral RNA. Relative level of viral isoforms expressed in donor 4 determined by ONT sequencing is indicated in orange. ONT quantifications were based on the number of reads mapping to a particular isoform normalized by the total number of viral reads. c Dynamic expression of Env/Vpu 1 and Nef 2 monitored by ONT sequencing and normalized to the total number of transcripts belonging to the D1A5 branch of the tree. d Relative level of transcripts resulting from splicing between D1 and A2 without inclusion of NCE 3 (Vpr 1 and Vpr 3) was monitored by qPCR and ONT sequencing as in a. e Total number of transcripts generated by D1A2 splicing was monitored as in a. f ONT quantification of IS or MS isoforms generated by D1A2 splicing with (w/) or without NCE 3. Relative levels were normalized to the total level of D1A2 transcripts. g Relative level of transcripts resulting from splicing between D1 and A1 without inclusion of NCE 2 (Vif 1 and Vif 2) was monitored by qPCR and ONT sequencing as in a. h Total number of transcripts generated by D1A1 splicing was monitored as in a. i ONT quantification of IS or MS isoforms generated by D1A1 splicing with (w/) or without NCE 2. Relative levels were normalized to the total level of D1A1 transcripts

Similar articles

Cited by

References

    1. Wang ET, Sandberg R, Luo S, Khrebtukova I, Zhang L, Mayr C, et al. Alternative isoform regulation in human tissue transcriptomes. Nature. 2008;456(7221):470–476. - PMC - PubMed
    1. Will CL, Lührmann R. Spliceosome structure and function. Cold Spring Harb Perspect Biol. 2011;3:1–2. - PMC - PubMed
    1. De Conti L, Baralle M, Buratti E. Exon and intron definition in pre-mRNA splicing. Wiley Interdiscip Rev RNA. 2013;4:49–60. - PubMed
    1. Purcell DF, Martin MA. Alternative splicing of human immunodeficiency virus type 1 mRNA modulates viral protein expression, replication, and infectivity. J Virol. 1993;67:6365–6378. - PMC - PubMed
    1. Ocwieja KE, Sherrill-Mix S, Mukherjee R, Custers-Allen R, David P, Brown M, et al. Dynamic regulation of HIV-1 mRNA populations analyzed by single-molecule enrichment and long-read sequencing. Nucleic Acids Res. 2012;40:10345–10355. - PMC - PubMed

Publication types