Review
. 2020 Aug 17;21(1):208.
doi: 10.1186/s13059-020-02119-8.

Methods for copy number aberration detection from single-cell DNA-sequencing data

Affiliations
Review

Methods for copy number aberration detection from single-cell DNA-sequencing data

Xian F Mallory et al. Genome Biol. .

Abstract

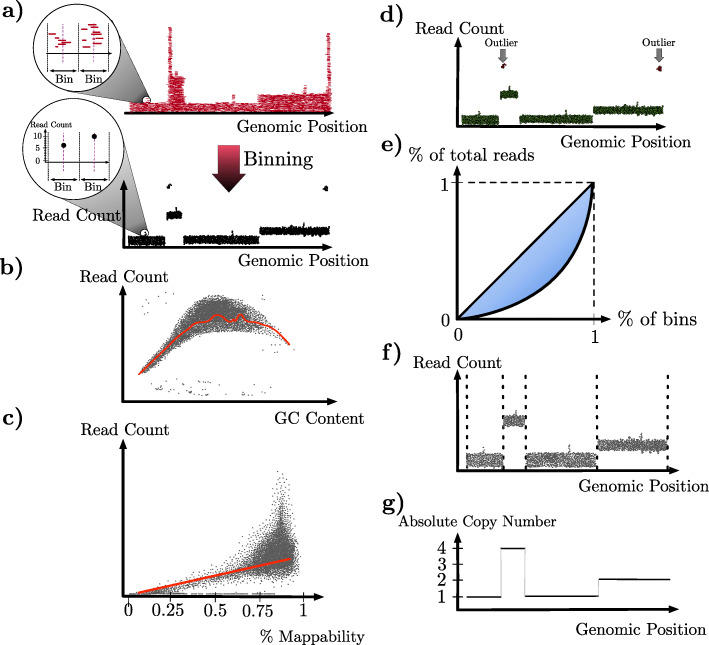
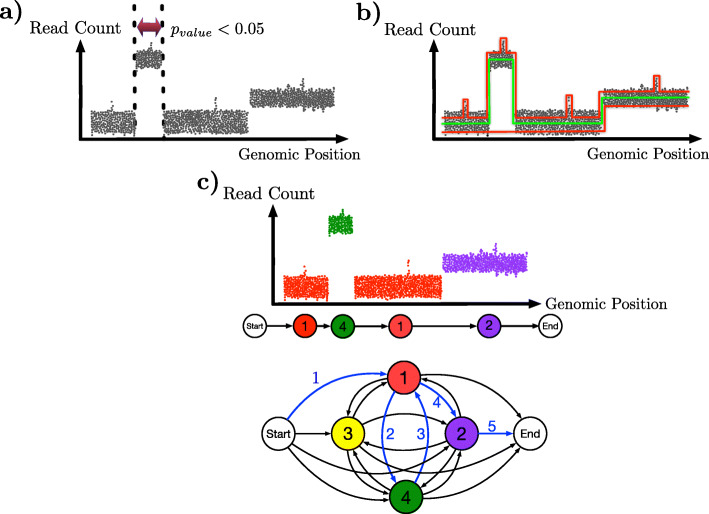
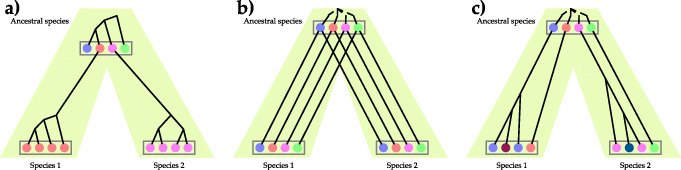
Copy number aberrations (CNAs), which are pathogenic copy number variations (CNVs), play an important role in the initiation and progression of cancer. Single-cell DNA-sequencing (scDNAseq) technologies produce data that is ideal for inferring CNAs. In this review, we review eight methods that have been developed for detecting CNAs in scDNAseq data, and categorize them according to the steps of a seven-step pipeline that they employ. Furthermore, we review models and methods for evolutionary analyses of CNAs from scDNAseq data and highlight advances and future research directions for computational methods for CNA detection from scDNAseq data.

Keywords: Copy number aberrations; Intra-tumor heterogeneity; Single-cell DNA sequencing; Tumor evolution.


Conflict of interest statement

The authors declare that they have no competing interests.

Figures

Fig. 1
Fig. 1
The seven steps in CNA detection in single-cell sequencing. a Binning. The number of reads within each bin (bottom) is computed from the pileup of the reads according to where they align (top). b GC correction. Scatter plot of read count per bin with respect to the GC content of the bin. The red curve represents the corresponding regression. c Mappability correction. Scatter plot of read count per bin with respect to the mappability of the bin. The red curve represents the corresponding regression. d Removal of outlier bins. Scatter plot of read count per bin with respect to the genomic position is shown. Outlier bins are shown in red, in contrast with the rest of the genome which are in green. e Removal of outlier cells. A Lorenz curve for the read count at all bins is shown. Gini coefficient is twice the highlighted area between the Lorenz curve and the diagonal line. The higher the Gini coefficient, the more likely the cell is an outlier. f Segmentation. Scatter plot of read count per bin with respect to the genomic position is shown. Dotted vertical lines correspond to the segments’ boundaries. g Calling the absolute copy numbers. The copy number—a non-negative integer—for each segment is determined
Fig. 2
Fig. 2
The three approaches for segmentation. In all three panels, a scatter plot of the read count per bin with respect to the genomic position of the bin is shown. a The sliding-window approach. A window is passed across the genome, and a genomic region within a window that is significantly different in terms of read count from the rest of the genome (e.g., the window defined by the two dotted vertical lines) is declared as a segment. b The objective function-based approach. Three piecewise constant functions are shown (two in red and one in green) and represent segmentation candidates. Each piece in the function corresponds to a segment, and the value of the piece corresponds to the copy number at that segment. The function in green is the optimal one with respect to the fidelity to the data and the constraint on the number of breakpoints, whereas the two in red are either over-segmented (top) or under-segmented (bottom). c The HMM-based approach. States of the HMM correspond to the different copy numbers, and a transition between two different states indicates a change in the segment. In the read-count panel, colors of the dots represent the absolute copy number of the various genomic bins (red for 1, yellow for 2, and green for 4) as obtained by parsing the data with respect to the HMM (bottom). The actual path of the state transitions is shown in the middle and highlighted with blue arrows on the HMM as well. The arrows are numbered to indicate the order of the transitions
Fig. 3
Fig. 3
Three modes of evolution of multigene families. a Concerted evolution. b Divergent evolution. c Evolution by birth and death process. (Reproduced from [95])

References

    1. Lawrence MS, Stojanov P, Polak P, Kryukov GV, Cibulskis K, Sivachenko A, Carter SL, Stewart C, Mermel CH, Roberts SA, et al. Mutational heterogeneity in cancer and the search for new cancer-associated genes. Nature. 2013;499(7457):214–8. - PMC - PubMed
    1. Burrell RA, McGranahan N, Bartek J, Swanton C. The causes and consequences of genetic heterogeneity in cancer evolution. Nature. 2013;501(7467):338–45. - PubMed
    1. Turajlic S, Sottoriva A, Graham T, Swanton C. Resolving genetic heterogeneity in cancer. Nat Rev Genet. 2019;20(7):404–16. - PubMed
    1. Yap TA, Gerlinger M, Futreal PA, Pusztai L, Swanton C. Intratumor heterogeneity: seeing the wood for the trees. Sci Trans Med. 2012;4(127):127–1012710. - PubMed
    1. Aparicio S, Mardis E. Tumor heterogeneity: next-generation sequencing enhances the view from the pathologist’s microscope: Springer; 2014. 10.1186/s13059-014-0463-6. - PMC - PubMed

Publication types

LinkOut - more resources