Transcriptome analysis of Aedes aegypti Aag2 cells in response to dengue virus-2 infection
- PMID: 32807211
- PMCID: PMC7433057
- DOI: 10.1186/s13071-020-04294-w
Transcriptome analysis of Aedes aegypti Aag2 cells in response to dengue virus-2 infection
Abstract
Background: Dengue virus (DENV) is a flavivirus transmitted by mosquitoes that is prevalent in tropical and subtropical countries and has four serotypes (DENV1-4). Aedes aegypti, as the main transmission vector of DENV, exhibits strong infectivity and transmission. With the aim of obtaining a better understanding of the Ae. aegypti-DENV interaction, the transcriptome changes in DENV-2-infected Aag2 cells were studied to describe the immune responses of mosquitoes using the Ae. aegypti Aag2 cell line as a model.
Methods: RNAseq technology was used to sequence the transcripts of the Ae. aegypti Aag2 cell line before and after infection with DENV-2. A bioinformatics analysis was then performed to assess the biological functions of the differentially expressed genes, and the sequencing data were verified by quantitative reverse transcription-polymerase chain reaction (qRT-PCR).
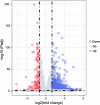
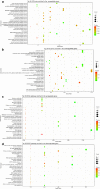
Results: The transcriptome analysis generated 8866 unigenes that were found in both groups, 225 unigenes that were only found in the infection group, and 683 unigenes that only existed in the control group. A total of 1199 differentially expressed genes, including 1014 upregulated and 185 downregulated genes, were identified. The bioinformatics analysis showed that the differentially expressed genes were mainly involved in the longevity regulating pathway, circadian rhythm, DNA replication, and peroxisome, purine, pyrimidine, and drug metabolism. The qRT-PCR verification results showed the same trend, which confirmed that the expression of the differentially expressed genes had changed, and that the transcriptome sequencing data were reliable.
Conclusions: This study investigated the changes in the transcriptome levels in the DENV-2-infected Ae. aegypti Aag2 cell line, which provides a faster and effective method for discovering genes related to Ae. aegypti pathogen susceptibility. The findings provide basic data and directions for further research on the complex mechanism underlying host-pathogen interactions.
Keywords: Aag2; Ae. aegypti; DENV2; RNAseq; Transcriptome.
Conflict of interest statement
The authors declare that they have no competing interests.
Figures


Similar articles
-
Transcriptome Analysis of Responses to Dengue Virus 2 Infection in Aedes albopictus (Skuse) C6/36 Cells.Viruses. 2021 Feb 22;13(2):343. doi: 10.3390/v13020343. Viruses. 2021. PMID: 33671824 Free PMC article.
-
Functional Verification of Differentially Expressed Genes Following DENV2 Infection in Aedes aegypti.Viruses. 2025 Jan 6;17(1):67. doi: 10.3390/v17010067. Viruses. 2025. PMID: 39861856 Free PMC article.
-
Role of Vigilin and RACK1 in dengue virus-Aedes aegypti-Wolbachia interactions.mSphere. 2025 Jan 28;10(1):e0048224. doi: 10.1128/msphere.00482-24. Epub 2024 Dec 23. mSphere. 2025. PMID: 39714171 Free PMC article.
-
Circadian regulation of dengue virus transmission and replication: insights into vector activity and viral dynamics.Front Cell Infect Microbiol. 2024 Sep 30;14:1482042. doi: 10.3389/fcimb.2024.1482042. eCollection 2024. Front Cell Infect Microbiol. 2024. PMID: 39403205 Free PMC article. Review.
-
An Experimental and Theoretical Approach to Understand Fever, DENF & its Cure.Infect Disord Drug Targets. 2021;21(4):495-513. doi: 10.2174/1871526520999200905122052. Infect Disord Drug Targets. 2021. PMID: 32888275 Review.
Cited by
-
Dengue Virus-2 Infection Affects Fecundity and Elicits Specific Transcriptional Changes in the Ovaries of Aedes aegypti Mosquitoes.Front Microbiol. 2022 Jun 23;13:886787. doi: 10.3389/fmicb.2022.886787. eCollection 2022. Front Microbiol. 2022. PMID: 35814655 Free PMC article.
-
Transcriptional response of Wolbachia-transinfected Aedes aegypti mosquito cells to dengue virus at early stages of infection.J Gen Virol. 2022 Jan;103(1):001694. doi: 10.1099/jgv.0.001694. J Gen Virol. 2022. PMID: 35006065 Free PMC article.
-
Transcriptome Analysis of Responses to Dengue Virus 2 Infection in Aedes albopictus (Skuse) C6/36 Cells.Viruses. 2021 Feb 22;13(2):343. doi: 10.3390/v13020343. Viruses. 2021. PMID: 33671824 Free PMC article.
-
Comparative phylogenetic analysis and transcriptomic profiling of Dengue (DENV-3 genotype I) outbreak in 2021 in Bangladesh.Virol J. 2023 Jun 19;20(1):127. doi: 10.1186/s12985-023-02030-1. Virol J. 2023. PMID: 37337232 Free PMC article.
-
Functional Verification of Differentially Expressed Genes Following DENV2 Infection in Aedes aegypti.Viruses. 2025 Jan 6;17(1):67. doi: 10.3390/v17010067. Viruses. 2025. PMID: 39861856 Free PMC article.
References
-
- Shepard DS, Undurraga EA, Halasa YA, Stanaway JD. The global economic burden of dengue: a systematic analysis. Lancet Infect Dis. 2016;16:935–941. - PubMed
-
- Grace TD. Establishment of four strains of cells from insect tissues grown in vitro. Nature. 1962;195:788–789. - PubMed
-
- Peleg J. Growth of arboviruses in primary tissue culture of Aedes Aegypti embryos. Am J Trop Med Hyg. 1968;17:219–223. - PubMed
MeSH terms
Grants and funding
LinkOut - more resources
Full Text Sources
Research Materials

