. 2020 Aug 17;11(1):4111.
doi: 10.1038/s41467-020-17873-3.

HIF-1α and HIF-2α differently regulate tumour development and inflammation of clear cell renal cell carcinoma in mice

Affiliations

HIF-1α and HIF-2α differently regulate tumour development and inflammation of clear cell renal cell carcinoma in mice

Rouven Hoefflin et al. Nat Commun. .

Abstract

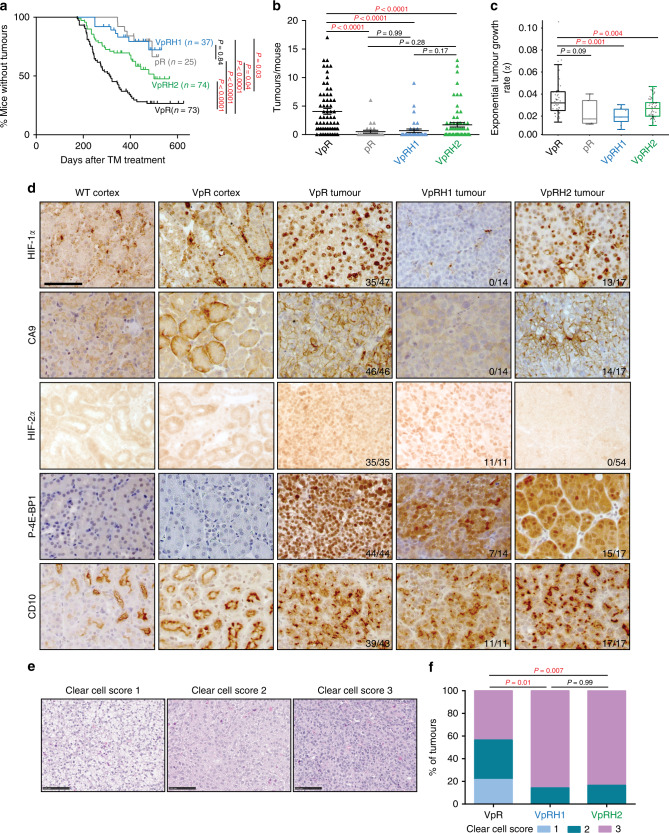
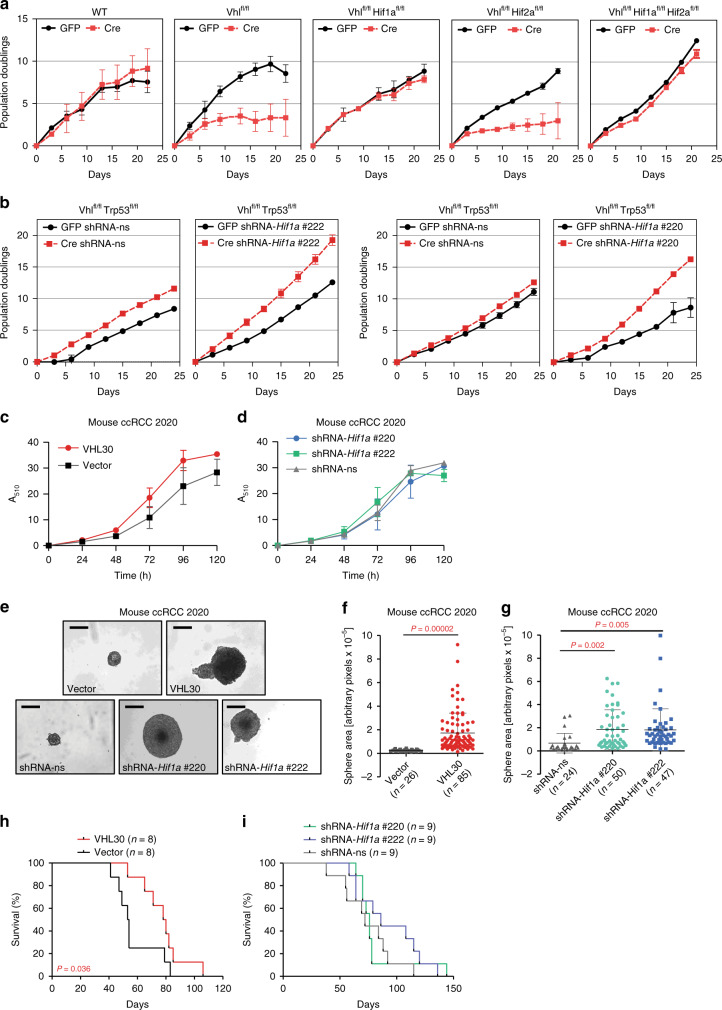
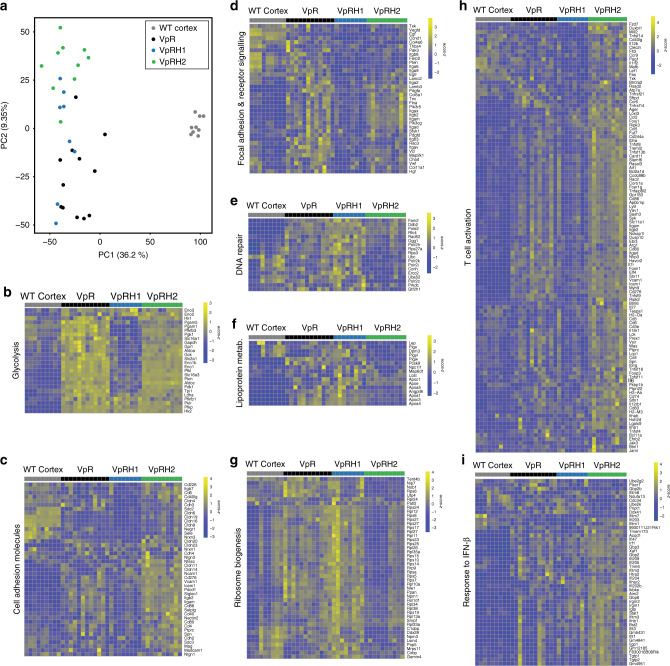
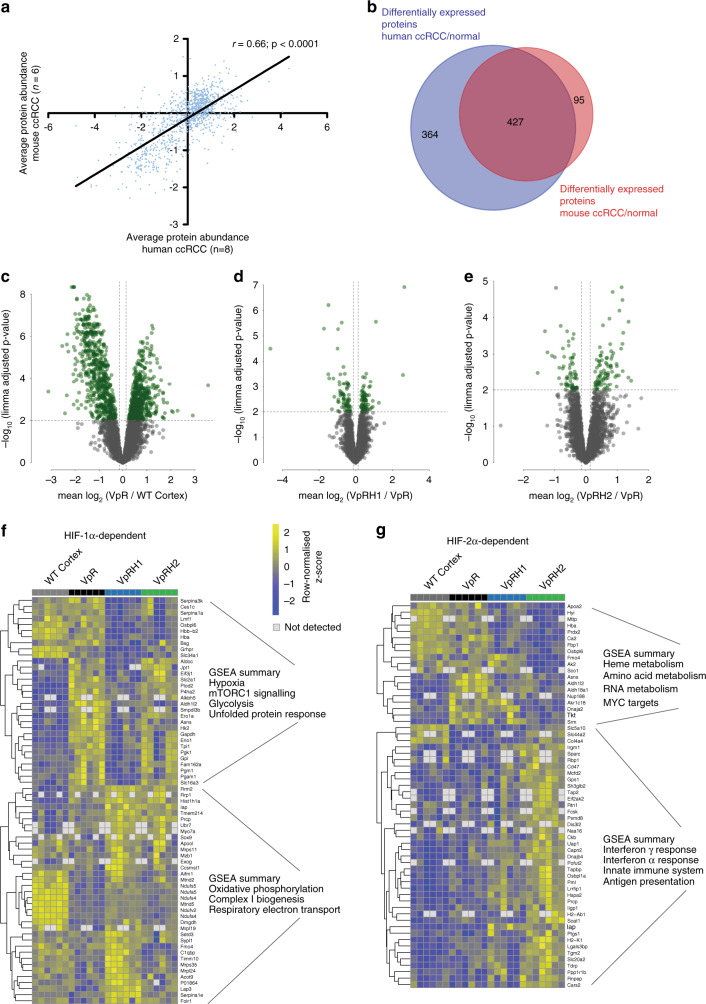
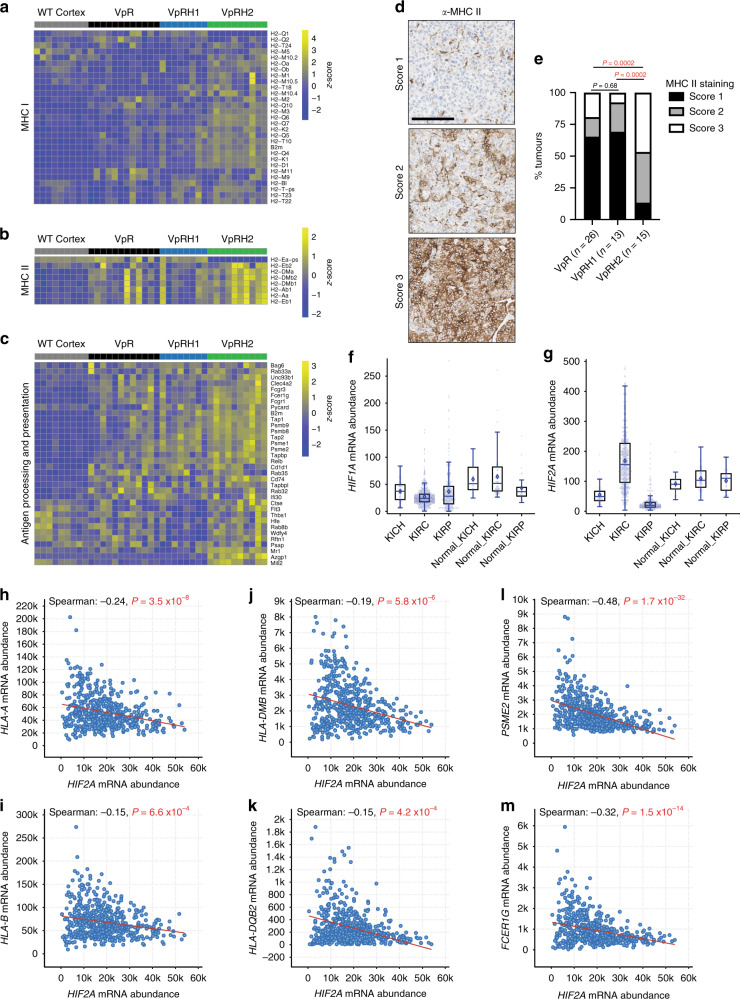
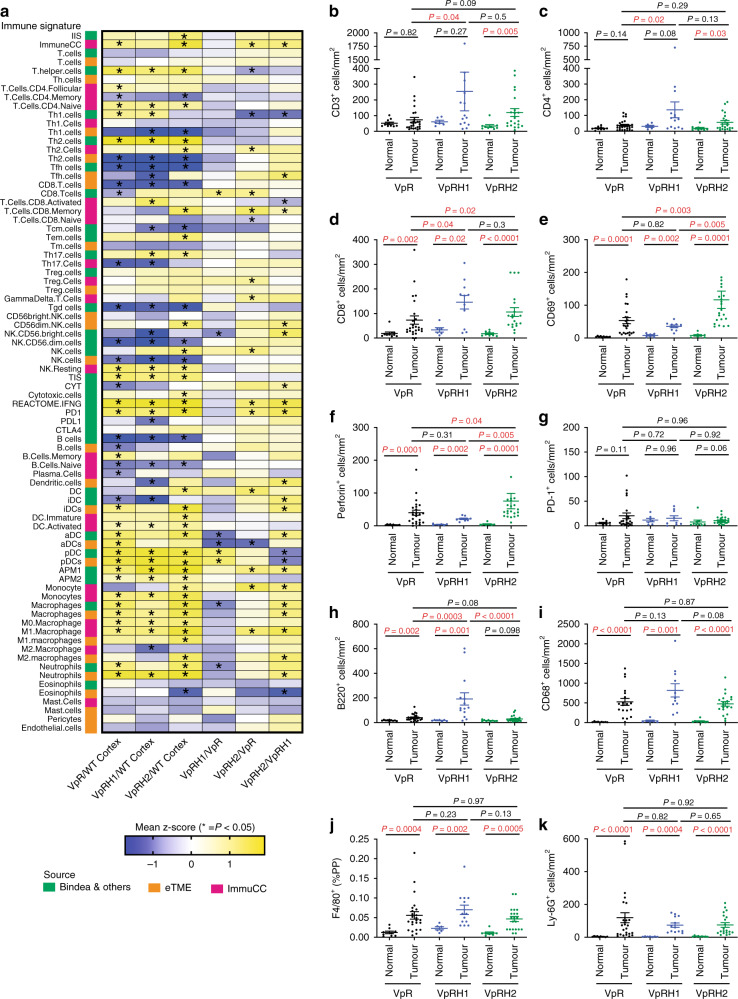
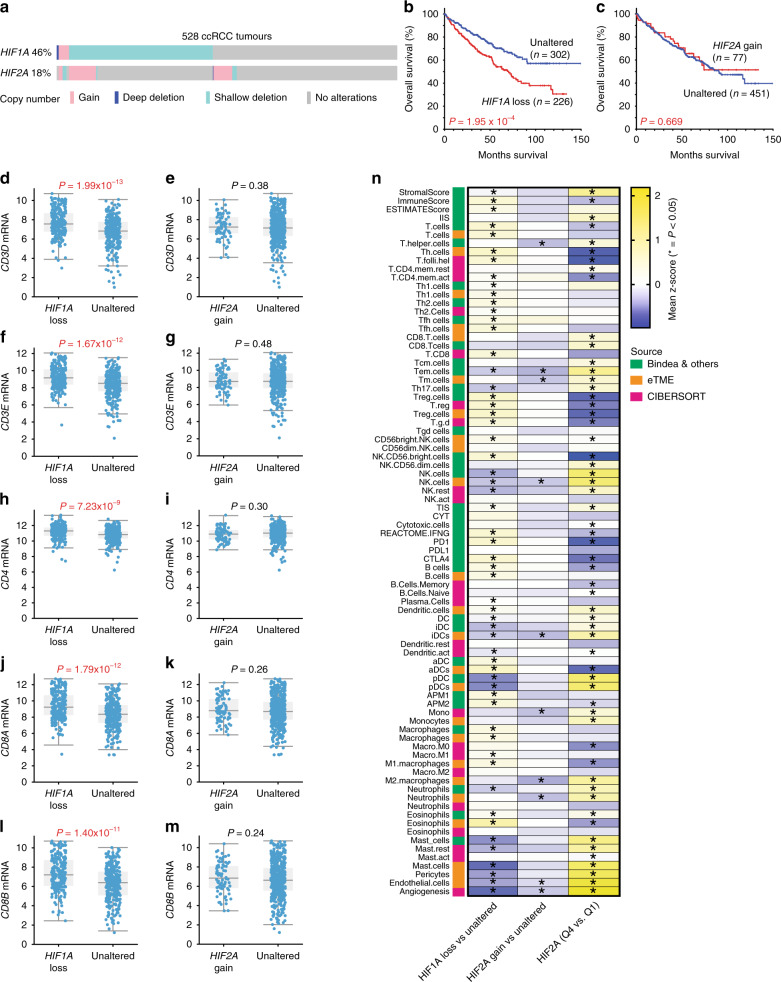
Mutational inactivation of VHL is the earliest genetic event in the majority of clear cell renal cell carcinomas (ccRCC), leading to accumulation of the HIF-1α and HIF-2α transcription factors. While correlative studies of human ccRCC and functional studies using human ccRCC cell lines have implicated HIF-1α as an inhibitor and HIF-2α as a promoter of aggressive tumour behaviours, their roles in tumour onset have not been functionally addressed. Herein we show using an autochthonous ccRCC model that Hif1a is essential for tumour formation whereas Hif2a deletion has only minor effects on tumour initiation and growth. Both HIF-1α and HIF-2α are required for the clear cell phenotype. Transcriptomic and proteomic analyses reveal that HIF-1α regulates glycolysis while HIF-2α regulates genes associated with lipoprotein metabolism, ribosome biogenesis and E2F and MYC transcriptional activities. HIF-2α-deficient tumours are characterised by increased antigen presentation, interferon signalling and CD8+ T cell infiltration and activation. Single copy loss of HIF1A or high levels of HIF2A mRNA expression correlate with altered immune microenvironments in human ccRCC. These studies reveal an oncogenic role of HIF-1α in ccRCC initiation and suggest that alterations in the balance of HIF-1α and HIF-2α activities can affect different aspects of ccRCC biology and disease aggressiveness.


Conflict of interest statement

The authors declare no potential conflicts of interest.

Figures

Fig. 1
Fig. 1. ccRCC formation is strongly dependent on Hif1a and only moderately affected by Hif2a deletion.
a Tumour onset in cohorts of pR, VpR, VpRH1, and VpRH2 mice. P values were calculated by two-sided log-rank Mantel–Cox test. b Number of tumours per mouse at the time of sacrifice based on μ-CT imaging (VpR n = 65, pR n = 25, VpRH1 n = 36 and VpRH2 n = 65 mice). Mean ± SEM are shown, P values were calculated by Dunn’s multiple comparisons test. c Tumour growth rates based on μ-CT imaging (VpR n = 48, pR n = 5, VpRH1 n = 7 and VpRH2 n = 56 tumours). Box–whisker plots depict median, bounded by Q1 (25% lower quartile) and Q3 (75% upper quartile) and whiskers depict 1.5 times the Q3-Q1 interquartile range. P values were calculated by two-sided Student’s t test without adjustment for multiple comparisons. d Representative immunohistochemical stainings for the indicated antibodies in samples from WT cortex, a non-tumour region of VpR cortex, VpR, VpRH1, and VpRH2 tumours. All panels are the same magnification, scale bar = 50 μm. The number of positive tumours/number of tumours examined are indicated. e Representative examples of the histological appearance of tumours assigned clear cell scores of 1, 2, or 3. Scale bars = 100 μm. f Distribution of clear cell scores between VpR (n = 10 mice, 23 tumours), VpRH1 (n = 8 mice, 14 tumours) and VpRH2 (n = 9 mice, 18 tumours) tumour cohorts. P values were calculated using the two-sided Mann–Whitney U test without adjustments for multiple comparisons.
Fig. 2
Fig. 2. HIF-1α is dispensable for cellular proliferation and for allograft tumour formation.
a 3T3 proliferation assays of MEFs derived from mice of the indicated genotypes infected with adenoviruses expressing GFP or Cre. Mean ± std. dev. are derived from three independent cultures. b 3T3 proliferation assays of MEFs derived from Vhlfl/flTrp53fl/fl mice infected with non-silencing shRNA (shRNA-ns) or shRNA against Hif1a (shRNA-Hif1a #1 and shRNA-Hif1a #2), followed by infection with adenoviruses expressing GFP or Cre. Mean ± std. dev. are derived from three independent cultures. c, d Proliferation assays of mouse ccRCC cell line 2020 expressing empty vector control or human pVHL30 c or non-silencing shRNA (shRNA-ns) or shRNA against Hif1a (shRNA-Hif1a #1 and shRNA-Hif1a #2) d. Mean ± std. dev. are derived from two independent experiments each with replicates of six cultures. eg Representative images (scale bars depict 200 μm) e and size distributions f, g of spheres formed by the cells described in c, d when grown in non-adherent cell culture plates. Mean ± std. dev. of the total number of colonies pooled from three independent experiments are shown, P values were calculated by two-sided Student’s t test. h, i Survival of mice following subcutaneous allograft tumour assays of the cells described in c into SCID-Beige mice. P values were calculated by two-sided log-rank Mantel–Cox test.
Fig. 3
Fig. 3. HIF-1α and HIF-2α deletion affect different transcriptional programmes and inflammatory responses.
a Principal component analysis of RNA sequencing of WT Cortex and VpR, VpRH1, and VpRH2 tumours. Gene expression heatmaps for selected differentially regulated genes from the indicated GSEA terms glycolysis (b), cell adhesion molecules (c), focal adhesion and receptor signalling (d), DNA repair (e), lipoprotein metabolism (f), ribosome biogenesis (g), T-cell activation (h), and response to IFN-β (i). Rows represent row-normalised z-scores of mRNA abundance, each column represents an individual sample from WT cortex or VpR, VpRH1, and VpRH2 tumours. Source data is provided in Supplementary Data 1 and 2.
Fig. 4
Fig. 4. Proteomic analyses of the effects of HIF-1α and HIF-2α deletion in mouse ccRCCs.
a Correlation of protein abundance in mouse and human ccRCC samples. Each dot represents a unique pair of orthologous proteins between the two species. Spearmann’s correlation coefficient is depicted. b Venn diagram showing the overlap of differentially expressed proteins derived from comparison of mouse ccRCC with WT cortex and human ccRCC with normal kidney. Volcano plots showing differentially expressed proteins (green dots) between VpR and WT cortex (c), VpRH1 and VpR (d), and VpRH2 and VpR (e). Protein expression heatmaps showing differentially expressed proteins between VpRH1 and VpR (f) and VpRH2 and VpR (g) as well as a summary of GSEA terms associated with the down- and upregulated proteins. Rows represent row-normalised z-scores of protein abundance, each column represents an individual sample from WT cortex or VpR, VpRH1, and VpRH2 tumours. Source data is provided in Supplementary Data 3.
Fig. 5
Fig. 5. HIF-2α influences the expression of MHC class I and II genes.
Gene expression heatmaps for MHC class I (a), class II (b), and other antigen processing and presenting (c) genes. Rows represent row-normalised z-scores of mRNA abundance, each column represents an individual sample from WT cortex or VpR, VpRH1, and VpRH2 tumours. Source data is provided in Supplementary Data 1 and 2. d Examples of different scores for MHC class II immunohistochemical staining. All panels are the same magnification, scale bar = 100 μm. e Distribution of MHC class II staining scores in the indicated (n) number of VpR, VpRH1, and VpRH2 tumours. P values are derived from the two-sided Mann–Whitney U test without adjustments for multiple comparisons. f, g Relative HIF1A and HIF2A mRNA abundance in TCGA datasets of human chromophobe (KICH, n = 66), clear cell (KIRC, n = 533), and papillary (KIRP, n = 290) renal cell carcinomas and associated normal renal tissues (Normal_KICH n = 25, Normal_KIRC n = 72, Normal_KIRP n = 32). Box–whisker plots depict median, bounded by Q1 (25% lower quartile) and Q3 (75% upper quartile) and whiskers depict 1.5 times the Q3–Q1 interquartile range. Spearman’s correlation analyses between HIF2A mRNA abundance and mRNA abundance of two MHC class I (h, i), class II (j, k), and antigen processing/presentation (l, m) genes in ccRCC (TCGA KIRC dataset). Source data is provided in Supplementary Data 4.
Fig. 6
Fig. 6. Deconvolution of the immune microenvironment of VpR, VpRH1, and VpRH2 tumours.
a Summary of immune deconvolution results using ssGSEA with the Bindea et al. and eTME gene signatures, as well as the ImmuCC method. Pairwise comparisons of the expression levels of each immune cell-specific gene set between WT cortex, VpR, VpRH1, and VpRH2 tumours are shown. Columns depict the comparison between the genotypes and rows depict the gene set. Heatmap colours represent the mean differences in the z-scores. Comparisons marked with an asterisk show P values < 0.05 between each genotype, two-sided Mann–Whitney U test without multiple comparisons. Gene signatures and source data with z-scores and P values are provided in Supplementary Data 5 and 6, respectively. bk Quantification of the densities of immunohistochemically positive cells stained with the indicated antibodies in unaffected normal renal tissue and VpR (n = 26), VpRH1 (n = 14), and VpRH2 (n = 21) tumours. Mean ± SEM are shown, P values for pairwise comparisons were calculated by one-way ANOVA followed by two-sided Mann–Whitney U test without adjustments for multiple comparisons.
Fig. 7
Fig. 7. HIF1A copy number loss and HIF2A mRNA expression levels correlate with altered immune microenvironments in human ccRCC.
a Oncoprint showing the genetic alterations in HIF1A and HIF2A in human ccRCC tumours based on GISTIC. b, c Kaplan–Meier curves showing overall survival of ccRCC patients whose tumours exhibit loss of one or two copies of HIF1A (loss) or gain of a copy of HIF2A (gain) versus patients without these copy number alterations (Unaltered). P values are derived from the two-sided log-rank test. mRNA abundance (log2 transformed, normalised, RNA-seq v2 RSEM) of CD3D (d, e), CD3E (f, g), CD4 (h, i), CD8A (j, k), CD8B (l, m) in HIF1A loss and HIF2A gain ccRCC tumours compared to Unaltered tumours. P values are derived from two-sided Student’s t test. n Summary of immune deconvolution results in ccRCC (TCGA KIRC dataset) using ssGSEA with the Bindea et al. and eTME gene signatures, as well as the CIBERSORT method. Depicted are pairwise comparisons of the expression levels of each gene set between HIF2A gain (n = 65) and HIF2A diploid (Unaltered, n = 349), between HIF1A loss (n = 188) and HIF1A diploid (Unaltered, n = 220) tumours and between tumours in the top quartile (Q4) and the lowest quartile (Q1) of HIF2A expression. Columns depict the comparison between the genotypes and rows depict the gene set. Heatmap colours represent the mean differences in the z-scores. Comparisons marked with an asterisk show P values < 0.05 between each genotype, two-sided Mann–Whitney U test without multiple comparisons. Source data with z-scores and P values is provided in Supplementary Data 6.

References

    1. Bray F, et al. Global cancer statistics 2018: GLOBOCAN estimates of incidence and mortality worldwide for 36 cancers in 185 countries. CA Cancer J. Clin. 2018;68:394–424. - PubMed
    1. Frew IJ, Moch H. A clearer view of the molecular complexity of clear cell renal cell carcinoma. Annu. Rev. Pathol. Mech. Dis. 2015;10:263–289. - PubMed
    1. Gerlinger M, et al. Genomic architecture and evolution of clear cell renal cell carcinomas defined by multiregion sequencing. Nat. Genet. 2014;46:225–233. - PMC - PubMed
    1. Turajlic S, et al. Deterministic evolutionary trajectories influence primary tumor growth: TRACERx renal. Cell. 2018;173:595–610.e11. - PMC - PubMed
    1. Mitchell TJ, et al. Timing the landmark events in the evolution of clear cell renal cell cancer: TRACERx renal. Cell. 2018;173:611–623.e17. - PMC - PubMed

Publication types

MeSH terms

Substances