. 2020 Aug 17;11(1):4133.
doi: 10.1038/s41467-020-17955-2.

CTCF-mediated chromatin looping in EGR2 regulation and SUZ12 recruitment critical for peripheral myelination and repair

Affiliations

CTCF-mediated chromatin looping in EGR2 regulation and SUZ12 recruitment critical for peripheral myelination and repair

Jincheng Wang et al. Nat Commun. .

Abstract

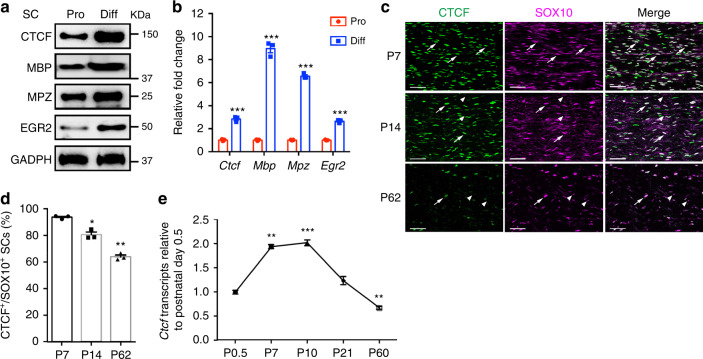
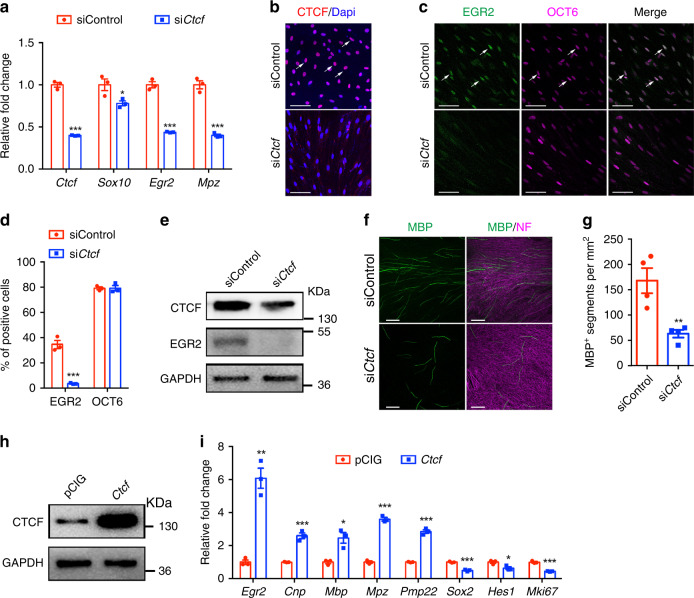
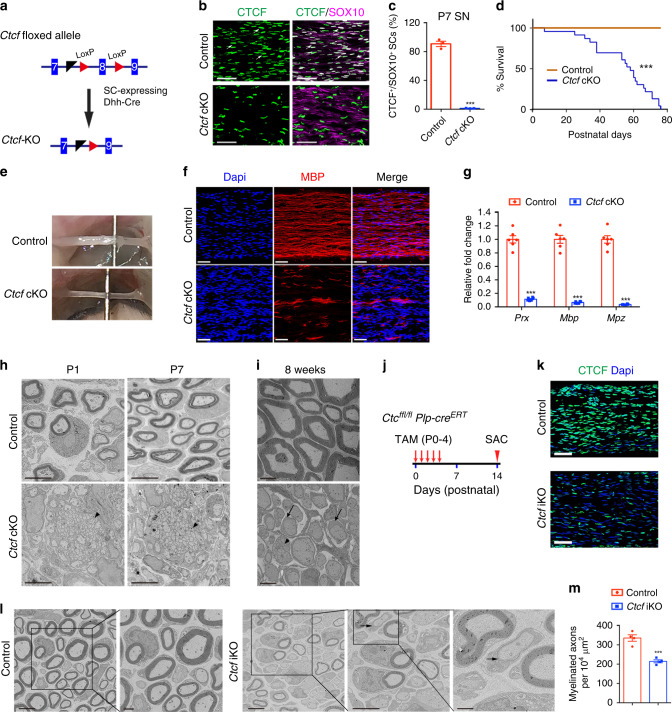
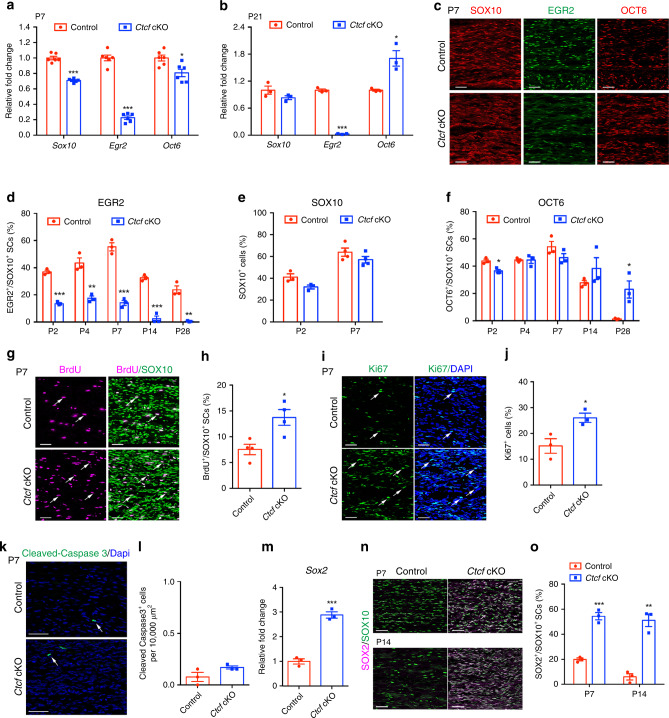
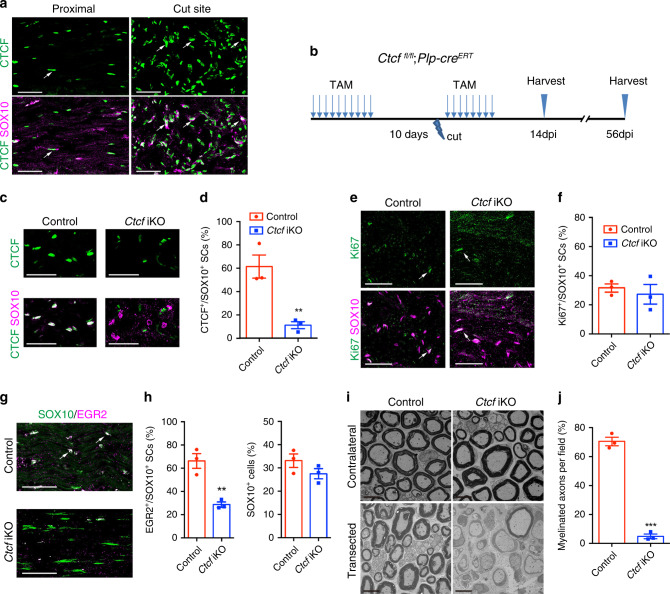
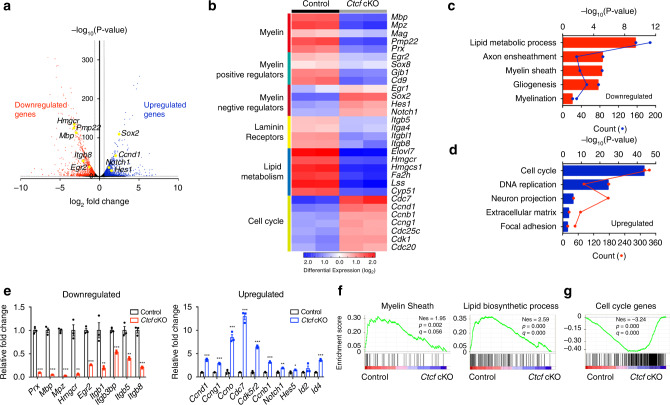
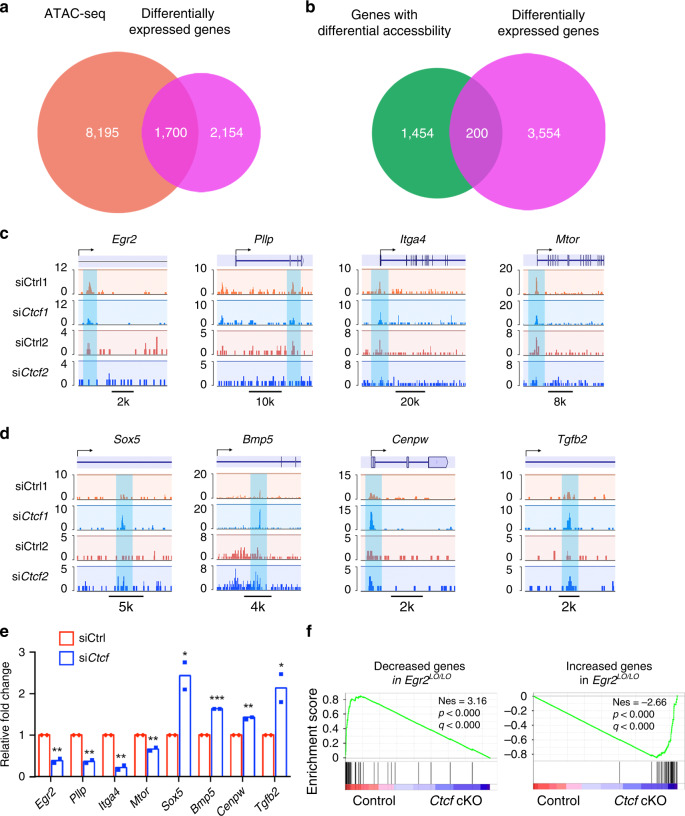
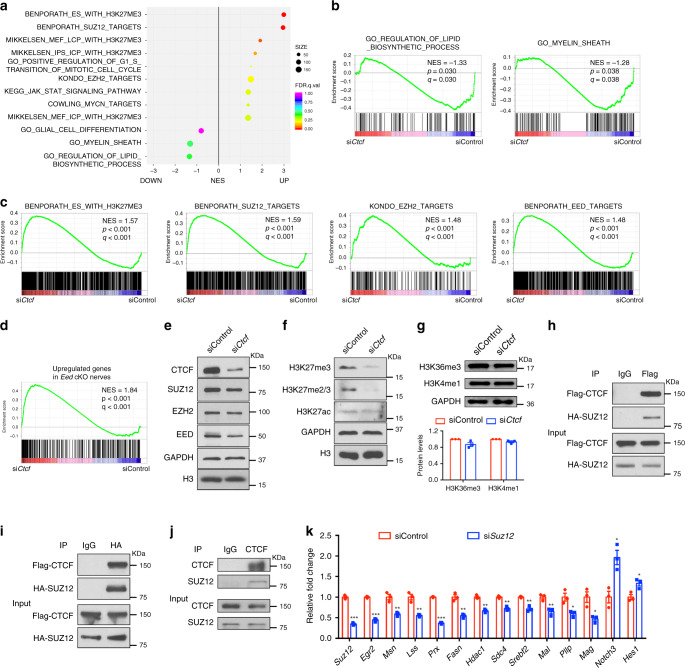
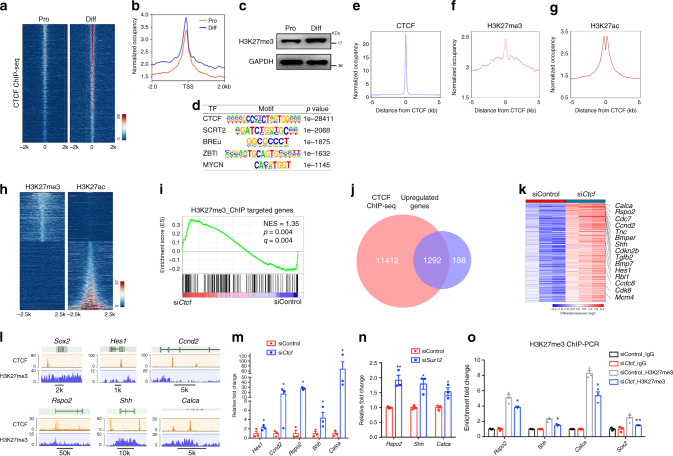
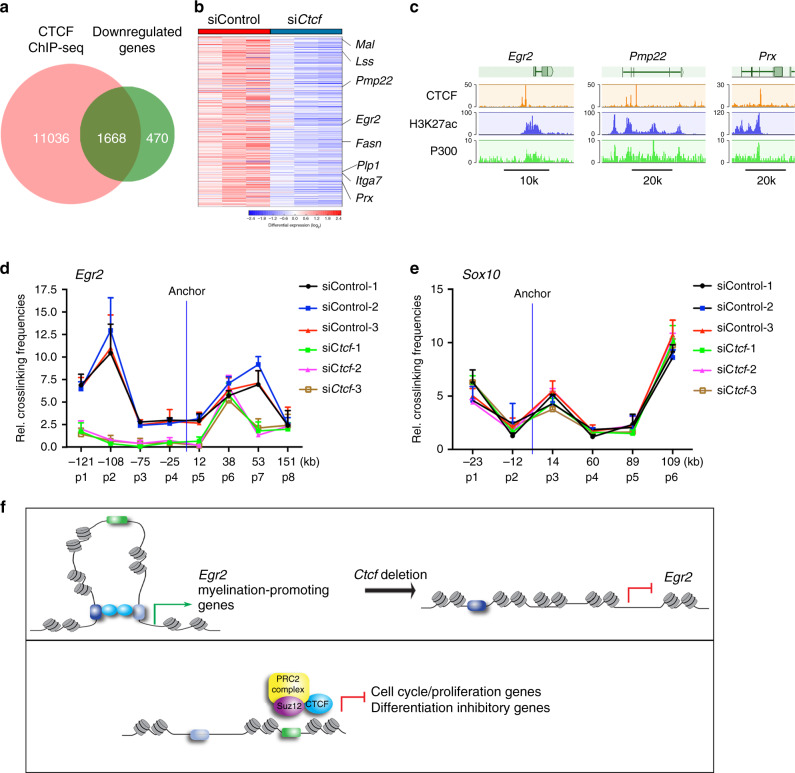
Chromatin organization is critical for cell growth, differentiation, and disease development, however, its functions in peripheral myelination and myelin repair remain elusive. In this report, we demonstrate that the CCCTC-binding factor (CTCF), a crucial chromatin organizer, is essential for Schwann cell myelination and myelin regeneration after nerve injury. Inhibition of CTCF or its deletion blocks Schwann cell differentiation at the pro-myelinating stage, whereas overexpression of CTCF promotes the myelination program. We find that CTCF establishes chromatin interaction loops between enhancer and promoter regulatory elements and promotes expression of a key pro-myelinogenic factor EGR2. In addition, CTCF interacts with SUZ12, a component of polycomb-repressive-complex 2 (PRC2), to repress the transcriptional program associated with negative regulation of Schwann cell maturation. Together, our findings reveal a dual role of CTCF-dependent chromatin organization in promoting myelinogenic programs and recruiting chromatin-repressive complexes to block Schwann cell differentiation inhibitors to control peripheral myelination and repair.


Conflict of interest statement

The authors declare no competing interests.

Figures

Fig. 1
Fig. 1. CTCF expression changes during SC-lineage progression.
a Western blots for CTCF, MBP, MPZ, and EGR2 in proliferating and differentiated rat SC cultures. GAPDH served as a loading control. n = 2 independent experiments. b Relative qPCR expression of Ctcf, Mbp, Mpz, and Egr2 in proliferating and differentiated rat SC cultures. Data are presented as means ± SEM., ***P < 0.001, n = 3 independent experiments; two-tailed unpaired Student’s t-test, P(Ctcf) = 0.00021, P(Mbp) = 2.8E-05, P(Mpz) = 1.7E-06, P(Egr2) = 3.9E-05. c Colocalization of CTCF with SOX10 in SC nuclei from mice at P7, P14, and P62 evaluated by immunofluorescence labeling. Representative images are shown. n = 3 nerve tissues at each time point. Arrows indicate SOX10+/CTCF+ SCs; arrowheads indicate SOX10+/CTCF SCs. Scale bars: 50 μm. d The percentage of CTCF+ nuclei in SCs (SOX10+) in sciatic nerves from P7, P14, and P62 mice. n = 3 control tissues at each time point. Data are presented as means ± SEM., *P < 0.05, **P < 0.01; n = 3 nerve tissues at each time point; one-way ANOVA with multiple comparisons test. P(P14) = 0.0392, P(P62) = 0.0052. e Relative qPCR expression of Ctcf in mouse sciatic nerves at various developmental stages. Data are presented as means ± SEM., **P < 0.01, ***P < 0.001; n = 3 nerve tissues at each time point; one-way ANOVA with multiple comparisons test, P(P7) = 0.0067, P(P10) = 0.0004, P(P21) = 0.1503, P(P60) = 0.0077. Source data are provided as a Source Data file.
Fig. 2
Fig. 2. CTCF is critical for rat SC differentiation in vitro.
a qRT-PCR analysis of Ctcf, Sox10, Egr2, and Mpz expression in rat SCs transfected with control nontargeting siRNA and siCtcf for 24 h and induced to differentiate for 9 h. n = 3 independent experiments, P(Ctcf) = 3.03E-05, P(Sox10) = 0.0433, P(Egr2) = 0.000107, P(Mpz) = 0.000293. b–d Rat SCs were transfected with control siRNA or siCtcf for 24 h and induced to differentiate for 9 h and CTCF- (b), EGR2- and OCT6-positive (c) cells were visualized by immunofluorescence microscopy and d quantified; n = 3 independent experiments. Arrows indicate CTCF+ or EGR2+/OCT6+ SCs. Scale bars: 50 µm. n = 3 independent experiments, P(EGR2) = 0.00069, P(OCT6) = 0.99. e Western blots for CTCF and EGR2 in co-cultures of rat DRGs and SCs treated with control siRNA or siCtcf. GAPDH served as a loading control. n = 4 independent experiments. f Rat SCs treated with control siRNA or siCtcf were seeded onto rat DRGs. After 10 days, co-cultures were immunostained for MBP and neurofilament-M. Images are representative of n = 4 independent experiments. Scale bars: 100 μm. g Quantification of the number of MBP+ segments per mm2 of area in myelinating co-cultures of DRGs and SCs treated with control siRNA or siCtcf. n = 4 independent experiments, P = 0.0068. h Western blots for CTCF in rat Schwann cells induced to differentiate following transfection with control or CTCF expression vectors. n = 2 independent experiments. i qRT-PCR quantification of differentiation regulators and negative regulators in rat SCs induced to differentiate following transfection with control or CTCF expression vectors. n = 3 independent experiments, P(Egr2) = 0.0012, P(Cnp) = 0.00068, P(Mbp) = 0.011, P(Mpz) = 2.9E-05, P(Pmp22) = 6.7E-05, P(Sox2) = 0.00026, P(Hes1) = 0.028, P(Mki67) = 0.00024. Data are presented as means ± SEM., *P < 0.05, **P < 0.01, ***P < 0.001, two-tailed unpaired Student’s t-test. Source data are provided as a Source Data file.
Fig. 3
Fig. 3. CTCF is required for peripheral nerve ensheathment.
a Excised exon 8 of the floxed Ctcf allele by Dhh-Cre. b Co-labeling of CTCF with SOX10 in control and mutant sciatic nerves at P7 (n = 3 animals/genotype). Arrows indicate SOX10+/CTCF+ SCs. Scale bars: 50 μm. c The percentage of CTCF+ nuclei in SCs (SOX10+) from control and Ctcf cKO sciatic nerves at P7. n = 3 animals/genotype, P = 1.73E-05. d Survival curves of control and Ctcf cKO mice. n = 25 for control and n = 23 for Ctcf cKO mice, ***P < 0.001. e Representative photographs of sciatic nerves from P13 control and Ctcf cKO mice. n = 3 animals/genotype. f Immunofluorescence labeling of MBP (red) in P7 control and Ctcf cKO sciatic nerves. n = 3 animals/genotype. Scale bars: 50 μm. g The mRNA levels of myelin-related genes in P7 control and Ctcf cKO sciatic nerves. n = 6 animals/genotype. P(Prx) = 1.9E-08, P(Mbp) = 2.0E-08, P(Mpz) = 8.5E-09. h, i Ultrastructure of control and Ctcf cKO sciatic nerves at (h) P1 and P7 and at (i) 8 weeks. n = 3 animals/genotype. Arrows and arrowheads indicate immature SCs and unsorted axons, respectively. Scale bars: 4 μm. j A diagram showing the tamoxifen (TAM) administration scheme. k Immunofluorescent labeling of CTCF (green) nuclei in control and Ctcf iKO sciatic nerves at P14. Scale bars: 50 μm. n = 3 animals/genotype. l EM images of P14 sciatic nerves from control and Ctcf iKO mice. n = 4 animals/genotype. Arrow indicates myelin membrane. Scale bars: 4 μm, and 1 μm in the inset on the right panel. m Myelinated axon numbers 10−4 μm−2 sections of P14 sciatic nerves from control and Ctcf iKO mice. n = 4 animals/genotype, P = 0.0006. Data are presented as means ± SEM., ***P < 0.001; Statistical analyses performed using two-tailed unpaired Student’s t-test; Log-rank test used for survival curve. Source data are provided as a Source Data file.
Fig. 4
Fig. 4. CTCF deletion in SCs inhibits SC differentiation and myelination.
a, b qRT-PCR analysis of promyelinating transcriptional regulators in control and Ctcf cKO mice sciatic nerves at a P7 and b P21. n = 6 animals/genotype for P7 and n = 3 animals/genotype for P21, a P(Sox10) = 3.03E-07, P(Egr2) = 6.92E-09, P(Oct6) = 0.0105; b P(Sox10) = 0.171, P(Egr2) = 4.97E-06, P(Oct6) = 0.0152. c Immunolabeling of SOX10, EGR2, and OCT6 in P7 control and Ctcf cKO sciatic nerves (n = 3 animals/genotype). Scale bars: 50 μm. d–f Quantification of d EGR2+/SOX10+ cells, e SOX10+ cells, and f OCT6+/SOX10+ cells at different stages. n = 4 animals/genotype for SOX10 at P7, n = 3 animals/genotype for others, d P(P2) = 7.27E-05, P(P4) = 0.00331, P(P7) = 0.000294, P(P14) = 0.00023, P(P28) = 0.00126; e P(P2) = 0.056, P(P7) = 0.20; f P(P2) = 0.011, P(P4) = 0.99, P(P7) = 0.18, P(P14) = 0.27, P(P28) = 0.026. g Immunolabeling and h analysis of BrdU and SOX10 in P7 control and Ctcf cKO sciatic nerves. Arrows indicate SOX10+/BrdU+ SCs. Scale bars: 50 μm. n = 4 animals/genotype, P = 0.014. i Immunolabeling and j quantification of Ki67 in P7 control and Ctcf cKO sciatic nerves. Arrows indicate Ki67+ cells. Scale bars: 50 μm. n = 3 animals/genotype, P = 0.03. k Immunolabeling and l quantification of cleaved-caspase 3 in P7 control and Ctcf cKO sciatic nerves. Arrows indicate Cleaved-Caspase 3+ SCs. Scale bars: 100 μm. n = 3 animals/genotype, P = 0.12. m qPCR analysis of Sox2 in P7 control and Ctcf cKO sciatic nerves. n = 3 animals/genotype, P = 0.00032. n, o Immunolabeling (n) and quantification of SOX2 and SOX10 (o) in P7 and P14 control and Ctcf cKO sciatic nerves. Scale bars: 50 μm. n = 3 animals/genotype, P(P7) = 0.0004, P(P14) = 0.0013. Data are presented as means ± SEM., *P < 0.05, **P < 0.01, ***P < 0.001, two-tailed unpaired Student’s t-test. Source data are provided as a Source Data file.
Fig. 5
Fig. 5. CTCF is required for SC differentiation during nerve repair.
a Immunolabeling for CTCF and SOX10 in uninjured (proximal) and regenerating region of sciatic nerves of control mice at 14 dpi (n = 3 animals/genotype). Arrows indicate SOX10+/CTCF+ SCs. Scale bars: 50 μm. b A diagram showing the nerve transection scheme. Mice were treated with TAM via i.p. for 10 days, after 10 days, nerves were cut, and mice were then given TAM for 8 days, and nerves were analyzed at dpi 14 and 56. c Immunolabeling for CTCF and SOX10 in regenerating regions of control and Ctcf iKO sciatic nerves 14 dpi (n = 3 animals/genotype). Scale bars: 50 μm. d Proportion of CTCF+ SCs in the regenerating regions of 14 dpi control and Ctcf iKO sciatic nerves (n = 3 animals/genotype). P = 0.0083. e Immunolabeling for Ki67 and SOX10 in the regenerating regions of 28 dpi control and Ctcf iKO sciatic nerves (n = 2 animals/genotype). Arrows indicate representative SOX10+/Ki67+ SCs. Scale bars: 50 μm. f Proportion of Ki67+ SCs in the regenerating regions of 14 dpi control and Ctcf iKO sciatic nerves (n = 3 animals/genotype). P = 0.58. g Immunolabeling of SOX10 and EGR2 in the regenerating regions of 14 dpi control and Ctcf iKO sciatic nerves (n = 3 animals/genotype). Arrows indicate representative SOX10+/EGR2+ SCs. Scale bars: 50 μm. h Proportion of (left) EGR2+ over SOX10+ cells and (right) SOX10+ cells in the regenerating regions of 14 dpi control and Ctcf iKO sciatic nerves (n = 3 animals/genotype). P(left) = 0.005, P(right) = 0.19. i EM images of transverse sections of control and Ctcf iKO 8 weeks after transection (n = 3 animals/genotype). Scale bar: 6 μm. j Proportion of myelinated axons from EM images of control vs. Ctcf iKO 8 weeks after injury (n = 3 animals/genotype). P = 4.26E-05. Data are presented as means ± SEM., **P < 0.01, ***P < 0.001, two-tailed unpaired Student’s t-test. Source data are provided as a Source Data file.
Fig. 6
Fig. 6. CTCF regulates the transcriptional program of SC differentiation.
a Volcano plot of transcriptome profiles of control and Ctcf cKO sciatic nerves (n = 2 animals/genotype). Red and blue dots represent significantly downregulated and upregulated genes in Ctcf cKO nerves compared to the control, respectively (P < 0.05, fold-change > 1.5). b Heatmap of representative genes and their categories differentially expressed in control and Ctcf cKO sciatic nerves (n = 2 animals/genotype). cd Bar plots of gene ontology analysis of genes c downregulated and d upregulated genes in Ctcf cKO sciatic nerves compared with control nerves. Each dot (connected by lines) represents the gene count of the corresponding biological function categories. n = 2 independent tissues/genotype. e qPCR analysis of genes related to SC development that are decreased (left) and increased (right) in Ctcf cKO sciatic nerves relative to control. f GSEA enrichment scores for myelin sheath (left) and lipid biosynthetic process (right) gene sets in control and Ctcf cKO sciatic nerves. g GSEA enrichment scores for cell-cycle gene sets in control and Ctcf cKO sciatic nerves. Data are presented as means ± SEM., ***P < 0.001, **P < 0.01, *P < 0.05, n = 3 animals/genotype; two-tailed unpaired Student’s t-test, P(Prx) = 2.6e-05, P(Mbp) = 4.9E-05, P(Mpz) = 5.3E-06, P(Hmgcr) = 0.0014, P(Egr2) = 8.6E-05, P(Itgb1) = 0.008, P(Itgb3bp) = 0.00022, P(Itgb5) = 0.0021, P(Itgb8) = 0.00017, P(Ccnd1) = 7.4E-05, P(Ccng1) = 5.1E-05, P(Ccno) = 0.0004, P(Cdc7) = 6.4E-05, P(Cdk5r2) = 1.6E-05, P(Ccnb1) = 3.2E-05, P(Notch1) = 0.00102, P(Hes5) = 0.028, P(Id2) = 0.23, P(Id4) = 3.3E-05. Source data are provided as a Source Data file.
Fig. 7
Fig. 7. CTCF regulates chromatin accessibility during SC differentiation.
a, b Venn diagram showing the overlap between the genes located in open chromatin sites in rat SCs (a) or the genes with differential chromatin accessibility (b) by ATAC-seq with genes differentially expressed genes between control and Ctcf cKO sciatic nerves. c, d Representative ATAC-seq signals around the Egr2 MSE and myelination-related gene loci (c), as well as SC negative- or proliferation-related genes (d) in control or siCtcf-treated rat SCs, n = 2 biological replicates for control and siCtcf SCs. e Relative fold-change of ATAC-seq peaks in panel c and d. n = 2 biological replicates for control and siCtcf SCs. f GSEA enrichment scores for genes downregulated (left) or upregulated (right) genes in Egr2 Lo/Lo nerves from published data. NES, normalized enrichment score. Data are presented as means ± SEM., *P < 0.05, **P < 0.01, ***P < 0.001; one-tailed unpaired Student’s t-test, P(Egr2) = 0.0033, P(Pllp) = 0.0014, P(Itga4) = 0.0021, P(Mtor) = 0.0053, P(Sox5) = 0.024, P(Bmp) = 4E-07, P(Cenpw) = 0.0017, P(Tgfb2) = 0.039. Source data are provided as a Source Data file.
Fig. 8
Fig. 8. CTCF cooperates with PRC2 complex to regulate SC differentiation.
a GSEA enrichment scores for sets of genes differentially regulated in rat SCs treated with siCtcf or control siRNA. n = 3 independent experiments. b GSEA enrichment scores for genes involved in lipid biosynthetic process (left) and myelin sheath (right) in SCs treated with control or siCtcf. c GSEA enrichment scores for genes modified with H3K27me3 and for genes targeted by SUZ12, EZH2, or EED in SCs treated with control or siCtcf. d GSEA enrichment scores for genes upregulated genes in Eed cKO nerves from published data. NES, normalized enrichment score. e–g Immunoblotting for e PRC2 complex and CTCF proteins and for f, g histones with indicated modifications in SCs treated with control or siCtcf. e, f n = 2 independent experiments; g n = 3 independent experiments. h–j Co-immunoprecipitation of h, i HA-SUZ12 with Flag-CTCF from extracts of transiently transfected HEK293T cells or of j endogenous SUZ12 with CTCF from rat SCs. n = 2 independent experiments. k qRT-PCR analysis showing Suz12 and differentiation-related and myelin-related gene expression in rat SCs transfected with control siRNA or with Suz12-targeted siRNA (n = 3 independent experiments) and induced to differentiate for 9 h. Data are presented as means ± SEM., ***P < 0.001, **P < 0.01, *P < 0.05; two-tailed unpaired Student’s t-test, P(Suz12) = 3.8E-05, P(Egr2) = 3.3E-05, P(Msn) = 0.0045, P(Lss) = 0.0031, P (Prx) = 1.5E-06, P(Fasn) = 0.0019, P(Hdac1) = 0.0019, P(Sdc4) = 0.0015, P(Srebf2) = 0.0026, P(Mal) = 0.008, P(Pllp) = 0.018, P(Mag) = 0.017, P(Notch3) = 0.012, P(Hes1) = 0.02. Source data are provided as a Source Data file.
Fig. 9
Fig. 9. CTCF and SUZ12 regulate transcriptomic dynamics during SC differentiation.
a Heatmap of CTCF ChIP-seq peaks from proliferating and differentiated SCs. n = 1 in each condition. b ChIP-seq enrichment around TSS regions in proliferative and differentiated SCs. c Immunoblotting for H3K27me3 in proliferating and differentiating SCs. n = 2 independent experiments. d Enriched motifs of transcription factors (TF) in the CTCF-bound regions. e–g ChIP-seq enrichment around CTCF binding regions for e CTCF, and g H3K27ac in rat SCs, f H3K27me3 in rat sciatic nerves. h Heatmap for H3K27me3 and H3K27ac. The sites are ranked in ascending order of H3K27ac intensity. n = 1 in each condition. i GSEA enrichment for genes with H3K27me3 peaks associated with TSSs in siControl or siCtcf rat SCs. NES, normalized enrichment score. j Overlap between CTCF-bound and upregulated genes differentially expressed in rat SCs treated with control siRNA or siCtcf. k Heatmap of CTCF-targeted upregulated genes in rat SCs treated with control siRNA or siCtcf. n = 3 in each condition. l Tracks for the indicated genes with ChIP-seq of CTCF from rat SCs and of H3K27me3 from rat sciatic nerves. n = 1 in each condition with 20 million cells. m Expression of the indicated genes in RNA-seq dataset from rat SCs treated with control siRNA or siCtcf. n = 3 independent experiments, P(Hes1) = 0.011, P(Ccnd2) = 0.01007, P(Rspo2) = 0.0105, P(Shh) = 0.019, P(Calca) = 0.041. n qRT-PCR for the indicated genes in rat SCs treated with control siRNA or siSuz12. n = 3 independent experiments, P(Rspo2) = 0.006, P(Shh) = 0.012, P(Calca) = 0.02. o ChIP-qPCR for H3K27me3 at the promoters of the indicated genes in rat SCs treated with control siRNA or siCtcf. IgG were normalized to 1; n = 3 independent experiments, P(Rspo2) = 0.039, P(Shh) = 0.011, P(Calca) = 0.039, P(Sox2) = 0.0094. Data are presented as means ± SEM, *P < 0.05, **P < 0.01, ***P < 0.001, two-tailed unpaired Student’s t-test. Source data are provided as a Source Data file.
Fig. 10
Fig. 10. CTCF-mediated chromatin regulatory looping is necessary for EGR2 expression.
a Venn diagrams depicting overlap between CTCF-bound genes and downregulated genes differentially expressed in rat SCs treated with control siRNA or siCtcf. b Heatmap of CTCF-targeted genes differentially downregulated in SCs treated with siCtcf compared to controls. n = 3 in each condition. c Genome browser tracks over the loci of selected myelin-related genes with ChIP-seq density mapping of CTCF, H3K27ac, and P300 from rat SCs. n = 1 in each condition with 20 million cells. d Quantitation of relative interaction frequencies between the indicated anchor site and neighboring Egr2 genomic restriction fragments. n = 3 independent 3C experiments. e Quantitation of relative interaction frequencies between the indicated anchor site and neighboring Sox10 genomic restriction fragments. n = 3 independent 3C experiments. f A model depicting a dual mode of action by CTCF in promotion of SC differentiation: CTCF stabilizes chromatin loops involving promotor-enhancer interactions to activate expression of promyelinating genes such as Egr2 (left panel) and forms a transcriptional co-repressor complex with SUZ12-PRC2 (right panel) to inhibit expression of genes such as Sox2 that encode factors that inhibit differentiation and cell-cycle/proliferation regulators. Data are presented as means ± SEM. Source data are provided as a Source Data file.

Similar articles

Cited by

References

    1. Li G, Reinberg D. Chromatin higher-order structures and gene regulation. Curr. Opin. Genet. Dev. 2011;21:175–186. - PMC - PubMed
    1. Kagey MH, et al. Mediator and cohesin connect gene expression and chromatin architecture. Nature. 2010;467:430–435. - PMC - PubMed
    1. Phillips JE, Corces VG. CTCF: master weaver of the genome. Cell. 2009;137:1194–1211. - PMC - PubMed
    1. Gregor A, et al. De novo mutations in the genome organizer CTCF cause intellectual disability. Am. J. Hum. Genet. 2013;93:124–131. - PMC - PubMed
    1. Flavahan WA, et al. Insulator dysfunction and oncogene activation in IDH mutant gliomas. Nature. 2016;529:110–114. - PMC - PubMed

Publication types

MeSH terms