. 2020 Aug 17;11(1):4118.
doi: 10.1038/s41467-020-17823-z.

Identifying proteins bound to native mitotic ESC chromosomes reveals chromatin repressors are important for compaction

Affiliations

Identifying proteins bound to native mitotic ESC chromosomes reveals chromatin repressors are important for compaction

Dounia Djeghloul et al. Nat Commun. .

Abstract

Epigenetic information is transmitted from mother to daughter cells through mitosis. Here, to identify factors that might play a role in conveying epigenetic memory through cell division, we report on the isolation of unfixed, native chromosomes from metaphase-arrested cells using flow cytometry and perform LC-MS/MS to identify chromosome-bound proteins. A quantitative proteomic comparison between metaphase-arrested cell lysates and chromosome-sorted samples reveals a cohort of proteins that were significantly enriched on mitotic ESC chromosomes. These include pluripotency-associated transcription factors, repressive chromatin-modifiers such as PRC2 and DNA methyl-transferases, and proteins governing chromosome architecture. Deletion of PRC2, Dnmt1/3a/3b or Mecp2 in ESCs leads to an increase in the size of individual mitotic chromosomes, consistent with de-condensation. Similar results were obtained by the experimental cleavage of cohesin. Thus, we identify chromosome-bound factors in pluripotent stem cells during mitosis and reveal that PRC2, DNA methylation and Mecp2 are required to maintain chromosome compaction.


Conflict of interest statement

The authors declare no competing interests.

Figures

Fig. 1
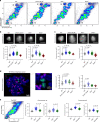
Fig. 1. Proteins bound to ESC-derived metaphase chromosomes.
a Scheme of experimental strategy used to isolate native metaphase chromosomes from ESCs and identify proteins bound to mitotic chromatin. Hoechst 33258 and chromomycin A3 bivariate karyotype was assessed by flow cytometry, and the gates used to sort all chromosomes, chromosome 19 or the X chromosome are indicated. Proteomic analysis was performed using LC-MS/MS on total mitotic cell lysate pellet, or on flow-purified chromosomes, to identify proteins bound to native metaphase chromosomes. b Diagram showing the number of proteins identified by proteomic analysis in mitotic lysate pellet and chromosome-sorted samples. c Volcano plot of proteins detected as being significantly enriched or depleted on sorted chromosomes relative to mitotic lysate pellet (unpaired two tailed Student’s t-test, permutation-based FDR < 0.01, n = 3 independent experiments each measured in duplicate, see ‘Methods’ section for details). Proteins were plotted as Log2 fold change (LFQ intensity of sorted chromosome pellet /LFQ intensity of mitotic lysate pellet) and significance (−Log10 p) using Perseus software. d Chromatin accessibility profile across chromosome 19 for asynchronous and mitotic cells, and flow-sorted chromosomes, shown as Log2 enrichment of ATAC-seq signal. ej Volcano plots as in c, highlighting e histones, f components of the proteasome, g Smc-associated proteins, h DNA replication machinery, i pluripotency-associated transcription factors or j chromatin repressors that are enriched (red), depleted (blue) or not significantly enriched (ns, black) on ESC mitotic chromosomes versus mitotic lysate pellet. k Localisation of Esrrb, Pcl2 and Suz12 fusion proteins (green, left panels) to mitotic chromatin in live ESCs cultured with SiR-DNA (grey, right panels). Arrows show Esrrb, Pcl2 and Suz12 localisation to mitotic chromatin. Scale bars = 14 μm. Images are representative of three independent experiments.
Fig. 2
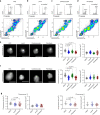
Fig. 2. Increased size of ESC metaphase chromosomes that lack DNA methylation or PRC2 activity.
a Flow karyotype of mitotic chromosomes isolated from WT ESCs or mutant ESCs that lack Dnmt1/3a/3b, Eed or Sox2. Gates used to isolate chromosomes 19 or X are indicated. Images are representative of three independent experiments. b, c Representative images of mitotic chromosomes 19 (b) and X (c) from different ESCs are shown, where DAPI stain (grey) and Cenpa label (green) indicate the chromosome body and centromere, respectively. Scale bars = 5 μm. Chromosome and centromere sizes were calculated for each ESC line by measuring individual chromosomes (chromosome 19: n = 217, 182, 100 and 101; chromosome X: n = 189, 201, 99 and 98) and centromeres (chromosome 19: n = 100, 82, 90 and 100; chromosome X: n = 76, 71, 114 and 98) over three independent experiments, mean ± SD are shown. P-values of statistically significant increases, measured by unpaired two tailed Student’s t-tests, are indicated. d Representative image of ESC metaphase spread stained with chromosome 19 painting probe (green), gamma satellite probe (red) and DAPI (blue). Scale bars = 4 μm and 2 μm for the metaphase spread and zoom-in images, respectively. Chromosome and centromere sizes of chromosome 19 were calculated by measuring metaphase spreads of WT (n = 29), Dnmt1,3a,3b−/− (n = 20), Eed−/− (n = 31) and Sox2−/− (n = 28) ESCs over three independent experiments, mean ± SD are shown. P-values of statistically significant increases, measured by unpaired two tailed Student’s t-tests, are indicated. e Flow karyotype and mitotic chromosome sizes of Eed−/− ESCs before and after restoring Eed expression (Eed BAC). Chromosome and centromere sizes were measured for each ESC line by measuring individual chromosomes (chromosome 19: n = 137, 86 and 80; chromosome X: n = 130, 91 and 81) and centromeres (chromosome 19: n = 100, 90 and 102; chromosome X: n = 84, 113 and 100) over three independent experiments, mean ± SD values are shown. P-values of statistically significant decreases, measured by unpaired two tailed Student’s t-tests, are indicated. be Source data are provided as a Source data file.
Fig. 3
Fig. 3. Increased size of mitotic chromosomes in ESCs lacking Mecp2.
a Mecp2 association with chromatin throughout mitosis using live cell imaging of Mecp2-eGFP fusion protein in ESCs. Selected time frames from the same dividing cell are shown. Scale bar = 14 μm. Images are representative of three independent experiments. b Flow karyotype of mitotic chromosomes isolated from Mecp2lox/y or Mecp−/y ESCs. Gates used to isolate chromosomes 19, 3 or X are indicated. Images are representative of three independent experiments. c Representative images of mitotic chromosomes 19, 3 and X from Mecp2lox/y and Mecp2−/y ESCs are shown, where DAPI stain (grey) and Cenpa label (green) indicate the chromosome body and centromere, respectively, scale bars = 5 μm. Chromosome and centromere sizes were calculated for each ESC line by measuring individual chromosomes (chromosome 19: n = 100 and 100; chromosome 3: n = 80 and 100; chromosome X: n = 100 and 100) and centromeres (chromosome 19: n = 55 and 60; chromosome 3: n = 60 and 60; chromosome X: n = 80 and 70) over three independent experiments, mean ± SD are shown. d Representative image of Mecp2lox/y ESC metaphase spread stained with chromosome 19 painting probe (green), gamma satellite probe (γsat, pink) and DAPI (blue), scale bar = 4 μm. Chromosome and centromere sizes of chromosome 19 were calculated by measuring metaphase spreads of Mecp2lox/y (n = 8) or Mecp2−/y (n = 14) ESCs, mean ± SD are shown. c, d P-values of statistically significant increases, measured by unpaired two tailed Student’s t-tests, are indicated. Source data are provided as a Source data file.
Fig. 4
Fig. 4. Native mitotic ESC chromosomes are larger than equivalents isolated from differentiated cells.
ad Cell cycle profiles of mouse ESCs (a), pre-B cells (b), cardiomyocytes (c) and embryonic fibroblasts (d) were determined by staining with propidium iodide. Left panel shows asynchronized (async) cells, right panel shows samples 6–12 h after treatment with demecolcine (m-arrested), where values indicate the percentage cells in G2/M stage. Lower panel shows flow karyotype of demecolcine-treated cells and the gates used to isolate chromosomes 19 and X. Images are representative of three independent experiments. e, f Representative images of native mitotic chromosomes 19 (e) and X (f) isolated from mouse ESCs, pre-B cells, cardiomyocytes (HL-1) and embryonic fibroblasts. DAPI stain (light grey) and Cenpa (green) labelling are shown, scale bars = 5 μm. Chromosome and centromere sizes were determined for each cell type by measuring individual chromosomes (chromosome 19: n = 137, 149, 88 and 106; chromosome X: n = 129, 132, 134 and 103) and centromeres (chromosome 19: n = 119, 100, 72 and 83; chromosome X: n = 81, 81, 70 and 60) over three independent experiments, mean ± SD are indicated. g Chromosome and centromere sizes of chromosome 19 (left panel) and chromosome X (right panel) were calculated by measuring metaphase spreads of ESCs (n = 23), pre-B cells (n = 22) and embryonic fibroblasts (n = 36), mean ± SD are indicated. eg P-values of statistically significant decreases, measured by unpaired two tailed Student’s t-tests, are indicated. Source data are provided as a Source data file.
Fig. 5
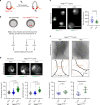
Fig. 5. Experimentally induced cleavage of cohesin alters flow-sorted mitotic chromosome size.
a Experimental strategy used to cleave cohesin using TEV protease; illustrated is a cohesin ring containing Smc1, 3 and Rad21-Tev-Myc. b Scheme used to isolate and image mitotic chromosomes from WT and Rad21-Tev-myc (Rad21Tev/Tev) pre-B cells. Mitotic chromosomes from WT pre-B cells or from Rad21Tev/Tev pre-B cells were purified by flow cytometry, and incubated with (+) or without (−) TEV protease. c Myc labelling (green) of Rad21Tev/Tev purified chromosome 19 shows reduced Myc levels after treatment with TEV protease (images left, and quantified by intensity, right). Scale bar = 5 μm, n = 38 chromosomes for −TEV and n = 40 chromosomes for +TEV, mean intensity values ± SD are shown. d Representative super-resolution SIM images of purified mitotic chromosome 19 isolated from WT or Rad21Tev/Tev pre-B cells, treated with TEV in situ (+TEV) or with buffer alone (−TEV). Scale bars = 2.86 μm. Chromosome and centromere sizes were determined for each condition by measuring individual chromosomes (n = 101, 101 and 101) and centromeres (n = 65, 64 and 61), values indicate mean ± SD. e Representative slices through cryo-electron tomograms (Cryo-ET) of chromosome 19 isolated from Rad21Tev/Tev pre-B cells and treated with TEV in situ (+TEV) or with buffer alone (−TEV) (top panel) and Cryo-ET image explanation (middle panel). Graphs show chromosome size, calculated as area measurements from 2D electron microscopy images, mean ± SD are indicated. Values from two independent experiments are shown, n = 20 and 28 chromosomes for experiment 1 and n = 14 and 21 chromosomes for experiment 2, for −TEV and +TEV respectively. ce P-values were calculated using an unpaired two tailed Student’s t-test. Source data are provided as a Source data file.

References

    1. Hermann A, Goyal R, Jeltsch A. The Dnmt1 DNA-(cytosine-C5)-methyltransferase methylates DNA processively with high preference for hemimethylated target sites. J. Biol. Chem. 2004;279:48350–48359. - PubMed
    1. Probst AV, Dunleavy E, Almouzni G. Epigenetic inheritance during the cell cycle. Nat. Rev. Mol. Cell Biol. 2009;10:192–206. - PubMed
    1. Yu C, et al. A mechanism for preventing asymmetric histone segregation onto replicating DNA strands. Science. 2018;361:1386–1389. - PMC - PubMed
    1. Petryk N, et al. MCM2 promotes symmetric inheritance of modified histones during DNA replication. Science. 2018;361:1389–1392. - PubMed
    1. Reveron-Gomez N, et al. Accurate recycling of parental histones reproduces the histone modification landscape during DNA replication. Mol. Cell. 2018;72:239–249 e235. - PMC - PubMed

Publication types

MeSH terms